Correction to: Neurotherapeutics volume 18, pages 1081–1094 (2021) https://doi.org/10.1007/s13311-020-00972-w
In this article Figs. 3, 4, and 5 have been updated.
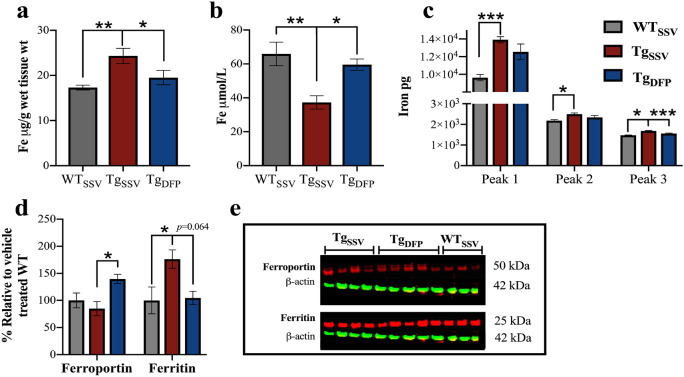
Fig. 3.
Effects of DFP on iron. ICP-MS analysis was used to measure iron levels in a brain homogenates and in b blood plasma. c Iron bound to metalloproteins in brain homogenates was measured using SEC–ICP–MS. The area under the curve was averaged for each mouse within each group to examine iron content within each peak, which corresponds to the chromatogram shown in ESI Fig. S1. Peak 1 is associated with ferritin-like proteins, peak 2 may be associated with cytochrome c, and proteins associated with peak 3 are low-molecular-weight iron–protein complexes, which require further investigation. d Densitometry analysis normalized to ß-actin of e representative western blot images of ferroportin, ferritin and ß-actin in the hippocampus (note, antibodies were probed on the same blot). One-way ANOVA, Tukey’s post hoc test. Error bars represent ± SEM. WTSSV, vehicle-treated WT mice; TgSSV, vehicle-treated rTg4510 mice; TgDFP, DFP-treated rTg4510 mice. n = 9/group; *p < 0.05; **p < 0.001, ***p < 0.0001
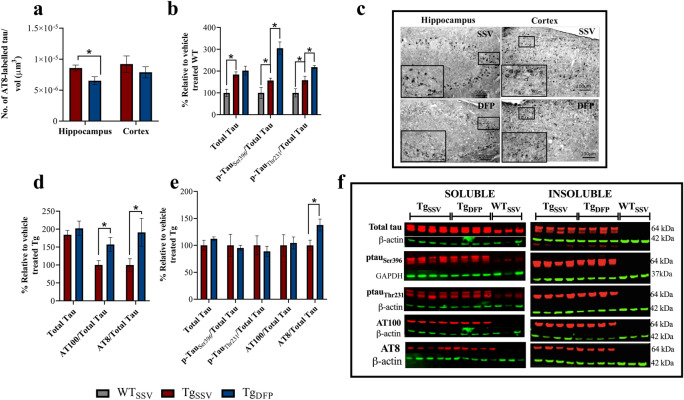
Fig. 4.
Effects of DFP on tau pathology. a, c Stereological estimates of AT8-labeled tau in the hippocampus and cortex (2-tailed t test). Ratios of p-tau/total tau in soluble hippocampus fractions (b, one-way ANOVA, Tukey’s post hoc test; d, 2-tailed t test). e, Ratios of p-tau/total tau in insoluble hippocampus fractions (2-tailed t test). f, Representative western blot images (note, some antibodies were probed on the same stripped blots used in Fig. 4 and Fig. 5) of total and p-tau in the hippocampus. Ratios of p-tau/total tau were determined using normalized ß-actin or GAPDH values. Error bars represent ± SEM. TgSSV, vehicle-treated rTg4510 mice; TgDFP, DFP-treated rTg4510 mice. n = 6/group; * p < 0.05
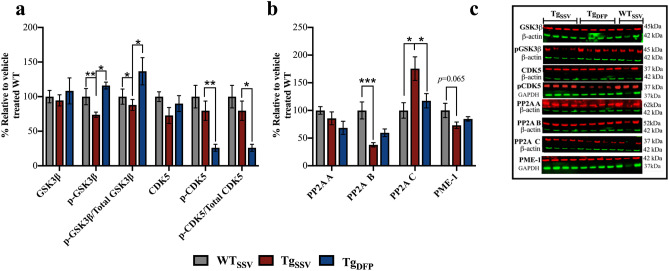
Fig. 5.
Effects of DFP on tau phosphorylation pathways. a, b Densitometry analysis normalized to ß-actin or GAPDH of c representative western blot images (note, some antibodies were probed on the same stripped blots used in Fig. 4 and Fig. 5) of total GSK3β, pGSK3β, total CDK5, pCDK5, PP2A A, PP2A B, PP2A C and PME-1. Ratios of p-kinase/total kinase were determined using normalized ß-actin or GAPDH values. One-way ANOVA, Tukey’s post hoc test. Error bars represent ± SEM. WTSSV, vehicle-treated WT mice; TgSSV, vehicle-treated rTg4510; TgDFP, DFP-treated rTg4510 mice. n = 9/group; *p < 0.05; **p < 0.001; ***p < 0.0001
The original article has been corrected.
Footnotes
The article to which this update relates has been retracted. Please see the retraction notice for more detail: 10.1007/s13311-023-01448-3
Publisher's Note
Springer Nature remains neutral with regard to jurisdictional claims in published maps and institutional affiliations.


