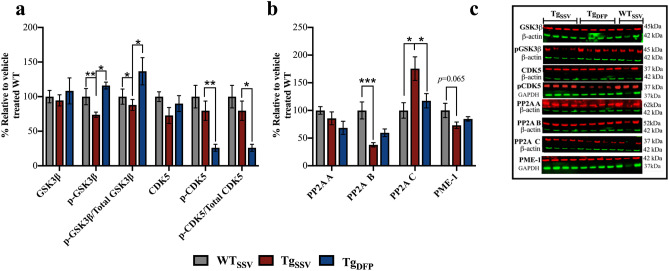
Fig. 5.
Effects of DFP on tau phosphorylation pathways. a, b Densitometry analysis normalized to ß-actin or GAPDH of c representative western blot images (note, some antibodies were probed on the same stripped blots used in Fig. 4 and Fig. 5) of total GSK3β, pGSK3β, total CDK5, pCDK5, PP2A A, PP2A B, PP2A C and PME-1. Ratios of p-kinase/total kinase were determined using normalized ß-actin or GAPDH values. One-way ANOVA, Tukey’s post hoc test. Error bars represent ± SEM. WTSSV, vehicle-treated WT mice; TgSSV, vehicle-treated rTg4510; TgDFP, DFP-treated rTg4510 mice. n = 9/group; *p < 0.05; **p < 0.001; ***p < 0.0001

