Abstract
Transfusion-dependent patients typically develop iron-induced cardiomyopathy, liver disease, and endocrine complications. We aimed to estimate the incidence of endocrine disorders in transfusiondependent thalassemia (TDT) patients during long-term iron-chelation therapy with deferasirox (DFX). We developed a multi-center follow-up study of 426 TDT patients treated with once-daily DFX for a median duration of 8 years, up to 18.5 years. At baseline, 118, 121, and 187 patients had 0, 1, or ≥2 endocrine diseases respectively. 104 additional endocrine diseases were developed during the follow-up. The overall risk of developing a new endocrine complication within 5 years was 9.7% (95% Confidence Interval [CI]: 6.3–13.1). Multiple Cox regression analysis identified three key predictors: age showed a positive log-linear effect (adjusted hazard ratio [HR] for 50% increase 1.2, 95% CI: 1.1–1.3, P=0.005), the serum concentration of thyrotropin showed a positive linear effect (adjusted HR for 1 mIU/L increase 1.3, 95% CI: 1.1–1.4, P<0.001) regardless the kind of disease incident, while the number of previous endocrine diseases showed a negative linear effect: the higher the number of diseases at baseline the lower the chance of developing further diseasess (adjusted HR for unit increase 0.5, 95% CI: 0.4–0.7, P<0.001). Age and thyrotropin had similar effect sizes across the categories of baseline diseases. The administration of levothyroxine as a covariate did not change the estimates. Although in DFX-treated TDT patients the risk of developing an endocrine complication is generally lower than the previously reported risk, there is considerable risk variation and the burden of these complications remains high. We developed a simple risk score chart enabling clinicians to estimate their patients’ risk. Future research will look at increasing the amount of variation explained from our model and testing further clinical and laboratory predictors, including the assessment of direct endocrine magnetic resonance imaging.
Introduction
Transfusion-induced iron overload in thalassemia patients typically results in iron-induced cardiomyopathy, liver disease, and endocrine complications. However, those three phenomena have been studied to different extents.
In transfusion-dependent thalassemia (TDT) patients, mortality due to cardiovascular and hepatic complications has markedly declined during the last decades.1–3 The development of magnetic resonance imaging techniques (MRI), specifically designed to quantify myocardial and hepatic iron concentration, measuring heart T2* and liver iron concentration (LIC), has enabled the design of clinical trials evaluating the efficacy of iron chelators in targeting specific iron overload.4 Moreover, new anti-hepatitis C drugs have remarkably reduced the complications linked to hepatitis C infection, which used to dramatically deteriorate liver iron overload.5
However, in spite of the outstanding advances in the care of cardiovascular and hepatic complications due to blood transfusions, the management of endocrine complications has been left behind and, nowadays, they are the most frequent and the most resource-draining complications in TDT patients.3 In addition, serological testing fails to identify high-risk groups and, once occurred, these complications are often irreversible. While MRI imaging of endocrine glands is promising in detecting preclinical disease, it has not reached the level of validation required for routine clinical use.6
The once-daily oral iron chelator deferasirox (DFX) was shown to be effective in chelating iron from the heart and the liver, with preservation of the heart function,7–9 and with reversal of the hepatic fibrosis.10 While the effective control of heart and liver siderosis remains the primary goal in the management of TDT patients, observational data suggest that iron loading in endocrine organs may precede myocardial involvement and there is now substantial evidence on the role of iron overload in endocrine morbidity.11–14 While there have been small studies on endocrine disorders in TDT patients during chelation therapy with DFX,15,16 the data are still scarce, even though DFX is nowadays the most prescribed drug for iron chelation in TDT patients.17
The aim of this study was to assess the incidence of endocrine diseases including hypothyroidism, hypoparathyroidism, glucose metabolisms disorders, hypogonadism, and metabolic bone disease in patients suffering from TDT who are on treatment with the drug DFX.
Methods
In this multi-center study, TDT patients from 21 hospitals located in 21 cities and 19 regions of Italy were assessed for eligibility to be recruited in the cohort.
We considered the following endocrine conditions:
1. Hypothyroidism (overt: thyrotropin [TSH] >10 mU/mL and low free thyroxine [FT4]; subclinical: TSH 5–10 mU/mL and normal FT4).
2. Hypoparathyroidism (low parathyroid hormone [PTH] and calcium and high phosphorus).
3. Hypogonadism (hypogonadotropic hypogonadism, in adult female: amenorrhea, low estradiol levels and low or normal luteinizing hormone and follicle stimulating hormone [LH/FSH] levels; in adult male: low testosterone levels, clinical signs or symptoms consistent with hypogonadism and low/normal LH/FSH. Testosterone reference ranges vary according to patients’ age at the time of biochemical assessment. In general, they were regarded as normal if >3.5 ng/mL and unequivocally pathological <2.3 ng/mL. Additional data [clinical features, free testosterone] were taken into account for values between 2.3 and 3.5 ng/mL. Hypergonadotropic hypogonadism, in adult female: amenorrhea and raised FSH [>30 U/L] with undetectable estradiol; in adult male: raised gonadotropins with low total testosterone and clinical signs consistent with hypogonadism).
4. Pubertal disturbances (delayed puberty: lack of breast budding [Tanner stage 2] in girls by the age of 13 and testicular volume <4 mL in boys by the of 14; arrested puberty: lack of pubertal progression over a year or more).
5. Disorders of glucose metabolism (diabetes: fasting plasma glucose ≥126 mg/dL or 2-hour plasma glucose [2-h PG] value during a 75-g oral glucose tolerance test [OGTT] >200 mg/dL; impaired fasting glucose [IFG]: fasting glucose between 100 and 125 mg/dL; impaired glucose tolerance: 2-h PG during 75-g OGTT levels between 140 and 199 mg/dL).
6. Bone metabolism disorder (BMD) (osteoporosis: bone mineral density T score ≤-2.5 and Z score value ≤-2; osteopenia: T score value 1.01/-2.5 and Z score value 1.01/-2. In childhood, osteoporosis was defined by either the association of at least two pathological fractures by the age of 10 years/ three by the age of 19 and Z score ≤-2 or by the finding of at least one vertebral crush, in the absence of high-energy trauma or local disease, irrespectively of the BMD recorded; low bone mineral density was defined as the finding of BMD Z score ≤-2, in the absence of the above-mentioned additional criteria for osteoporosis).
According to standardized protocols,18 laboratory tests for detection of endocrine disorders were performed every year in patients with no endocrine complications and more frequently (every 3-6 months) in patients with endocrine disorders, as per consolidated clinical practice and according to the endocrinologists’ prescription. Routine laboratory tests, such as glycemia and serum electrolytes, were assessed every 1-3 months in occasion of pre-transfusion cross-match testing. Weight, height and Tanner stage were assessed every 6 months in patients <18 years of age.
The study protocol was approved by Ethical Committees and Institutional Review Boards of all the participating centers and was conducted in accordance with the Declaration of Helsinki and ICH guidelines for good clinical practice. All patients provided written informed consent.
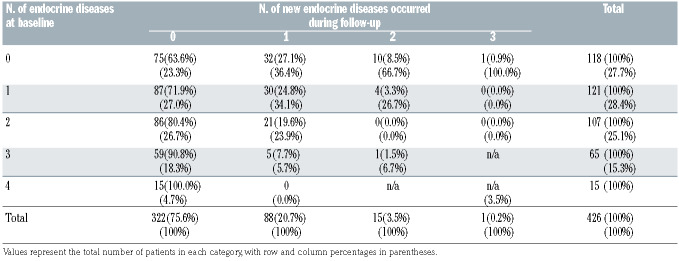
Table 1.
Cross-tabulation of number of conditions at baseline and number of conditions occurred during the follow-up.
A detailed description of all methods used is available in the Online Supplementary Appendix.
Statistical analysis
Data were cleaned before the analysis: we checked all variables for missing, illogical or implausible values, also through crosschecks with related variables (e.g., chronologic orders). Continuous variables were checked for abnormal distributions and outliers. We used Cox-regression to fit survival analyses with follow-up days as the underlying time variable. Survival time was measured as the number of days passed from the beginning of the treatment regimen with the drug DFX to the first of either the diagnosis of the first new endocrine disease, side effect due to DFX leading to therapy suspension, death, or censoring. We centered the covariates before interaction analyses. We adopted two strategies for the development of the multiple models: we either started with the covariates having higher biological plausibility of effect or with those with a lower P-value from at the bivariate stage. The two approaches reached the same final model. The assumption of proportional hazards was checked by using the Schoenfeld residuals test. We computed the proportion of variation explained by the models (adjusted R2) using the Royston method with bootstrap confidence intervals (5,000 replications).19 We derived the predicted probabilities of developing a new endocrine disease within 5 years and 1 year by using the margins command in Stata v.14. Two patients were excluded from the analysis as they already had all possible five endocrine diseases at baseline.
Results
Out of 426 patients enrolled, accounting for 3,517 person per years, 104 participants developed at least one new endocrine disease after a mean and median followup time of 8 years (range, 1 month–18.5 years). The mean iron intake at baseline was 0.28+/-0.08 mg/kg/day (range, 0.14–0.49 mg/kg/day) and at the end of study was 0.26+/- 0.12 mg/kg/day (range, 0.16–0.50 mg/kg/day). The mean hemoglobin level was 9.8+/-0.68 g/dL (range, 9.4–10.6 g/dL) indicating the majority of patients had good control of their chronic anemia.
No deaths were recorded. Overall, 18 (4%) patients experienced adverse events (AE) that determined temporary or permanent DFX discontinuation. The most frequent AE were related to gastrointestinal intolerance (epigastralgia, heartburn, abdominal pain; n=8) and increased transaminases (n=8). Increased in serum creatinine (n=1) and Lichen planus (n=1) were reported as other AE which caused DFX interruption. In nine (2%) cases DFX was discontinued because of treatment failure, reported as increase in serum ferritin (n=6), cardiac T2* (n=2), LIC (n=1). In one case treatment failure was reported along with gastrointestinal intolerance.
Table 1 shows a cross-tabulation between the number of endocrine diseases at baseline and the number of new endocrine diseases that occurred during the follow-up. The 75.6% of the total sample (322 of 426) did not develop any new endocrine disease during the follow-up (95% Confidence Interval [CI]: 71.2–79.6). Out of the 104 (24.4%) with newly diagnosed endocrinopathies, 84.6% developed only one endocrine disease (95% CI: 76.2– 90.9). Out of 118 patients with no endocrine diseases at baseline, 43 (36.4%) developed at least one endocrine disease during the follow-up (95% CI: 27.8–45.8). Out of 121 patients having one endocrine disease at baseline already, 34 (28.1%) developed at least one additional endocrine disease during the follow-up (95% CI: 20.3– 37.0).
Among the 118 patients with no endocrine diseases at baseline, BMT disorders occurred the most (17.8% [95% CI:11.4–25.9]), followed by hypogonadism (12.7% [95% CI=7.3–20.1]). Those two conditions were also the most prevalent ones in patients with one disease at a baseline (80.2% [95% CI: 71.9–86.9] and 11.6% [95% CI: 6.5– 18.7] respectively) and were those that most likely occurred as additional diseases during the follow-up.
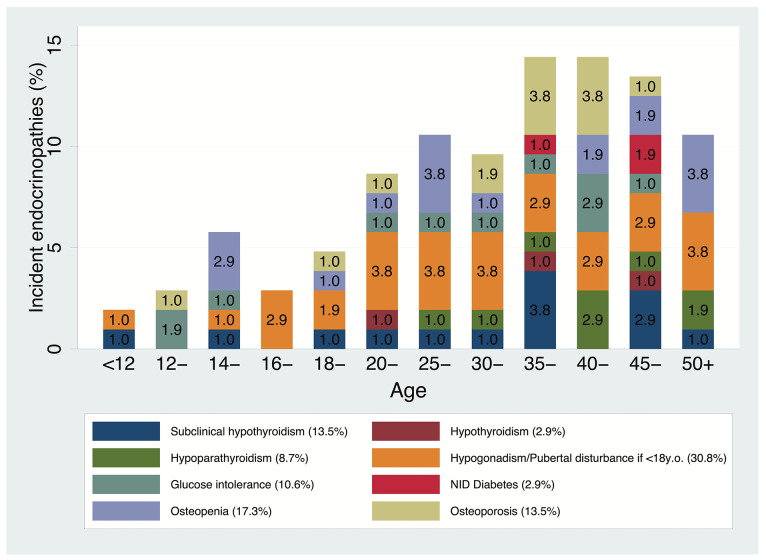
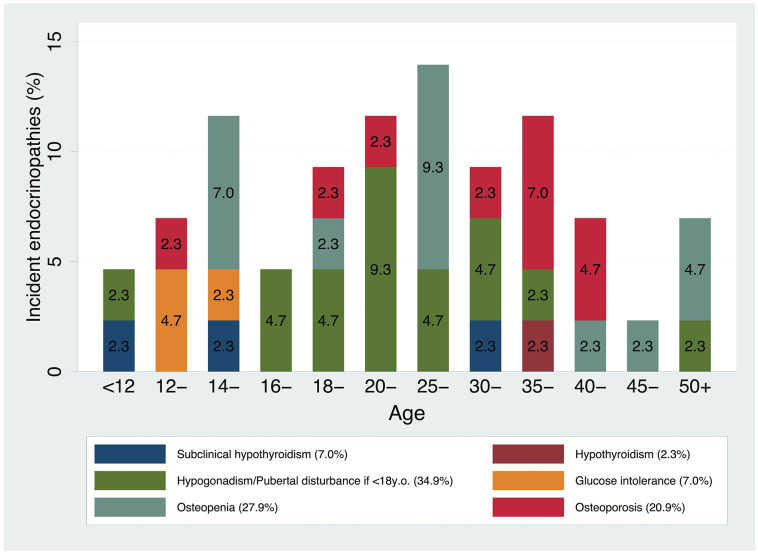
Figure 1 shows the overall crude risks for all 104 first incidents, by incident type and age group. It appears that most of the new incidents occurred after the age of 20 years, with a new spike between 35 and 45 years. As for pediatric patients, the increase seems to start after the age of 12 years. No cases of insulin-dependent diabetes were reported in patients with no endocrine disorders at baseline (Figure 2). Kaplan-Meier survival probability curves with age as the underlying time variable are reported in the Online Supplementary Appendix.
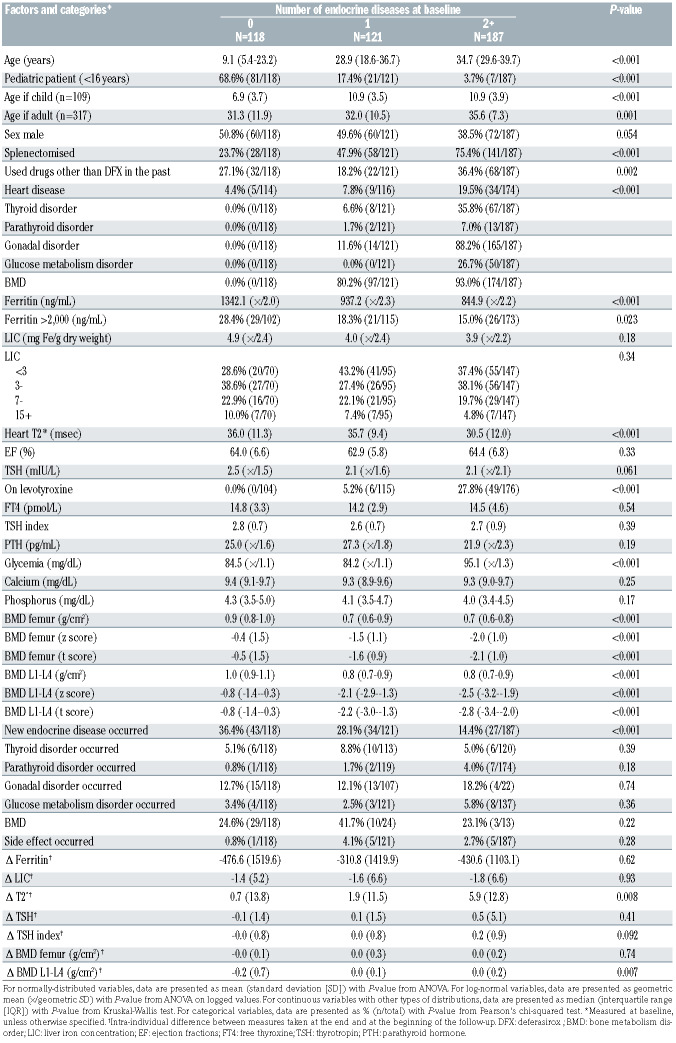
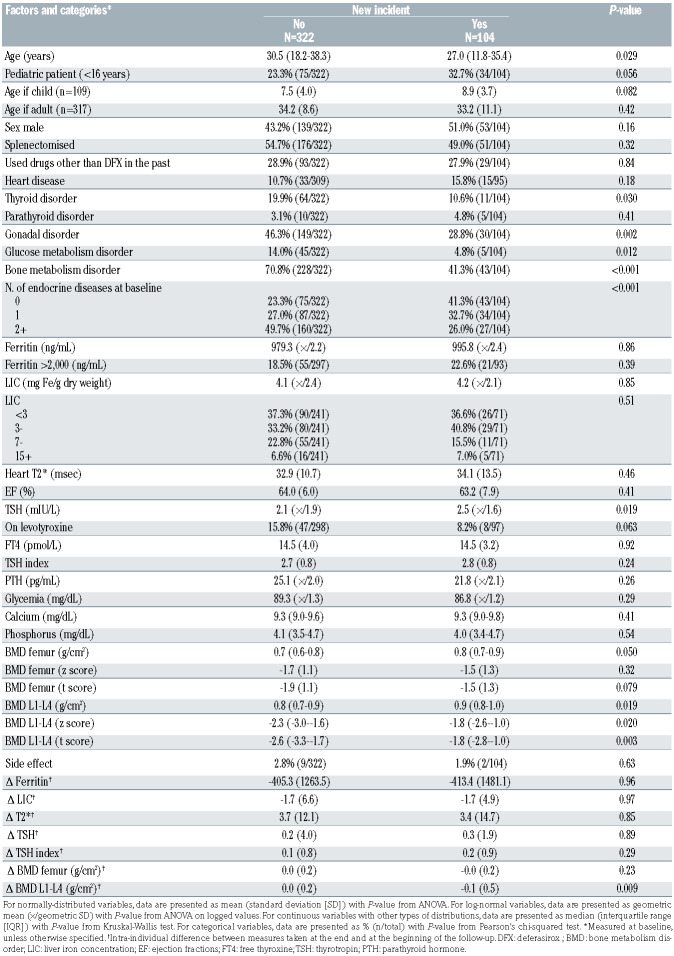
Tables 2A and 2B show a description of the sample by prevalent endocrine diseases at baseline and by incident endocrine diseases during the follow-up. Age, TSH, and low BMD were associated with both prevalent and incident disorders. Among the markers of iron overload, ferritin and T2* were associated with prevalent but not with incident disorders, whereas LIC was not associated with any of them. During the follow-up, iron overload test results either decreased by a small extent or remained stable over time, while the standard deviation of those differences was more than three times their means. The number of prevalent endocrine disorders was inversely associated with the incidence of a new disorder. Only 11 patients (2.6%) had a side-effect related to DFX administration (gastrointestinal disorder).
Tables 3A and 3B show the results from the multiple Cox regression models. In both models, the adjusted hazard rate of developing a new endocrine disorder decreased by about 50% for each prevalent endocrine disease at baseline (P<0.001) and increased by about 25% for each mIU/L of TSH at baseline (P<0.001). The two models differ in the way in which the variable age was treated. In model 3A age was treated as a log-linear variable whereas in model 3B age was treated as a linear variable, but in that case, also a binary indicator was included for pediatric/adult patient and an interaction term between age and the indicator as well. The latter model showed a higher adjusted R2 (0.25 vs. 0.22) although that difference was not significant (95% CI: 0.19–0.42 vs. 95% CI: 0.10–0.37). According to model 3A, each 50% increase in age was associated with an increase of about 18% in the hazard of an incident new disease (P=0.005) after having adjusted for TSH and number of previous endocrine conditions. Kaplan-Meier survival probability curves are reported in the Online Supplementary Appendix.
Figure 1.
Overall crude risks for all 104 first incidents (n=426), by incident type and age group.
Figure 2.
Crude risks for all 43 first incidents in patients with no endocrinopathies at baseline (n=118), by incident type and age group.
Table 2A.
Sample description stratified by number of endocrine diseases at baseline.
Table 2B.
Sample description stratified by categories of outcome measure.
Table 3A.
Risk factors for developing a new endocrine disease during the follow-up: results from the simplest multiple Cox regression model.

Table 3B.
Risk factors for developing a new endocrine disease during the follow-up: results from the multiple Cox regression model showing the highest adjusted R2, which was used to draw the risk charts.
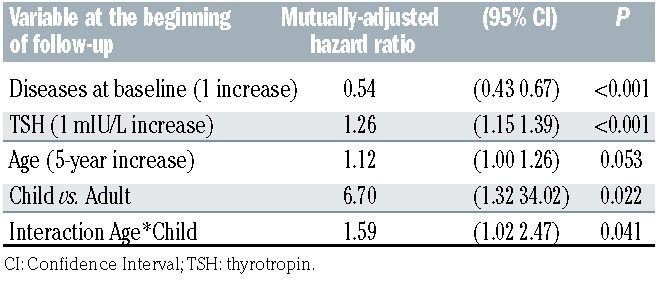
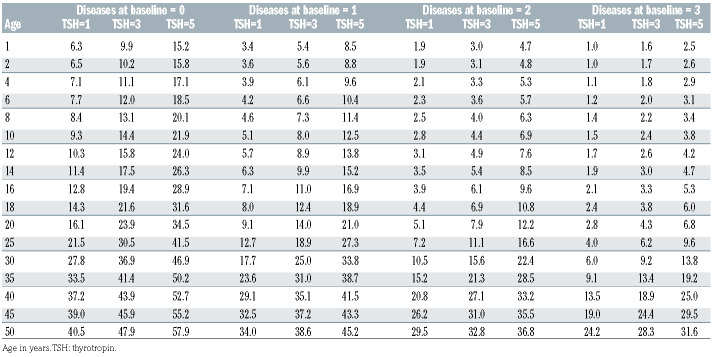
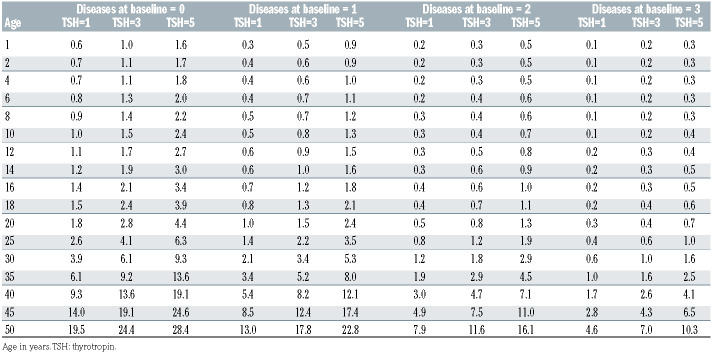
Table 4A shows the 5-year risk predictions according to levels of age, TSH, and number of endocrine diseases at baseline, based on estimates from model 3B. On average, the whole cohort of patients had a risk of 9.7% (95% CI: 6.3–13.1) of developing an additional endocrine disease within 5 years from the start of therapy with the drug DFX. However, there was considerable variation according the baseline conditions. For example, an average 14- year-old patient with a TSH of 3 mIU/L who already suffered from one endocrine disorder had a risk of developing another disorder within 5 years of about a 10%, whereas a 35-year-old patient with a TSH of 5 mIU/L and no disease at baseline had a risk of 50%. Table 4B shows the 1-year risk predictions according to levels of age, TSH and number of endocrine diseases at baseline, based on estimates from model 3B. The overall 1-year risk was 1.1% (95% CI: 0.6–1.7).
Fifty-five patients were on therapy with levothyroxine at the beginning of the follow-up. We carried out a sensitivity analysis by running the same analysis on patients who were and were not on levothyroxine separately to see if levothyroxine modified the estimates from the final models. In patients who were (n=55) and were not (n=371) on levothyroxine, the adjusted hazard ratio [HR] for 1 mIU/L increase in TSH was 1.26 (95% CI: 1.02–1.55, P=0.032) and 1.29 (95% CI: 1.07–1.56, P=0.006) respectively. The estimates from the other predictors did not change either. Therefore, TSH was a predictor of additional endocrine disease incidence regardless of levothyroxine administration. In addition, we conducted stratified analyses after splitting the sample at the median follow- up time, or at the age of 16 years, or at 0/1+ prevalent endocrine diseases at baseline. The results from those subgroup analyses were similar to the main one.
Given that chronic iron overload is supposed to be the main driver of endocrine complications due to blood transfusions, we have not only used the baseline markers of iron overload (ferritin, LIC, and T2*) in our predictive models, but we have also tested the latest available measures and the difference between initial and final measures. In no cases had those markers any effect on the incidence of endocrine complications. TSH was not correlated with any marker of iron overload (Spearman's rhos <0.07, P>0.18).
Discussion
Endocrine complications remain the most common and resource-consuming disorders secondary to iron overload in TDT patients. In historical cohorts, disturbances of sexual axis affected 80% of patients, while BMD and short stature were reported in up to 60% and 50% of the overall study population, respectively. Prevalence of hypothyroidism and diabetes ranged from 6% to 14%, while hypoparathyroidism was reported up to 25%.18
In our long-term cohort study of patient affected by TDT treated with the iron-chelating drug DFX, the risk of developing an endocrine complication is generally lower than the previously reported risk, but there is considerable risk variation, according to several parameters such as patient’s age, number of endocrine complications already present before the start of the therapy, and TSH serum concentration. We developed a simple risk chart enabling clinicians to derive an approximate estimate of their patients’ risk.
Ferritin, LIC and cardiac T2* are considered as markers of iron overload, but the correlation between those markers and risk of endocrine complications is controversial,20 since many studies have shown no correlation,21–23 confirming our results. This disconnection with iron-overload parameters has been observed also in chronic metabolic syndromes, although substantial evidence shows that the clinical course of these disorders is affected by iron overload.24 The different mechanisms of iron uptake and accumulation among different organs may be responsible of that phenomenon. Iron accumulates in the liver due to transferrin-mediated mechanisms and LIC has inadequate ability to predict that risk in extrahepatic organs.20 The endocrine glands and the heart, instead, develop pathologic iron overload exclusively through uptake of non-transferrin bound iron (NTBI). The mechanism by which this uptake occurs is controversial, too, but L-type calcium must play a role as it is present in large quantities in cardiomyocytes, pancreatic b cells, in various cell types of the anterior pituitary gland (including gonadotrophs, thyrotrophs, and corticoptrophs), and in the parathyroid-hormone-producing cells of the parathyroid gland.25 Although NTBI composes a very small fraction of body iron, it produces oxidative stress and organ damage.26 While elevated LIC increases patients’ risk of iron-overload complications, there is not a LIC threshold below which cardiac and endocrine iron accumulation does not occur.27 The explanation of this paradox is that many chronically transfused patients have fully-saturated transferrin, regardless of their LIC,28 and, as heart and endocrine glands exclusively accumulate NTBI, it is possible for them to be in positive iron balance even if the total body iron balance (LIC) is neutral or negative.27 Patients who miss chelator doses expose their extrahepatic organs to unrestricted uptake of labile iron species.29
Table 4A.
Predicted risk chart for developing a new endocrine disease within 5 years, in percentages. The overall 5-year risk was 9.7%
Table 4B.
Predicted risk chart for developing a new endocrine disease within 1 year, in percentages. The overall 1-year risk was 1.1%
Previous studies reported a correlation between cardiac T2* and manifest endocrinopathies.21,22 However, those studies concerned patients with severe iron overload, with T2* <20 msec, while our sample had average ferritin <1,000 ng/mL, LIC <5 mg/dry weight (dw), and T2* >30 msec which are considered as the acceptable target levels to reach during iron-chelating therapy.18 It has been shown that the iron overload of endocrine glands preceded that of the heart, although both phenomena are mediated by NTBI.11 However, endocrine organs have superior reserve capacity and the clinical manifestations concerning them may appear years after silent iron accumulation.12 When iron overload continues, due to the lack of patient compliance or due to an inadequate dose of iron-binding therapy, the heart starts to show signs of overload, which can be identified through MRI-T2*.20 Therefore, cardiac T2* is not an early indicator of iron overload. We have not found a correlation between T2* and endocrine complications in our cohort of patients, as the vast majority of our patients had an acceptable iron balance. Abnormal cardiac T2* is an excellent marker of NTBI control, but it is insensitive because exposure must be severe and quite prolonged. As a result, abnormal cardiac T2* has a very high positive predictive value for endocrine iron deposition. However, once the heart has been successfully de-ironed, endocrine glands typically retain moderate iron deposition. Finally, even when the endocrine glands have been successfully de-ironed, their functional reserve has been destroyed.4,11,12,20-22
As there is considerable variation in the risk of endocrinopathies in patients without signs of heart and liver overload,17,21,22,30–32 and because those kinds of endocrinopathies, when manifest, are irreversible,17,21,22,30–32 further clinical and laboratory predictors in addition to MRI imaging of endocrine glands are needed to prevent endocrine complications.
We proposed our risk chart on the model 3B, in which the association between risk of complication and age was considered as being linear, while adding a binary marker of adulthood and an interaction parameter between age and adulthood. We preferred this model to the simpler model 3A (log-linear age alone) because it had a slightly better R2 and mostly because adults and children affected by TDT are usually treated in separate health care centers and as a matter of fact they define two separate categories. We have developed the largest analysis on endocrine complications in TDT patients ever developed so far and this is the first study providing clear benchmarks for patients’ management. However, the predictive power of our risk chart must be improved and validated.
It is plausible that a diagnosis of an endocrinopathy produces a warning effect that is similar to that observed after an abnormal cardiac T2*, which makes patients have better compliance and clinicians increase iron-chelating dose.33 That may explain why previous endocrinopathies were associated with lower incidence of new ones in our sample. Another reason may be that the therapy for an endocrine disease ameliorates the function of other endocrine axes. This has been previously shown for BMD, metabolic syndrome, and glucose and lipid metabolism disorders after treatment for hypothyroidism and hypogonadism. 34–36 Furthermore, endocrine glands are not equally vulnerable to the iron toxicity, and patients with more endocrinopathies have already wiped out the most endangered endocrine glands.
All our patients were on regular iron-chelation therapy and had acceptable levels of iron load. Therefore, the markers of iron overload were expected to be stable over time or to have minor fluctuations. However, iron overload increased for same patients. If that phenomenon was due to scarce patient compliance and if compliance was associated with our explanatory variables, our estimates may be biased. However, also iron overload measures taken contemporaneously with disease incidence have shown no effect, as well as their deltas. A lack of compliance could have been assumed if at least the latest tests assessing iron overload were associated with higher risk.
Heightened TSH has been associated with endothelial dysfunction,37 defined as a diminished bioavailability of nitric oxide (NO) and/or an increase in vasoconstrictive factors such as endothelin (ET-1). That condition has been well documented in thalassemia patients and is associated with cardiac, hepatic and endocrine clinical complications.32,38 Endothelial dysfunction in TDT is a progressive process, starting from childhood, and recent studies found significantly higher plasma levels of asymmetric dimethylarginine (ADMA), a novel risk marker of cardiovascular disease implicated in the pathogenesis of endothelial dysfunction, in very young TDT children.39 So, increased TSH may be an early expression of systemic endothelial dysfunction in TDT which is considered an independent risk factor of future complications.32 TSH appears the best marker of systemic endocrine gland dysfunction, as its measurement is very accurate and widely used in clinical practice,40 differently from the several limits in the assessment of other pituitary hormones, as growth hormone (GH), adrenocorticotropic hormone (ACTH), LH/FSH.41 Furthermore, production of TSH is the last affected by the progressive damage of pituitary gland in TDT patients which impairs firstly GH secretion, followed by LH/FSH and ACTH.42 For all these reasons, TSH may be the sentinel for endocrine gland dysfunction. Along with TSH, age is also associated with endothelial dysfunction, which could be the main driver of endocrine and cardiovascular risk.32 These observations pave the way for the early identification of clinical complications in other metabolic diseases, which have been reported greatly affected by iron overload.24
The variation in risk of complications that our best model could explain was insufficient (25%). Therefore, there must be factors other than those we considered that have some effect on the incidence on endocrine complications. These may include NTBI, transferrin saturation, smoking, other markers of endothelial dysfunction, pancreas and pituitary R2* which weren’t considered. Furthermore, the different chelation history among the study cohort (older patients treated for longer with subcutaneous DFX compared to younger patients treated for longer with oral DFX) creates an inherent age effect to be taken into consideration.
The apparent increase in endocrine complications after the age of 12 years is certainly related to different factors, such as the current inability to recognize hypogonadism prior to puberty; the effect of hypogonadism on bone metabolism due to the impact of steroids on bone mineralization; the delay between the start of iron damage in the gland tissues and the onset of overt clinical complications, e.g., diabetes.4,11-13 Furthermore, adolescence is also marked by less physical activity and more adverse body habitus and nutrition that worsen insulin sensitivity. For all these reasons, children are not protected by iron damage in endocrine glands and conversely, they require more aggressive prophylaxis to avoid pituitary and pancreatic iron accumulation which will be clinically manifested only years later, when the functional reserve has been destroyed. Different chelation goals (such as transferrin desaturation and the use of direct endocrine imaging) and alternative chelation strategies are necessary to better protect endocrine glands.
In conclusion, although in DFX-treated TDT patients the risk of developing an endocrine complication is generally lower than the previously reported risk, there is considerable risk variation and the burden of these complications remains high. This is the first study providing a practical tool for physicians to identify patients at higher risk of developing endocrine complications. Future research will look at increasing the amount of variation explained from our model and testing further clinical and laboratory predictors, including the assessment of direct endocrine MRI.
Supplementary Material
References
- 1.Modell B, Khan M, Darlison M, Westwood MA, Ingram D, Pennell DJ. Improved survival of thalassaemia major in the UK and relation to T2* cardiovascular magnetic resonance. J Cardiovasc Magn Reson. 2008;10(1):42. [DOI] [PMC free article] [PubMed] [Google Scholar]
- 2.Rund D. Thalassemia 2016: modern medicine battles an ancient disease. Am J Hematol. 2016;91(1):15-21. [DOI] [PubMed] [Google Scholar]
- 3.Pinto VM, Poggi M, Russo R, Giusti A, Forni GL. Management of the aging beta-thalassemia transfusion-dependent population - the Italian experience. Blood Rev. 2019;38: 100594. [DOI] [PubMed] [Google Scholar]
- 4.Wood JC. Impact of iron assessment by MRI. Hematololgy Am Soc Hematol Educ Program. 2011;2011:443-450. [DOI] [PubMed] [Google Scholar]
- 5.Maffei L, Sorrentino F, Caprari P, et al. HCV infection in Thalassemia syndromes and hemoglobinopathies: new perspectives. Front Mol Biosci. 2020;7:7. [DOI] [PMC free article] [PubMed] [Google Scholar]
- 6.El Kholy M, Elsedfy H, Soliman A, Anastasi S, Raiola G, De Sanctis V. Towards an optimization of the management of endocrine complications of thalassemia. J Pediatr Endocrinol Metab. 201427(9-10):801-805. [DOI] [PubMed] [Google Scholar]
- 7.Casale M, Filosa A, Ragozzino A, et al. Long-term improvement in cardiac magnetic resonance in b-thalassemia major patients treated with deferasirox extends to patients with abnormal baseline cardiac function. Am J Hematol. 2019;94(3):312-318. [DOI] [PubMed] [Google Scholar]
- 8.Pennell DJ, Porter JB, Cappellini MD, et al. Deferasirox for up to 3 years leads to continued improvement of myocardial T2* in patients with b-thalassemia major. Haematologica 2012; 97(6):842-848. [DOI] [PMC free article] [PubMed] [Google Scholar]
- 9.Wood JC, Kang BP, Thompson A, et al. The effect of deferasirox on cardiac iron in thalassemia major: impact of total body iron stores. Blood. 2010;116(4):537-543. [DOI] [PubMed] [Google Scholar]
- 10.Deugnier Y, Turlin B, Ropert M, et al. Improvement in liver pathology of patients with b-thalassemia treated with deferasirox for at least 3 years. Gastroenterology. 2011;141(4):1202-1211. [DOI] [PubMed] [Google Scholar]
- 11.Noetzli LJ, Papudesi J, Coates TD, Wood JC. Pancreatic iron loading predicts cardiac iron loading in thalassemia major. Blood. 2009;114(19):4021-4026. [DOI] [PMC free article] [PubMed] [Google Scholar]
- 12.Noetzli LJ, Panigrahy A, Mittelman SD, et al. Pituitary iron and volume predict hypogonadism in transfusional iron overload. Am J Hematol. 2012;87(2):167-171. [DOI] [PubMed] [Google Scholar]
- 13.Noetzli LJ, Mittelman SD, Watanabe RM, Coates TD, Wood JC. Pancreatic iron and glucose dysregulation in thalassemia major. Am J Hematol. 2012;87(2):155-160. [DOI] [PubMed] [Google Scholar]
- 14.Belhoul KM, Bakir ML, Saned M-S, Kadhim AM, Musallam KM, Taher AT. Serum ferritin levels and endocrinopathy in medically treated patients with b thalassemia major. Ann Hematol. 2012;91(7):1107-1114. [DOI] [PubMed] [Google Scholar]
- 15.Casale M, Citarella S, Filosa A, et al. Endocrine function and bone disease during long-term chelation therapy with deferasirox in patients with b-thalassemia major. Am J Hematol. 2014. 89(12):1102-1106. [DOI] [PubMed] [Google Scholar]
- 16.Poggi M, Sorrentino F, Pugliese P, et al. Longitudinal changes of endocrine and bone disease in adults with b-thalassemia major receiving different iron chelators over 5 years. Ann Hematol. 2016;95(5):757-763. [DOI] [PubMed] [Google Scholar]
- 17.Thuret I, Pondarré C, Loundou A, et al. Complications and treatment of patients with b-thalassemia in France: results of the National Registry. Haematologica. 2010;95(5):724-729. [DOI] [PMC free article] [PubMed] [Google Scholar]
- 18.Cappellini MD, Cohen A, Porter J, Taher A, Viprakasit V, editors. Guidelines for the management of transfusion dependent Thalassaemia (TDT), 3rd edn. Nicosia (CY): Thalassaemia International Federation, 2014. http://www.ncbi.nlm.nih.gov/books/NBK269382/ (accessed August 15, 2020). [PubMed] [Google Scholar]
- 19.Royston P. Explained variation for survival models. Stata J. 2006;6(1):83-96. [Google Scholar]
- 20.Wood JC. Use of magnetic resonance imaging to monitor iron overload. Hematol Oncol Clin North Am. 2014;28(4):747-764. [DOI] [PMC free article] [PubMed] [Google Scholar]
- 21.Au W-Y, Lam WW-M, Chu WWC, et al. A cross-sectional magnetic resonance imaging assessment of organ specific hemosiderosis in 180 thalassemia major patients in Hong Kong. Haematologica. 2008;93(5):784-786. [DOI] [PubMed] [Google Scholar]
- 22.Ang AL, Tzoulis P, Prescott E, Davis BA, Barnard M, Shah FT. History of myocardial iron loading is a strong risk factor for diabetes mellitus and hypogonadism in adults with b thalassemia major. Eur J Haematol. 2014;92(3):229-236. [DOI] [PubMed] [Google Scholar]
- 23.Pinto VM, Bacigalupo L, Gianesin B, et al. Lack of correlation between heart, liver and pancreas MRI-R2*: results from long-term follow-up in a cohort of adult b-thalassemia major patients. Am J Hematol. 2018;93(3): E79-82. [DOI] [PubMed] [Google Scholar]
- 24.Fernández-Real JM, Manco M. Effects of iron overload on chronic metabolic diseases. Lancet Diabetes Endocrinol. 2014;2(6):513-526. [DOI] [PubMed] [Google Scholar]
- 25.Oudit GY, Trivieri MG, Khaper N, Liu PP, Backx PH. Role of L-type Ca2+ channels in iron transport and iron-overload cardiomyopathy. J Mol Med. 2006;84(5):349-364. [DOI] [PMC free article] [PubMed] [Google Scholar]
- 26.Cabantchik ZI. Labile iron in cells and body fluids: physiology, pathology, and pharmacology. Front Pharmacol. 2014;5:45. [DOI] [PMC free article] [PubMed] [Google Scholar]
- 27.Noetzli LJ, Carson SM, Nord AS, Coates TD, Wood JC. Longitudinal analysis of heart and liver iron in thalassemia major. Blood. 2008;112(7):2973-2978. [DOI] [PMC free article] [PubMed] [Google Scholar]
- 28.Piga A, Longo F, Duca L, et al. High nontransferrin bound iron levels and heart disease in thalassemia major. Am J Hematol. 2009;84(1):29-33. [DOI] [PubMed] [Google Scholar]
- 29.Wood JC, Glynos T, Thompson A, et al. Relationship between labile plasma iron, liver iron concentration and cardiac response in a deferasirox monotherapy trial. Haematologica 2011;96(7):1055-1058. [DOI] [PMC free article] [PubMed] [Google Scholar]
- 30.Cunningham MJ, Macklin EA, Neufeld EJ, Cohen AR, Thalassemia Clinical Research Network. complications of beta-thalassemia major in North America. Blood. 2004;104(1):34-39. [DOI] [PubMed] [Google Scholar]
- 31.Vogiatzi MG, Macklin EA, Trachtenberg FL, et al. Differences in the prevalence of growth, endocrine and vitamin D abnormalities among the various thalassaemia syndromes in North America. Br J Haematol. 2009;146(5):546-556. [DOI] [PMC free article] [PubMed] [Google Scholar]
- 32.Taher AT, Cappellini MD, Bou-Fakhredin R, Coriu D, Musallam KM. Hypercoagulability and vascular disease. Hematol Oncol Clin North Am. 2018;32(2):237-245. [DOI] [PubMed] [Google Scholar]
- 33.Pennell DJ, Udelson JE, Arai AE, et al. Cardiovascular function and treatment in bthalassemia major: a consensus statement from the American Heart Association. Circulation. 2013;128(13):281-308. [DOI] [PubMed] [Google Scholar]
- 34.Salzano A, Marra AM, Arcopinto M, et al. Combined effects of growth hormone and testosterone replacement treatment in heart failure. ESC Heart Fail. 2019;6(6):1216-1221. [DOI] [PMC free article] [PubMed] [Google Scholar]
- 35.Rochira V. Late-onset hypogonadism: bone health. Andrology. 2020;8(6):1539-1550. [DOI] [PubMed] [Google Scholar]
- 36.Feingold KR, Anawalt B, Boyce A, et al., editors. Endotext. South Dartmouth (MA): MDText.com, Inc., 2000. http://www.ncbi.nlm.nih.gov/books/NBK278943/ (accessed August 15, 2020). [Google Scholar]
- 37.Niknam N, Khalili N, Khosravi E, Nourbakhsh M. Endothelial dysfunction in patients with subclinical hypothyroidism and the effects of treatment with levothyroxine. Adv Biomed Res. 2016;5:38. [DOI] [PMC free article] [PubMed] [Google Scholar]
- 38.Aggeli C, Antoniades C, Cosma C, et al. Endothelial dysfunction and inflammatory process in transfusion-dependent patients with beta-thalassemia major. Int J Cardiol. 2005;105(1):80-84. [DOI] [PubMed] [Google Scholar]
- 39.Gursel O, Tapan S, Sertoglu E, et al. Elevated plasma asymmetric dimethylarginine levels in children with beta-thalassemia major may be an early marker for endothelial dysfunction. Hematology. 2018;23(5):304-308. [DOI] [PubMed] [Google Scholar]
- 40.Clerico A, Trenti T, Aloe R, et al. A multicenter study for the evaluation of the reference interval for TSH in Italy (ELAS TSH Italian Study). Clin Chem Lab Med. 2018;57(2): 259-267. [DOI] [PubMed] [Google Scholar]
- 41.Bidlingmaier M, Strasburger CJ. Growth hormone assays: current methodologies and their limitations. Pituitary. 2007;10(2):115-119. [DOI] [PubMed] [Google Scholar]
- 42.Jameson JL, De Groot LJ. Endocrinology-EBook: Adult and Pediatric. Elsevier Health Sciences, 2010. [Google Scholar]
Associated Data
This section collects any data citations, data availability statements, or supplementary materials included in this article.


