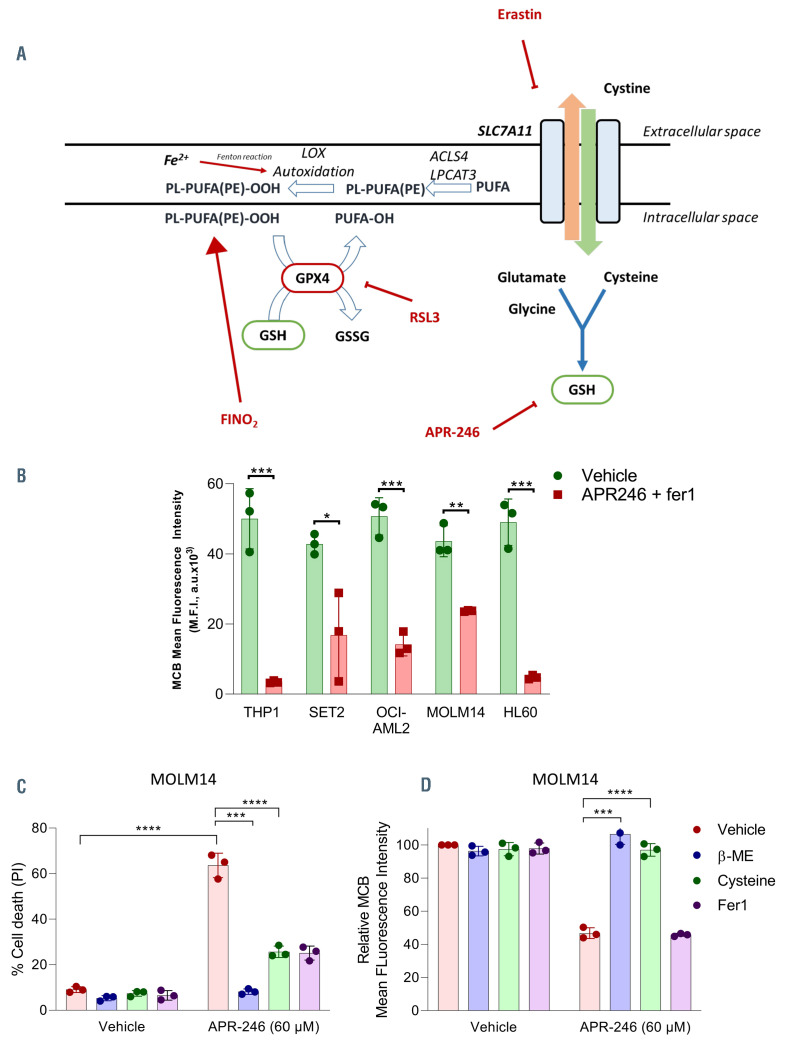
Figure 4.
APR-246 induces glutathione depletion in acute myeloid leukemia cells. (A) Summary of the cellular pathways involved in ferroptosis. Ferroptosis execution is triggered by an iron-catalyzed excessive peroxidation of polyunsaturated fatty acids (PUFA)-containing phospholipids (PL-PUFA). Glutathione (GSH) and glutathione peroxidase 4 (GPX4) are the two key elements controlling the elimination of lipid peroxides. Solute carrier family 7 member 11 (SLC7A11) encodes the transporter subunit of the heterodimeric cystine-glutamate antiporter named system xc-. System xc- mediates cystine entry into the cell in exchange for glutamate.26 Once inside the cell, cystine is rapidly reduced to cysteine which is the limiting amino acid for GSH synthesis. SLC7A11 inhibition results in cellular cysteine depletion, which leads to the exhaustion of intracellular pool of GSH. GPX4 is a pleiotropic selenoprotein that uses GSH to selectively reduce lipid hydroperoxides to lipid alcohols, in order to protect the cells against membrane lipid peroxidation.29 GPX4 inhibition is either due to its direct inhibition or downregulation, or to GSH depletion via direct or indirect processes. The inhibition of GPX4 results in uncontrolled polyunsaturated fatty acid phospholipid (PL-PUFA) oxidation and fatty acid radical generation, leading to ferroptotic cell death. ACSL4: acyl-CoA synthetase long chain family member 4; LPCAT 3: lysophosphatidylcholine acyltransferase 3; ALOX: arachidonate lipoxygenase; PUFA: polyunsaturated fatty acid; PL: phospholipids; PE: phosphatidylethanolamine; GPX4: glutathione peroxidase 4. (B) GSH (mBCI) measurement in acute myeloid leukemia (AML) cell lines by flow cytometry (FCM) at 14 hours (h) post APR-246 and fer1 (10 mM) treatment. APR-246 was used at 100 mM for MOLM-14 and 50 mM for other AML cell lines. Fer1 was associated to prevent cell death and allowed analysis of GSH depletion. Left panels show representative FCM quantification. n=3. Error bars + standard deviation. Statistics by t-test. *P<0.05, **P<0.01, ***P<0.0001. (C and D) Cell death (%) (C) and GSH (mBCI) measurement (D) for MOLM-14 at 24 h post-APR-246 treatment (60 mM) with or without B-ME (50 mM), cysteine (50 mM) or Fer1 (10 mM). Error bars + standard deviation. Statistics by t-test; *P<0.05, **P<0.01, ***P<0.0001.

