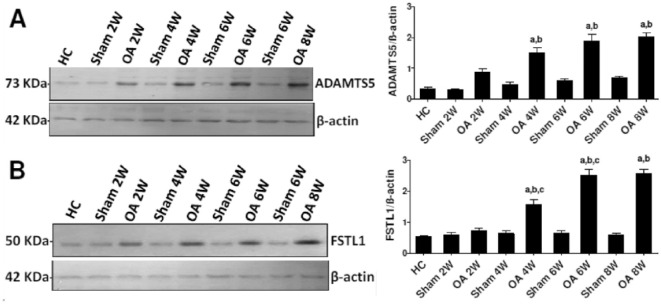
Figure 5.
Representative western blot analyses of ADAMTS5 (A) and FSTL1 (B) levels in cartilage tissue homogenates from different groups. β-Actin was used in parallel as the internal control. The panels on the right represent the corresponding quantification of each analysis as measured by ImageJ software and expressed as the relative band density to that of β-actin. The level of significance was accepted as P < 0.05, and all relevant results are graphically displayed as the mean ± SEM. The lowercase letters a, b, and c indicate significant differences between the OA group and the healthy control group, the corresponding sham group, and the previous OA stage, respectively.

