

Abstract
Introduction
Practice effects (PEs) on cognitive tests obscure decline, thereby delaying detection of mild cognitive impairment (MCI). Importantly, PEs may be present even when there are performance declines, if scores would have been even lower without prior test exposure. We assessed how accounting for PEs using a replacement‐participants method impacts incident MCI diagnosis.
Methods
Of 889 baseline cognitively normal (CN) Alzheimer's Disease Neuroimaging Initiative (ADNI) participants, 722 returned 1 year later (mean age = 74.9 ± 6.8 at baseline). The scores of test‐naïve demographically matched “replacement” participants who took tests for the first time were compared to returnee scores at follow‐up. PEs—calculated as the difference between returnee follow‐up scores and replacement participants scores—were subtracted from follow‐up scores of returnees. PE‐adjusted cognitive scores were then used to determine if individuals were below the impairment threshold for MCI. Cerebrospinal fluid amyloid beta, phosphorylated tau, and total tau were used for criterion validation. In addition, based on screening and recruitment numbers from a clinical trial of amyloid‐positive individuals, we estimated the effect of earlier detection of MCI by accounting for cognitive PEs on a hypothetical clinical trial in which the key outcome was progression to MCI.
Results
In the ADNI sample, PE‐adjusted scores increased MCI incidence by 19% (P < .001), increased proportion of amyloid‐positive MCI cases (+12%), and reduced proportion of amyloid‐positive CNs (–5%; P’s < .04). Additional calculations showed that the earlier detection and increased MCI incidence would also substantially reduce necessary sample size and study duration for a clinical trial of progression to MCI. Cost savings were estimated at ≈$5.41 million.
Discussion
Detecting MCI as early as possible is of obvious importance. Accounting for cognitive PEs with the replacement‐participants method leads to earlier detection of MCI, improved diagnostic accuracy, and can lead to multi‐million‐dollar cost reductions for clinical trials.
Keywords: Alzheimer's disease, clinical trials, early diagnosis, longitudinal aging, mild cognitive impairment, practice effects
1. INTRODUCTION
Alzheimer's disease (AD) is a leading cause of death in adults over age 65 and an estimated 1 in 85 people will be living with the disease by 2050. 1 , 2 Given the protracted AD prodromal period, emphasis is now on clinical trials that begin with cognitively normal (CN) individuals who may progress to mild cognitive impairment (MCI). 3 , 4 , 5 , 6 Delayed detection of MCI is essentially misdiagnosis, that is, labeling someone as CN when they, in fact, have MCI. Such misdiagnosis impedes identification of meaningful drug effects and may lead to misinterpretation of findings in clinical trials. 7 , 8 Clinically, any effects to slow disease progression require early detection. Detection of MCI as early as possible is thus critical.
Repeat cognitive assessments are necessary for accurately determining transitions from CN to MCI or MCI to dementia. However, repeat assessments are subject to practice effects (PEs) that can inflate follow‐up scores via memory of specific stimuli (i.e., content PE) or through increased comfort with test taking (i.e., context PE). 9 , 10 Put simply, someone taking a test for the second time will typically have a higher score than if they were taking it for the first time. PEs have a wide‐ranging impact on any study or field involving cognitive testing because they mask true cognitive decline and compromise diagnostic accuracy, impairing the separation of cases (i.e., MCI) and controls (i.e., CN). 11 , 12 Moreover, PEs are pervasive; they have been found across multiple cognitive domains and test–retest intervals as long as 7 years in older adults, including those with MCI and mild AD. 9 , 12 , 13 , 14
A major limitation of most PE methods is that they only consider PEs when scores are higher at follow‐up than at baseline. 11 , 14 , 15 However, PEs can exist when there is no overall change and when there is decline, as they may still cause underestimation of decline (Figure 1). 11 , 14 In such situations, failure to account for PEs may delay MCI diagnosis because PEs would inflate scores above diagnostic impairment thresholds. 11 , 12 , 16 , 17 This is particularly relevant for older adults for whom decline over time may be the norm.
FIGURE 1.
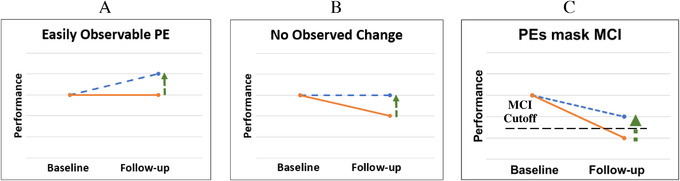
Practice effects (PEs) with and without true decline. The solid line represents true cognitive ability. The dashed line represents observed performance, which is inflated due to a practice effect (vertical arrow). A, Typically observed practice effect: an individual's observed score increases from baseline to follow‐up, demonstrating a typical practice effect. B, Practice effect in the context of cognitive decline. In this scenario, an individual's ability is decreasing over time. A practice effect still exists but is masked by cognitive decline. As a result, the individual's performance appears to be stable but is actually better than it would have been without previous exposure to the test. C, PEs impair detection of mild cognitive impairment (MCI). In this situation, an individual has declined below an MCI cutoff. However, PEs are inflating their score so that they now fall above the MCI cutoff and will be diagnosed as cognitively normal at follow‐up
Despite their importance, PEs are largely ignored in longitudinal studies, clinical trials, and clinical practice, particularly with respect to diagnosis. 10 , 11 , 14 , 18 , 19 A review of PEs in MCI and AD samples noted considerable evidence of PEs (i.e., increased scores) in clinical trials. 14 However, despite recognition that accounting for PEs may potentially improve clinical trials and diagnostic accuracy, there are minimal empirical data on PEs in clinical trials. 11 , 14 , 15 , 20
RESEARCH IN CONTEXT
Systematic Review: We reviewed the literature (e.g., PubMed) and found only one study (by our group) that used practice effects (PEs) for purposes of earlier detection of mild cognitive impairment (MCI). However, the validity or accuracy of the practice‐adjusted diagnoses and their potential impact on clinical trials remains unknown.
Interpretation: Our novel application of the replacement‐participant method of practice effect estimation resulted in a 21% increase in incident MCI at 1‐year follow‐up. This earlier detection was also more accurate: 20% increase in amyloid‐positive MCI cases and 6% decrease in amyloid‐positive controls. We then showed that accounting for PEs would substantially increase power and reduce necessary sample size, duration, and cost of AD drug trials.
Future Directions: Matched replacement participants should be included in the design of large longitudinal aging studies and AD clinical drug trials to gauge PEs and provide for earlier detection of progression to impairment.
One method of PE adjustment, the replacement‐participant method, is able to gauge PEs even when performance declines. 12 , 16 This method relies on the recruitment of an additional set of test‐naïve participants (i.e., “replacements”) that is similar to returnees in terms of age and other demographic factors. A comparison of replacements’ performance and that of the returnees calculates a PE because score differences are due to the fact that returnees have taken the tests twice, but replacements have taken the tests only once. PE‐adjusted scores can then be derived by subtracting PEs from the returnees’ follow‐up scores. 12 , 16 Using a replacement‐participants method, in what to our knowledge is the only study using PE adjustment to modify diagnosis, we showed that MCI incidence doubled (4.6% vs. 9.0%) when scores were adjusted for PEs in a 6‐year follow‐up study. 12 The increased incidence means earlier detection of MCI, suggesting an important strength of this method. However, as this method lowers all scores, it is crucial to determine if the increased incidence truly represents more accurate diagnosis rather than methodological artifact. We propose improved correspondence between AD biomarkers and MCI diagnoses as a way of validating the PE‐adjusted diagnoses. Other strengths of the method are that returnees and replacements are always well‐matched for demographics, and PEs are always calculated based on the specific time interval and for a specific test. A shortcoming of this method is that each test's PE is the same for all subjects because they are group mean effects.
Here, we used a novel approach by identifying the equivalent of replacement participants in the Alzheimer's Disease Neuroimaging Initiative (ADNI). In individuals who were CN at baseline, we hypothesized that: (1) we would observe PEs at the 12‐month follow‐up; and (2) accounting for PEs would increase the number of MCI diagnoses at follow‐up. Regarding criterion validity, we hypothesized that: (3) PE‐adjusted diagnoses would result in more AD biomarker‐positive MCI cases and fewer biomarker‐positive CN individuals than PE‐unadjusted diagnoses. Finally, we completed power/sample size calculations, hypothesizing that: (4) accounting for PEs would substantially reduce the number of participants needed for clinical trials. We then applied these estimates to a hypothetical drug trial with progression to MCI as a key outcome using recruitment data from a major clinical trial. Earlier and more accurate detection should thus have a substantial impact on clinical trials by reducing study duration, attrition, participant and staff burden, and overall cost.
2. MATERIALS AND METHODS
2.1. Participants
Data were obtained from the ADNI database (adni.loni.usc.edu). The ADNI was launched in 2003 as a public–private partnership, led by Principal Investigator Michael W. Weiner, MD. The primary goal of ADNI has been to test whether biological markers, clinical assessment, and neuropsychological measures can be combined to measure the progression of MCI and early AD. For up‐to‐date information, see www.adni‐info.org. Participants from the ADNI‐1, ADNI‐GO, and ADNI‐2 cohorts were included. Informed consent was obtained from all participants.
We identified 889 individuals who were CN at baseline; 722 of them returned for a 12‐month follow‐up. Mean educational level of returnees was 16 years (standard deviation [SD] = 2.7), 47% were female, and mean baseline age was 74.9 years (SD = 6.8). All participants completed neuropsychological testing at baseline and 12‐month follow‐up. After accounting for PEs, we re‐diagnosed returnees at their 12‐month follow‐up as CN or MCI.
2.2. Procedures
Six cognitive tests were examined at both baseline and follow‐up (mean = 12.21 months; SD = 0.97): memory (Wechsler Memory Scaled‐Revised, Logical Memory Story A delayed recall; Rey Auditory Verbal Learning Test [AVLT] delayed recall); language (Boston Naming Test; Animal Fluency); attention‐executive function (Trail Making Test Parts A and B). The American National Adult Reading Test provided an estimate of premorbid IQ. Participants completed the same version of tests at baseline and 12‐month visits.
PE‐adjusted and PE‐unadjusted scores were converted to z‐scores based on external norms that accounted for age, sex, and education for all tests except the AVLT. 21 Having found no external norms for the AVLT that were appropriate for this sample and accounted for age, sex, and education, the AVLT was z‐scored based on ADNI participants who were CN at baseline (n = 889). AVLT demographic corrections were based on a regression model that followed the same approach as the other normative adjustments. 21
We focused primarily on MCI diagnosed according to the Jak‐Bondi approach, requiring scores on ≥2 tests within the same cognitive domain to be >1 SD below normative means. 7 , 8 , 22 To test whether the results were specific to a particular diagnostic approach, we repeated analyses using Petersen MCI criteria. 22
Biomarkers included cerebrospinal fluid amyloid beta (Aβ), phosphorylated tau (p‐tau), and total tau (t‐tau) collected at baseline. The ADNI biomarker core (University of Pennsylvania) used the fully automated Elecsys immunoassay (Roche Diagnostics). Sample collection and processing have been described previously. 23 Cutoffs for biomarker positivity were: Aβ+: Aβ <977 pg/mL; p‐tau+: p‐tau >21.8 pg/mL; t‐tau+: t‐tau >270 pg/mL (http://adni.loni.usc.edu/methods). 24 , 25 There were 521 returnees with Aβ, 518 with p‐tau, and 519 with t‐tau data.
2.3. Practice effect calculation and statistical analysis
PEs were calculated using a modified version of a replacement‐participants method. 12 Reviews and meta‐analysis have noted that almost all studies of PEs considered only observed performance increases (Figure 1A), and recommended replacement‐participant methods in situations in which decline is expected. 11 , 14 , 16 In some situations PEs will not necessarily manifest as improvements for middle‐aged and older adults, particularly for individuals on an AD trajectory. 26 The replacement‐participants approach involves recruiting participants for testing at follow‐up who are demographically matched to returnees. The only difference between groups is that replacements are taking the tests for the first time whereas returnees are retaking the tests. Comparing scores at follow‐up between returnees and replacement participants (with additional adjustment for attrition effects) allows for detection of PEs when observed scores remain stable (Figure 1B) and even when they decline (Figure 1C). In both scenarios, scores would have been lower without prior exposure. Thus, the goal is to create follow‐up scores over retest intervals that are free of PEs and comparable to general normative data. By design, this method is equally applicable for any sample and any test because returnees and replacements are always matched on demographic characteristics, test, and retest interval.
Because ADNI did not have replacements, we used individuals who at baseline were demographically matched to returnees at follow‐up. We refer to them as pseudo‐replacements. Bootstrapping (5000 resamples, with replacement) was used to calculate PE values for each cognitive test. Figure 2 demonstrates how participants were matched at each iteration of the bootstrap. Propensity scores (R package: MatchIt) calculated via one‐to‐one matching were used to identity pseudo‐replacements that were similar to returnees, and an additional constraint confirmed that the returnees and pseudo‐replacements were matched at a group level (P’s > .8). 27 PEs were calculated by comparing the mean scores of these subsamples at each bootstrapping iteration using equations displayed in Figure 2. The difference score represents the sum of the practice effect and the attrition effect. With actual replacements, the attrition effect accounts for the fact that returnees are often higher‐performing or healthier than those who drop out. However, because the pseudo‐replacements are similar to returnees, their removal from the baseline sample lowers the mean baseline score among those not chosen to be returnees at that iteration, resulting in an artificially high attrition effect. To ensure a more accurate attrition effect, we calculated the true attrition and retention rates for each test (≈16% and 84%, respectively). We then multiplied the mean score of returnees at baseline by the retention rate and the mean score of the remaining baseline participants (i.e., those not chosen as returnees or pseudo‐replacements) by the attrition rate. The sum of these values provides a weighted mean for each iteration, which we refer to as the proportional baseline. Finally, the PE for each test equals the difference score minus the attrition effect. 12 , 17 The PE for each test was then subtracted from each individual's observed (unadjusted) follow‐up test score to provide PE‐adjusted raw scores.
FIGURE 2.
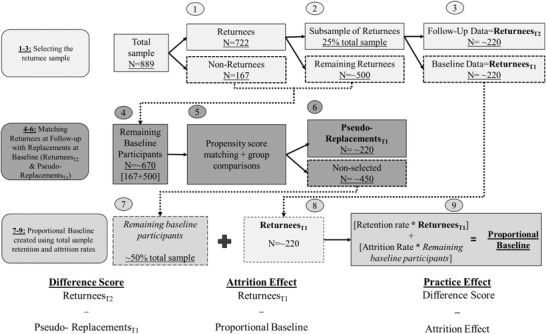
Sample matching and practice effect calculations. Practice effect calculations are based on bootstrapped analyses. Participants with valid baseline data were identified (n = 889). (1) Participants who also had 12‐month follow‐up data comprised the returnees (n = 722). (2) A subsample (n = 25% total sample) of returnees was selected; this was ≈220 participants. (3) Baseline data for these participants were labeled as ReturneesT1. Follow‐up data for these participants were labeled ReturneesT2. (4) The 220 ReturneesT1 participants were removed from the pool of baseline data, leaving ≈670 remaining baseline participants. (5) Using propensity score matching with an additional age restriction (<0.1 years), the potential pseudo‐replacements were matched to the ReturneesT2 participants using one‐to‐one matching. The pseudo‐replacements were drawn from the 670 remaining baseline participant pool. Matching parameters were age, birth sex, education, and premorbid IQ. Additionally, comparisons of age, birth sex, education, and premorbid IQ were completed to confirm groups were similar (p’s > .80). (6) Once matching was complete, the sample was labeled Pseudo‐ReplacmentsT1, and this sample ranged in size from 200 to 240 participants. Thus, the Pseudo‐ReplacmenstsT1 sample and the ReturneesT2 sample were demographically matched and only differed in that the ReturneesT2 had taken the test before while Pseudo‐ReplacmeentsT1 had taken the tests only once. After the—on average—220 Pseudo‐ReplacmentsT1 were removed from the pool of baseline data, there were 450 remaining unchosen baseline participants, or 50% of the total sample. The previous steps were completed at each of the 5000 iterations. Practice effects were calculated by comparing the mean scores of these subsamples using the equations provided below the flowchart. The difference between the mean of ReturneesT2 scores and the mean of the matched Pseudo‐ReplacementsT1 scores equates to the sum of practice effect and attrition effect. The attrition effect accounts for the fact that individuals who return for follow‐up may be higher performing or healthier than the full baseline sample. (7–9) To retain the proportion of returnees to attritors we had in the original sample, we then created a weighted mean of the baseline data cognitive score by multiplying the mean test score of the remaining baseline subject pool by the attrition rate (≈ 16%) and the ReturneesT1 pool by the retention rate (84%); this is referred to as the Proportional Baseline in the text. The practice effect for each test equals the difference score minus the attrition effect.
In summary, this method identifies a comparison sample (pseudo‐replacements) who are matched for age and other demographic characteristics to the returnees. The only difference is that returnees have taken the test before and pseudo‐replacements have not. Because this analysis uses completed data, creating pseudo‐replacements allowed for application of a replacement method of PE adjustment to an already completed study without requiring new participant recruitment.
Adjusted raw scores at follow‐up were converted to z‐scores, which were used to determine PE‐adjusted diagnoses. In other words, determination of whether an individual was below the impairment threshold was now based on the PE‐adjusted scores. McNemar χ2 tests were used to compare differences in the proportion of individuals classified as having MCI before versus after adjusting for PEs, and to determine if PE‐adjusted diagnoses changed the proportions of biomarker‐positive MCI and CN participants. Cohen's d was calculated for each PE by comparing unadjusted and adjusted scores.
To determine the impact of PE adjustment in a clinical trial, we calculated sample size requirements for a hypothetical clinical trial aimed at reducing progression to MCI at 1‐year follow‐up in amyloid‐positive CN individuals using MCI incidence rates from the present study. We performed logistic regressions with drug/placebo as the predictor and diagnosis at follow‐up as the outcome. Sample size estimates were determined across a range of drug effects (10% to 40% reduction in MCI diagnoses) with α = 0.05 and power = 0.80. We then used this information to estimate the effects on required sample size and cost for a variant of the Anti‐Amyloid Treatment in Asymptomatic Alzheimer's Disease (A4) study given α = 0.05, and power = 0.80. The A4 study recruited amyloid‐positive CN individuals to investigate whether anti‐amyloid therapy can delay cognitive decline. 6 Progression to disease is a common and meaningful outcome for clinical trials. For our hypothetical variation of the A4 study, the outcome of interest was progression to MCI at 1 year rather than just comparing cognitive decline. These analyses were completed within the powerMediation package in R v3.6.1. 28 , 29
3. RESULTS
PE magnitudes varied within and between cognitive domains (Table 1). PE‐adjusted scores resulted in 124 (17%) converters to MCI; unadjusted scores resulted in 104 (14%) converters (Table 2A). Thus, there were 19% (P < .001) more individuals diagnosed with MCI after one year using PE‐adjusted scores (Table 2A). Table 2B shows that adjusting for PEs significantly increased the number of biomarker‐positive participants who progressed to MCI (+13% to +15%) and decreased the number of biomarker‐positive participants who remained CN (–5%). In particular, there was a 12% increase in amyloid‐positive MCI cases and a 5% decrease in amyloid‐positive CNs. Tables S1‐S2 in supporting information show results for diagnoses based on Petersen criteria. The pattern is the same as for the Jak‐Bondi criteria, and all significant differences remained significant regardless of diagnostic approach.
TABLE 1.
Means, standard deviations, attrition effects, and practice effects for each cognitive test
| Memory | Attention/executive function | Language | ||||
|---|---|---|---|---|---|---|
| Raw mean score (SD) | RAVLT | Logical memory | Trails A | Trails B | Boston Naming | Category fluency |
| Proportional baseline | 7.18 (3.81) | 10.64 (4.24) | 31.89 (10.79) | 77.47 (39.86) | 29.04 (2.42) | 19.67 (5.23) |
| Returnees baseline | 7.18 (3.79) | 10.54 (4.23) | 31.97 (10.82) | 76.89 (38.41) | 29.05 (2.36) | 19.71 (5.26) |
| Returnees follow‐up | 6.97 (4.38) | 11.66 (4.63) | 31.52 (12.52) | 75.24 (43.14) | 29.43 (2.27) | 19.84 (5.22) |
| Replacements follow‐up | 6.97 (3.79) | 10.60 (4.34) | 32.47 (10.83) | 79.38 (41.69) | 28.99 (2.45) | 19.46 (5.19) |
| Attrition effect | 0 | –0.09 | –0.02 | –0.59 | 0.01 | 0.03 |
| Practice effect | NA | 1.15 | –0.93 | –3.56 | 0.43 | 0.35 |
| Cohen's d | NA | .24 | –0.07 | –0.08 | 0.19 | 0.07 |
Abbreviations: PE, practice effect; RAVLT, Rey Auditory Verbal Learning Test; SD, standard deviation; Trails, Trail Making Test.
Notes: Groups are based on the average performance across all 5000 bootstrapped iterations. Means are based on transformed data that was reverted back to raw units. “Proportional baseline” refers to a weighted mean that combines the returnee baseline group and a group that included all subjects not selected to be returnees or replacements in that bootstrapped iteration. “Returnee baseline” refers to baseline test scores for the portion of participants who returned for the 12‐month follow‐up visit (n = 722). “Returnee follow‐up” refers to 12‐month scores for the portion of participants who returned for the 12‐month follow‐up (n = 722). “Replacement follow‐up” refers to the pseudo‐replacement scores. The scores for memory tasks indicate the number of words remembered at the delayed recall trials. Scores on the attention/executive functioning tests indicate time to completion of task. On these tasks, higher scores indicate worse performance. Scores on the Boston Naming Test task indicate number of correct items identified; scores on category fluency indicate number of items correctly stated. Practice effects and attrition effects are in raw units. As such, the negative practice effects and attrition effects for the Trails tasks demonstrate that practice decreased time (increased performance). Cohen's d is given for the difference between PE‐adjusted and unadjusted scores of returnees at follow‐up.
TABLE 2.
Impact of practice effects
| A progression from cognitively normal to MCI | ||||
|---|---|---|---|---|
| # of cases, based on PE‐unadjusted cognitive scores | # of cases, based on PE‐adjusted cognitive scores | Difference in # of cases (%) | χ2; P | |
| MCI diagnosis | 104 | 124 | +20 (+19%) | 18.1; < .001 |
| Memory domain impaired | 74 | 87 | +13 (+18%) | 11.1; < .001 |
| Attention/executive domain impaired | 21 | 25 | +4 (+19%) | 2.3; .13 |
| Language domain impaired | 11 | 14 | +3 (+27%) | 1.3; .25 |
| Impaired on 1 test within all domains | 11 | 13 | +2 (+18%) | 0.17; .68 |
| B. Concordance of MCI diagnosis and biomarker‐positivity | ||||
|---|---|---|---|---|
| Converters to MCI | # of returnees who are biomarker‐positive and MCI (PE‐unadjusted) | # of returnees who are biomarker‐positive and MCI (PE‐adjusted) | Difference in # of cases (%) | P |
| Aβ+ | 51 | 58 | +7 (+14%) | .02 |
| p‐tau+ | 54 | 62 | +8 (+15%) | .01 |
| t‐tau+ | 47 | 53 | +6 (+13%) | .04 |
| Stable CN | # of returnees who are biomarker‐positive and CN (PE‐unadjusted) | # of returnees who are biomarker‐positive and CN (PE‐adjusted) | Difference in # of cases (%) | P |
| Aβ+ | 152 | 145 | ‐7 (‐5%) | .02 |
| p‐tau+ | 170 | 162 | ‐8 (‐5%) | .01 |
| t‐tau+ | 118 | 112 | ‐6 (‐5%) | .04 |
Abbreviations: Aβ, amyloid beta; CN, cognitively normal; MCI, mild cognitive impairment; PE, practice effects; p‐tau, phosphorylated tau; t‐tau, total tau.
Notes: Follow‐up diagnoses were made with practice effect‐unadjusted (PE‐unadjusted) or practice effect‐adjusted (PE‐adjusted) scores. The difference in the number of cases is calculated by subtracting the number of cases, based on PE‐unadjusted scores, from the number of cases based on PE‐adjusted scores. The percent difference (%) in number of cases is the differences in number of cases divided by the number of cases based on PE‐unadjusted cognitive scores (eg., 19% = 20/104). χ2 is McNemar χ2. Individuals could be impaired in more than one domain. Consequently, the sum of impaired individuals within each domain is greater than the total number of MCI cases. The MCI diagnosis row counts an individual only once, even if they are impaired in more than one domain.
Next, we showed that the number of participants necessary to determine a significant drug effect was substantially reduced by accounting for PEs across all effect sizes (Figure 3). On average, adjusting for PEs reduced the number of participants required by 15.9% (321 participants) across effect sizes (range = 68 to 1377 participants). The inset within Figure 3 focuses on differences for hypothetical PE‐adjusted and unadjusted samples of ≈1000.
FIGURE 3.
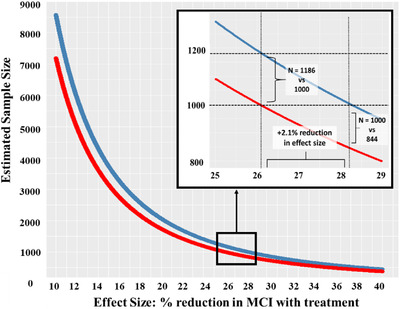
Effect of practice effect‐adjusted versus unadjusted scores on a hypothetical clinical trial of biomarker‐positive participants. Comparison of estimated sample sizes (Y‐axis) necessary for detecting a significant drug effect (X‐axis) in a sample that is biomarker‐negative and cognitively normal (CN) at baseline. The drug effect is operationalized as percent reduction in mild cognitive impairment (MCI) diagnoses at a 1‐year follow‐up between the treatment group and the placebo group. For example, a drug effect of 30% means that 30% more participants remained CN when treated with the drug than when given the placebo. The red line represents a trial that uses MCI incidence rates based on practice effect (PE)‐adjusted diagnoses and the blue line represents a trial that uses incidence rates based on unadjusted diagnoses. MCI incidence rates were based on the subsample of participants from the present study who were biomarker‐negative and CN at baseline. The model examined was a logistic regression with diagnosis at follow‐up (MCI vs. CN) as the outcome variable. The predictor was a two‐level categorical variable representing placebo or drug. Alpha was set at 0.05, power was 0.80, and the hypothetical sample was evenly split into treatment and placebo groups. Across all effect sizes (10% to 40% reduction in treatment vs. placebo conversation rates) the PE‐adjusted trial required fewer participants than the PE‐unadjusted trial. The inset shows results for hypothetical samples with ≈1000 participants. If this study used PE‐unadjusted outcome measures (blue line), it would require an effect size of 28.2% to reach a significant result with ≈1000 participants. Using PE‐adjusted diagnoses, only 844 participants would be required for the same study with the same drug effect, a reduction of 156 participants. A PE‐adjusted study with ≈1000 participants (red line in the inset) would be able to detect a smaller drug effect of 26.1%. With this 2.1% reduction in effect size, a PE‐unadjusted study would require an additional 186 participants at this drug effect level (1186 vs. 1000)
We then applied our findings to recruitment data from the A4 study (Figure 4A). 30 Obtaining the CN, amyloid‐positive A4 sample of 1323 required the recruitment of 5.11 times as many people for initial screening (n = 6763) and 3.39 times as many people to undergo amyloid positron emission tomography (PET) imaging (4486). 30 Our calculations showed that this sample size of 1323 would be powered to detect a 24.7% drug effect on incident MCI outcomes, but accounting for PEs would yield the same power with only 1116. As shown in Figure 4A, the number of initial screens and amyloid PET scans would, in turn, be substantially reduced to 5704 and 3784, respectively. Figure 4B shows the range of sample size reductions for differing drug effect sizes for initial screening (reduced ns range from 347 to 7039) and amyloid PET imaging (reduced ns range from 230 to 4670). As estimated drug effect sizes become smaller, the reductions in necessary sample size become substantially larger, which should lead to substantial cost reductions.
FIGURE 4.
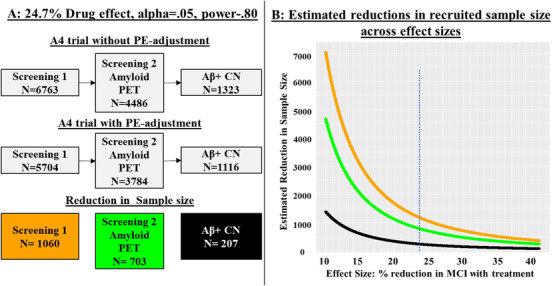
Comparison of recruitment designs for detection of a drug effect based on Anti‐Amyloid Treatment in Asymptomatic Alzheimer's Disease (A4) study recruitment. 30 Using sample size estimates from Figure 3, we present how planning to adjust for practice effects (PEs) would alter a clinical drug trial, using A4 study recruitment as an example. The A4 study had a total sample of 1323 participants after recruitment as shown in the top row of gray boxes (based on Figure 1 in Sperling et al.). 30 A, Based on sample size estimates from Figure 3, a sample of 1323 would enable a study to detect a significant drug effect of 24.7% at an alpha of 0.05 and 0.80 power. The top row of the flowchart presents the recruitment for the A4 study. This study reported an initial screening (6763 participants) followed by amyloid positron emission tomography (PET; 4486 participants) imaging to achieve their sample of 1323 amyloid‐positive (Aβ +), cognitively normal (CN) participants. Achieving the final sample size thus required an n for the initial screening that was 5.11 times as large as the final sample size, and an n for amyloid PET imaging that was 3.39 times as large as the final sample. Our power analyses suggest that the same effect size is achieved with only 1116 participants if a trial adjusted follow‐up scores for PEs. That, along with the reductions in initial screening and PET scans, is shown in the middle row of the flowchart. The bottom row shows the sample size reductions for initial screening, PET screening, and the initial biomarker‐positive and CN sample. B, The figure presents the reduction in recruitment sample size (Y‐axis) across effect sizes ranging from 10% to 40% (X‐axis). The orange line represents how many fewer participants would be necessary at initial screening if a study had planned to adjust for practice effects (PEs) at follow‐up
4. DISCUSSION
Delayed detection of MCI is extremely costly from a public health perspective. In 2018, the Alzheimer's Association projected an estimated US national savings of $231 billion by 2050 if those on the AD trajectory were diagnosed during the MCI, rather than the dementia, stage. 1 In clinical practice, the MCI stage represents a critical time for preparation and intervention for individuals who will progress to AD‐related dementia. If PEs delay detection of MCI, clinicians may also be providing inadequate care to those most at risk.
Results of the present study confirm our hypothesis that adjusting for PEs using the replacement‐participants method does lead to earlier detection of MCI. Accounting for cognitive PEs resulted in a 26% increase in 12‐month MCI incidence. The increase in biomarker‐positive MCI (+20% amyloid‐positive) and reduction in biomarker‐positive CN participants (–6% amyloid‐positive) supports diagnostic validity. Failure to account for PEs led to a substantial number of false negatives as 18% of biomarker‐positive MCI cases were labeled as CN at follow‐up. Accounting for PEs improved accuracy, reducing false positives by 5%. Individuals diagnosed with MCI based on PE‐adjusted scores—who would otherwise have been considered CN—would be expected to progress to AD dementia sooner than true CN participants. Progression at later follow‐ups was consistent with this hypothesis, but sample sizes were too small for statistical comparisons (see Table S3 in supporting information). Taken together, these results demonstrate that this approach reduces the observed discrepancy between biologically‐ and clinically‐based diagnoses. 31 As such, not adjusting for PEs weakens our ability to accurately determine the effect of novel treatments and to compare case‐control biomarker differences, a goal of current research guidelines. 32 Importantly, the replacement‐participant method is not dependent on diagnostic approach. All significant differences for Jak‐Bondi criteria remained for Petersen criteria.
To quantify how clinical trials would be improved by PE adjustment, we estimated sample sizes necessary to power a simulated clinical drug trial. Our PE adjustment increased the base rate of MCI at 12‐month follow‐up and, other things being equal, detecting differences or making predictions is less accurate for low base rate events. 33 Progression to disease is the most common outcome of interest in clinical trials, and smaller samples would be needed for clinical trials with a PE‐adjusted diagnostic endpoint. Across effect sizes, there was an average reduction of 16% in necessary sample size using PE‐adjusted diagnoses; sample size reductions were greater with smaller treatment effect sizes (Figures 3, 4). Based on screening/recruitment numbers in the A4 study, 30 Figure 4A showed that determining progression to MCI using PE‐adjusted scores would mean 1060 fewer initial screenings and 703 fewer amyloid PET scans. At $5000 per scan, cost savings for that alone would be $3.52 million. Initial screening—which included cognitive testing, clinical assessments, and apolipoprotein E genotyping—for 1060 individuals would result in considerable additional cost savings, estimated at $2.50 million. Cost saving would be partially offset by needing to add replacement participants. In prior work, 150 to 200 replacement participants were sufficient. 12 With replacements for three follow‐up cognitive assessment sessions with 200 participants each, we estimated additional costs of $615,000. Estimated overall savings would be $5.41 million. Moreover, PE‐adjusted diagnoses result in earlier detection, which means shorter follow‐up periods. Reduced study duration would lead to still further cost reductions and benefits including lower participant and staff burden, fewer invasive procedures, and likely reduced attrition.
The present study may raise the question of how the replacement‐participants method compares with other approaches to PEs, but that is likely to be the wrong question because different approaches may be for different purposes. A 2012 meta‐analysis and 2015 review described several approaches to estimating PEs. 11 , 14 Almost all non‐replacement approaches—including more commonly used regression‐based approaches—are only informative about relative differences, including predicting future change. One interesting paradigm is to retest participants after a short interval using a regression‐based approach, and then have a much longer follow‐up. Individuals with smaller PEs at 1 week are more likely to have worse baseline biomarker profiles, experience steeper 1‐year decline, and progress to MCI/AD compared to other participants. 15 , 20 , 34 , 35 Thus, this approach may be useful for participant selection in clinical trials. Other studies have found that additional baseline tests improve prediction of progression to MCI. 7 , 20 , 36 , 37 , 38 , 39 , 40 Whether complete 1‐week retesting of the entire sample improves prediction over the less burdensome and less costly inclusion of additional measures at baseline testing remains to be determined. Also, regression‐based methods require a large, normative change sample, and would require new, large normative samples for each study if the specific tests, retest intervals, or sample demographics are different. Change is assessed relative to the normative sample, but PEs are still unknown in the normative sample. Importantly, regression‐based approaches cannot be used for absolute diagnostic cutoff thresholds because, unlike the replacement‐participant method, they do not produce stand‐alone follow‐up scores adjusted for PEs. Thus, they cannot have any effect on when a person crosses an impairment threshold and cannot lead to earlier detection of conversion to MCI. Nor can they calculate PEs in the presence of a mean‐level decline over time, which is expected in older adults. The replacement‐participants method requires a small number of additional participants relative to an entire study sample, and it generates adjusted scores at follow‐up that are not obscured by age‐related decline. The other methods can compare trajectories of people already diagnosed as MCI or CN, but only the replacement method—which generates absolute PE‐adjusted scores—can alter when MCI is detected. Although the replacement‐participants method reduces all scores, it does not change individual differences in any way. Thus, it also allows for comparison of trajectories. More thorough discussions of PE methods can be found in a systematic review by Calamia et al., 11 the position paper on PEs by the American Academy of Clinical Neuropsychology, 10 and a study that directly compares three regression‐based PE approaches. 42
We acknowledge some limitations of the study. ADNI is not a population‐based study and is not representative of the general population in terms of sociodemographic factors. However, replacement methods have been shown to be effective in other studies, including population‐based samples. 12 , 17 The method currently only examines PEs across two time points. As PEs persist over time, their magnitude may differ with additional assessments. Future studies should explore PEs in cases with multiple follow‐up visits. As noted, including matched replacements for third and fourth visits would still be cost‐effective. Some participants who do not qualify after initial screening or those who do not agree to biomarker assessment might still qualify to serve as replacement participants. Importantly, the PE magnitudes in the present study should not be directly used in other studies. PEs are often sample specific and need to be calculated with appropriate replacement participants for each study. 11 , 42 Ultimately, the field may benefit from the development of PE norms for standard neuropsychological tests at some clinically meaningful intervals (e.g., 6 and 12 months). This could reduce the need for replacement participants. Similarly, sample size estimations for our hypothetical clinical trial may not be the same for other studies, but do provide more empirical evidence supporting the use of PE‐adjustment.
Surprisingly, we found no practice effect on the AVLT. This may have occurred because, despite receiving the same version at the 12‐month visit, some participants also completed an alternate version of the AVLT at a 6‐month visit. The reduced 12‐month practice effect for AVLT is consistent with the well‐known phenomenon of retroactive interference, that is, the different 6‐month version interfering with the PE from exposure to the baseline/follow‐up version. Prior studies, including our own, have consistently found PEs on the AVLT or similar episodic memory measures. 11 , 12 , 17 Thus, the present estimate of the impact of PEs may be a conservative one. It is also noteworthy that despite the lack of an apparent AVLT practice effect in the current study, we still found an increase in amnestic MCI cases after adjusting for PEs. This highlights the importance of including more than one test in each cognitive domain as specified in the Jak‐Bondi approach. 7 , 8 , 12 , 36 Finally, we note that use of alternate forms is considered suboptimal as even well‐matched forms are not equivalent and add an additional source of test–retest variance. 43
In summary, adjusting for PEs results in earlier and more accurate detection of MCI. Reluctance to include additional replacement‐participant testing is understandable as it increases cost and participant burden. In the end, however, it would substantially reduce the necessary sample size, follow‐up time, participant and staff burden, and cost for clinical trials or other longitudinal studies. Although the magnitude of PEs may not be generalized from one sample to another, the replacement‐participant method is appropriate for all ages, tests, and retest intervals because replacements are always matched on these features. The method is also not dependent on any specific approach to the diagnosis of MCI. Additionally, we have shown that the replacement‐participant method can be adapted for ongoing or already completed studies that did not recruit matched‐replacement participants in advance. Given the public health importance of the earliest possible identification of AD pathology, we strongly recommend that accounting for PEs be a planned component of clinical trials, routine clinical work, and longitudinal studies of aging and aging‐related cognitive disorders.
CONFLICTS OF INTEREST
Dr. Bondi receives royalties from Oxford University Press, consulting fees from Roche and Novartis, and honorarium from the International Neuropsychological Society. He is also associated with a clinical trial at the Cleveland Clinic and is the vice chair of the Cognition Professional Interest Area (iSTAART/Alzheimer's Association). Dr. Gross is on the data safety monitory Board for a NIA‐funded trial let by Pennington Labs. Dr. Jak receives payments from the Ohio Council on Aging. All other authors declare no competing interests.
AUTHOR CONTRIBUTIONS
The study was conceived by Mark Sanderson‐Cimino and William S. Kremen. Guidance on statistical analysis was provided by Xin M. Tu and Alden L. Gross. Determination of MCI diagnoses was made by Emily C. Edmonds, Mark W. Bondi, Joel S. Eppig, and Kelsey R. Thomas. Mark Sanderson‐Cimino, William S. Kremen, Jeremy A. Elman, Matthew S. Panizzon, and Daniel E. Gustavson contributed to the practice effects methodology. Primary funding to support this work was obtain by William S. Kremen, Carol E. Franz, Michael J. Lyons, and Mark Sanderson‐Cimino. All authors provided critical review and commentary on the manuscript.
Supporting information
Supporting Information
ACKNOWLEDGMENTS
The content of this article is the responsibility of the authors and does not necessarily represent official views of the National Institute on Aging or the Department of Veterans Affairs. The ADNI and funding sources had no role in data analysis, interpretation, or writing of this project. The corresponding author was granted access to the data by ADNI and conducted the analyses.
Sanderson‐Cimino M, Elman JA, Tu XM, et al., Alzheimer's Disease Neuroimaging Initiative . Cognitive practice effects delay diagnosis of MCI: Implications for clinical trials. Alzheimer's Dement. 2022;8:e12228. 10.1002/trc2.12228
REFERENCES
- 1. Alzheimer's Association 2018 Alzheimer's disease facts and figures. Alzheimer's Dement. 2018;14(3):367‐429. [Google Scholar]
- 2. Brookmeyer R, Johnson E, Ziegler‐Graham K, Arrighi HM. Forecasting the global burden of Alzheimer's disease. Alzheimer's Dement. 2007;3(3):186‐191. [DOI] [PubMed] [Google Scholar]
- 3. Rafii MS, Aisen PS. Alzheimer's disease clinical trials: moving toward successful prevention. CNS Drugs. 2019;33(2):99‐106. [DOI] [PMC free article] [PubMed] [Google Scholar]
- 4. Gauthier S, Albert M, Fox N, et al. Why has therapy development for dementia failed in the last two decades? Alzheimer's Dement. 2016;12(1):60‐64. [DOI] [PubMed] [Google Scholar]
- 5. Cummings J, Lee G, Ritter A, Sabbagh M, Zhong K. Alzheimer's disease drug development pipeline: 2019. Alzheimer's Dementia. 2019;5:272‐293. [DOI] [PMC free article] [PubMed] [Google Scholar]
- 6. Sperling RA, Rentz DM, Johnson KA, et al. The A4 study: stopping AD before symptoms begin? Sci Transl Med. 2014;6(228):228fs13‐228fs13. [DOI] [PMC free article] [PubMed] [Google Scholar]
- 7. Bondi MW, Edmonds EC, Jak AJ, et al. Neuropsychological criteria for mild cognitive impairment improves diagnostic precision, biomarker associations, and progression rates. J Alzheimers Dis. 2014:275‐289. [DOI] [PMC free article] [PubMed] [Google Scholar]
- 8. Edmonds EC, Ard MC, Edland SD, Galasko DR, Salmon DP, Bondi MW. Unmasking the benefits of donepezil via psychometrically precise identification of mild cognitive impairment: a secondary analysis of the ADCS vitamin E and donepezil in MCI study. Alzheimer's Dement. 2018;4:11‐18. [DOI] [PMC free article] [PubMed] [Google Scholar]
- 9. Gross AL, Chu N, Anderson L, Glymour, M.M , Jones, RN , & Coalition Against Major Diseases . Do people with Alzheimer's disease improve with repeated testing? Unpacking the role of content and context in retest effects. Alzheimer's Dement. 2018;47(6):P866‐P871. [DOI] [PMC free article] [PubMed] [Google Scholar]
- 10. Heilbronner RL, Sweet JJ, Attix DK, et al. Official position of the American Academy of Clinical Neuropsychology on serial neuropsychological assessments: the utility and challenges of repeat test administrations in clinical and forensic contexts. Clin Neuropsychol. 2010;24(8):1267‐1278. [DOI] [PubMed] [Google Scholar]
- 11. Calamia M, Markon K, Tranel D. Scoring higher the second time around: meta‐analyses of practice effects in neuropsychological assessment. Clin Neuropsychol. 2012;26(4):543‐570. [DOI] [PubMed] [Google Scholar]
- 12. Elman JA, Jak AJ, Panizzon MS, et al. Underdiagnosis of mild cognitive impairment: a consequence of ignoring practice effects. Alzheimer's Dement. 2018;10:372‐381. [DOI] [PMC free article] [PubMed] [Google Scholar]
- 13. Gross AL, Benitez A, Shih R, et al. Predictors of retest effects in a longitudinal study of cognitive aging in a diverse community‐based sample. J Int Neuropsychol Soc. 2015;21(7):506‐518. [DOI] [PMC free article] [PubMed] [Google Scholar]
- 14. Goldberg TE, Harvey PD, Wesnes KA, Snyder PJ, Schneider LS. Practice effects due to serial cognitive assessment: implications for preclinical Alzheimer's disease randomized controlled trials. Alzheimer's Dement. 2015;1(1):103‐111. [DOI] [PMC free article] [PubMed] [Google Scholar]
- 15. Duff K, Lyketsos CG, Beglinger LJ, et al. Practice effects predict cognitive outcome in amnestic mild cognitive impairment. Am J Geriatr Psychiatry. 2011;19(11):932‐939. [DOI] [PMC free article] [PubMed] [Google Scholar]
- 16. Rönnlund M, Nilsson L‐G. Adult life‐span patterns in WAIS‐R block design performance: cross‐sectional versus longitudinal age gradients and relations to demographic factors. Intelligence. 2006;34(1):63‐78. [Google Scholar]
- 17. Rönnlund M, Nyberg L, Bäckman L, Nilsson L‐G. Stability, growth, and decline in adult life span development of declarative memory: cross‐sectional and longitudinal data from a population‐based study. Psychol Aging. 2005;20(1):3‐18. [DOI] [PubMed] [Google Scholar]
- 18. Machulda MM, Hagen CE, Wiste HJ, et al. Practice effects and longitudinal cognitive change in clinically normal older adults differ by Alzheimer imaging biomarker status. Clin Neuropsychol. 2017;31(1):99‐117. [DOI] [PMC free article] [PubMed] [Google Scholar]
- 19. Mathews M, Abner E, Kryscio R, et al. Diagnostic accuracy and practice effects in the national Alzheimer's coordinating center uniform data set neuropsychological battery. Alzheimer's Dement. 2014;10(6):675‐683. [DOI] [PMC free article] [PubMed] [Google Scholar]
- 20. Jutten RJ, Grandoit E, Foldi NS, et al. Lower practice effects as a marker of cognitive performance and dementia risk: a literature review. Alzheimer's Dement. 2020;12(1):e12055. [DOI] [PMC free article] [PubMed] [Google Scholar]
- 21. Shirk SD, Mitchell MB, Shaughnessy LW, et al. A web‐based normative calculator for the uniform data set (UDS) neuropsychological test battery. Alzheimers Res Ther. 2011;3(6):32. [DOI] [PMC free article] [PubMed] [Google Scholar]
- 22. Jak AJ, Bondi MW, Delano‐Wood L, et al. Quantification of five neuropsychological approaches to defining mild cognitive impairment. Am J Geriatr Psychiatry. 2009;17(5):368‐375. [DOI] [PMC free article] [PubMed] [Google Scholar]
- 23. Shaw LM, Vanderstichele H, Knapik‐Czajka M, et al. Cerebrospinal fluid biomarker signature in Alzheimer's disease neuroimaging initiative subjects. Ann Neurol. 2009;65(4):403‐413. [DOI] [PMC free article] [PubMed] [Google Scholar]
- 24. Hansson O, Seibyl J, Stomrud E, et al. CSF biomarkers of Alzheimer's disease concord with amyloid‐beta PET and predict clinical progression: a study of fully automated immunoassays in BioFINDER and ADNI cohorts. Alzheimers Dement. 2018;14(11):1470‐1481. [DOI] [PMC free article] [PubMed] [Google Scholar]
- 25. Elman JA, Panizzon MS, Gustavson DE, et al. Amyloid‐β positivity predicts cognitive decline but cognition predicts progression to amyloid‐β positivity. Biol Psychiatry. 2020;87(9):819‐828. [DOI] [PMC free article] [PubMed] [Google Scholar]
- 26. Salthouse TA. Selective review of cognitive aging. J Int Neuropsychol Soc. 2010;16(5):754‐760. [DOI] [PMC free article] [PubMed] [Google Scholar]
- 27. Ho DE, Imai K, King G, Stuart EA. MatchIt: nonparametric preprocessing for parametric causal inference. J Stat Softw. 2011;42(8):1‐28. [Google Scholar]
- 28. Qiu W & Qiu MW (2020). Package ‘powerMediation’. R Foundation for Statistical Computing.
- 29. R. C. Team . Language and Environment for Statistical Computing. R Foundation for Statistical Computing; 2019. [Google Scholar]
- 30. Sperling RA, Donohue MC, Raman R, et al. Association of factors with elevated amyloid burden in clinically normal older individuals. JAMA Neurol. 2020;77(6):735‐745. [DOI] [PMC free article] [PubMed] [Google Scholar]
- 31. Jack CR, Therneau TM, Weigand SD, et al. Prevalence of biologically vs clinically defined Alzheimer spectrum entities using the National Institute on Aging–Alzheimer's Association research framework. JAMA Neurol. 2019;76(10):1174‐1183. [DOI] [PMC free article] [PubMed] [Google Scholar]
- 32. Jack CR Jr, Bennett DA, Blennow K, et al. NIA‐AA research framework: toward a biological definition of Alzheimer's disease. Alzheimer's Dement. 2018;14(4):535‐562. [DOI] [PMC free article] [PubMed] [Google Scholar]
- 33. Mehta C, Gao P, Bhatt DL, Harrington RA, Skerjanec S, Ware JH. Optimizing trial design: sequential, adaptive, and enrichment strategies. Circulation. 2009;119(4):597‐605. [DOI] [PubMed] [Google Scholar]
- 34. Duff K. One‐week practice effects in older adults: tools for assessing cognitive change. Clin Neuropsychol. 2014;28(5):714‐725. [DOI] [PMC free article] [PubMed] [Google Scholar]
- 35. Duff K, Foster NL, Hoffman JM. Practice effects and amyloid deposition: preliminary data on a method for enriching samples in clinical trials. Alzheimer Dis Assoc Disord. 2014;28(3):247. [DOI] [PMC free article] [PubMed] [Google Scholar]
- 36. Gustavson DE, Elman JA, Sanderson‐Cimino M, et al. Extensive memory testing improves prediction of progression to MCI in late middle age. Alzheimer's Dement. 2020;12(1):e12004. [DOI] [PMC free article] [PubMed] [Google Scholar]
- 37. Elman JA, Vuoksimaa E, Franz CE, Kremen WS. Degree of cognitive impairment does not signify early versus late mild cognitive impairment: confirmation based on Alzheimer's disease polygenic risk. Neurobiol Aging. 2020;94:149‐153. [DOI] [PMC free article] [PubMed] [Google Scholar]
- 38. Vuoksimaa E, Mcevoy LK, Holland D, Franz CE, Kremen WS. Modifying the minimum criteria for diagnosing amnestic MCI to improve prediction of brain atrophy and progression to Alzheimer's disease. Brain Imaging Behav. 2020;14(3):787‐796. [DOI] [PMC free article] [PubMed] [Google Scholar]
- 39. Edmonds EC, Delano‐Wood L, Jak AJ, Galasko DR, Salmon DP, Bondi MW. “Missed” mild cognitive impairment: high false‐negative error rate based on conventional diagnostic criteria. J Alzheimers Dis. 2016;52(2):685‐691. [DOI] [PMC free article] [PubMed] [Google Scholar]
- 40. Edmonds EC, Delano‐Wood L, Clark LR, et al. Susceptibility of the conventional criteria for mild cognitive impairment to false‐positive diagnostic errors. Alzheimer's Dement. 2015;11(4):415‐424. [DOI] [PMC free article] [PubMed] [Google Scholar]
- 41. Vivot A, Power MC, Glymour MM, et al. Jump, hop, or skip: modeling practice effects in studies of determinants of cognitive change in older adults. Am J Epidemiol. 2016;183(4):302‐314. [DOI] [PMC free article] [PubMed] [Google Scholar]
- 42. Duff K, Hammers DB. Practice effects in mild cognitive impairment: A validation of Calamia et al. (2012). The Clinical Neuropsychologist. 2020;1–13. 10.1080/13854046.2020.1781933 [DOI] [PMC free article] [PubMed] [Google Scholar]
- 43. Gross AL, Inouye SK, Rebok GW, et al. Parallel but not equivalent: challenges and solutions for repeated assessment of cognition over time. J Clin Exp Neuropsychol. 2012;34(7):758‐772. [DOI] [PMC free article] [PubMed] [Google Scholar]
Associated Data
This section collects any data citations, data availability statements, or supplementary materials included in this article.
Supplementary Materials
Supporting Information