

Abstract
Objective:
Blood–brain barrier (BBB) breakdown has been suggested to be an early biomarker in human cognitive impairment. However, the relationship between BBB breakdown and brain pathology, most commonly Alzheimer disease (AD) and vascular disease, is still poorly understood. The present study measured human BBB function in mild cognitive impairment (MCI) patients on 2 molecular scales, specifically BBB’s permeability to water and albumin molecules.
Methods:
Fifty-five elderly participants were enrolled, including 33 MCI patients and 22 controls. BBB permeability to water was measured with a new magnetic resonance imaging technique, water extraction with phase contrast arterial spin tagging. BBB permeability to albumin was determined using cerebrospinal fluid (CSF)/serum albumin ratio. Cognitive performance was assessed by domain-specific composite scores. AD pathology (including CSF Aβ and ptau) and vascular risk factors were examined.
Results:
Compared to cognitively normal subjects, BBB in MCI patients manifested an increased permeability to small molecules such as water but was no more permeable to large molecules such as albumin. BBB permeability to water was found to be related to AD markers of CSF Aβ and ptau. On the other hand, BBB permeability to albumin was found to be related to vascular risk factors, especially hypercholesterolemia, but was not related to AD pathology. BBB permeability to small molecules, but not to large molecules, was found to be predictive of cognitive function.
Interpretation:
These findings provide early evidence that BBB breakdown is related to both AD and vascular risks, but their effects can be differentiated by spatial scales. BBB permeability to small molecules has a greater impact on cognitive performance.
Cognitive impairment and dementia affect more than 50 million people worldwide.1 Recent literature suggests that damage to the blood–brain barrier (BBB) may play a key role in this process and present a novel target for therapeutic interventions.2–13 The BBB, formed by vascular endothelial and supporting cells, functions to regulate blood–brain exchange of substances and protect the central nervous system from neurotoxins and pathogens.14 Postmortem studies demonstrated an accumulation of blood-derived proteins in brain parenchyma, degeneration of BBB-specific cells, and injury of vascular endothelium in brains of dementia patients.15,16 In vivo studies also showed that cerebrospinal fluid (CSF) of cognitively impaired patients has a higher concentration of blood-derived albumin when compared with healthy controls, suggesting a BBB disruption.17–20 BBB breakdown and neuroinflammation may also be a critical component in the contribution of gut microbiota to dementia.21
However, the relationship between BBB breakdown and brain pathology in cognitive impairment is still poorly understood. Cognitive impairment can be attributed to different pathological mechanisms, with different treatment strategies. Alzheimer pathology and vascular risks as well as their mixed presentation account for more than 80% of patients with cognitive impairment.22–24 Some studies have shown that the BBB disruption is related to amyloid-β peptide (Aβ) accumulation,21,25,26 thereby linking BBB to Alzheimer disease (AD) pathology. Others showed that BBB breakdown in cognitively impaired subjects was independent of amyloid and tau.5 Recent literature has also suggested that BBB breakdown is related to vascular risks, as evidenced by a significant correlation between BBB permeability and white matter hyperintensities (WMH).3,8,27–29 Patients with enlarged perivascular space or microbleeds were shown to reveal higher BBB permeability, suggesting a link to vascular risks.30,31 It is therefore important to reconcile these discrepancies in terms of the relationship of BBB breakdown to AD and vascular risks.
We hypothesize that BBB breakdown in cognitive impairment is not a single-facet phenomenon and that AD and vascular risks cause BBB breakdown at different molecular levels, which can be distinguished by using tracers of varying sizes. Therefore, in the present study, we aim to assess BBB permeability in older individuals with and without cognitive impairment on 2 spatial scales. One is to use a novel noncontrast magnetic resonance imaging (MRI) technique, water extraction with phase contrast arterial spin tagging (WEPCAST) MRI, to measure the BBB permeability to water molecules.32,33 Because the molecular weight of water is only 18Da with a diameter of 275pm, measurement of water exchange is expected to provide an assessment of BBB permeability to very small molecules. The other is the permeability to albumin, which has a molecular weight of 66,000Da and a size of 3,800pm, by measuring the concentration of albumin in CSF obtained from lumbar puncture (LP) and normalizing it against serum albumin. The BBB permeability to these 2 molecules in patients with mild cognitive impairment (MCI) was compared to that in age-matched, cognitively normal controls. The association between BBB breakdown and cognitive performance was examined. Furthermore, the relationships between BBB disruption and AD pathology as well as vascular risks were investigated.
Materials and Methods
Participants and Consensus Diagnosis
Fifty-five elderly participants were enrolled from the Johns Hopkins Alzheimer’s Disease Research Center and local outpatient clinics (age = 68.4 ± 7.3 years, 26 males, 29 females), including 33 MCI patients and 22 cognitively normal controls. All participants signed institutional review board–approved consent forms before participating in the study. The diagnostic procedure followed the recommendations of the National Institute on Aging/Alzheimer’s Association workgroups.34
Cognitive Assessments
The neuropsychological tests were divided into 4 cognitive domains, and scores were generated for each cognitive domain, by creating a z score for each test score and averaging the z scores within each domain. The domains included: (1) verbal episodic memory (Logical Memory delayed-recall,35 Hopkins Verbal Learning Test recall over trials 1–536), (2) executive function (Digit Span backward,35 Trial Making Test part B,37 Digit Symbol Test,38 Stroop Color and Word score39), (3) processing speed (Trial Making Test part A,37 Stroop Color and Word score39), and (4) language (Multilingual Naming Test,40 letter [F & L] and category [animal, vegetables] fluency tasks41). A composite overall cognitive score was computed by averaging the 4 domain scores. The Montreal Cognitive Assessment (MoCA) was also performed to evaluate global cognition.
MRI Experiments
All MRI experiments were performed on a 3T magnetic resonance system (Philips Healthcare, Best, the Netherlands). BBB permeability to water was quantified by WEPCAST MRI. Details of the WEPCAST MRI technique can be found in Lin et al.32,33 Briefly, an MRI pulse sequence module similar to pseudocontinuous arterial spin labeling was used to label water in the arterial blood in the cervical spine region. At the capillary–tissue interface, water exchange across the BBB takes place and a fraction of the labeled water molecules is extracted into the tissue, whereas the remaining unextracted water is drained to the venous system. WEPCAST MRI selectively measures the amount of labeled water in the superior sagittal sinus (SSS), which can give an estimation of the global extraction fraction (E) of water. Together with global cerebral blood flow (CBF; f), BBB permeability can be assessed as permeability–surface area product (PS)42:
| (1) |
WEPCAST MRI was performed in midsagittal plane using a labeling duration of 2,000 milliseconds, a postlabeling delay (PLD) of 4,000 milliseconds, and an encoding velocity (Venc) of 15cm/s. Other imaging parameters were as follows: single-shot gradient echo planar imaging readout, field of view (FOV) = 200 × 200mm2, single slice, matrix = 64 × 64, voxel size = 3.13 × 3.13mm2, slice thickness = 10mm, SENSE factor = 2, flip angle = 90°, repetition time (TR) = 7,547 milliseconds, echo time (TE) = 13 milliseconds, number of control/label pairs = 10, scan duration = 5 minutes 9 seconds. An additional M0 image with the same TE and Venc and a long TR (10 seconds) was acquired for normalization.
Global CBF was measured by phase-contrast (PC) MRI at 4 main feeding arteries (left/right internal carotid arteries and left/right vertebral arteries)43 and a T1-weighted magnetization-prepared rapid acquisition of gradient echo (MPRAGE) scan. The imaging planes of the PC MRI were placed perpendicular to the targeted arteries with the following parameters: TR = 19.8 milliseconds, TE = 9.68 milliseconds, flip angle = 15°, FOV = 200 × 200 × 5mm3, voxel size = 0.5 × 0.5 × 5mm3, single slice, Venc = 40cm/s, and scan duration = 15.9 seconds.
A fluid-attenuated inversion recovery MRI scan was acquired to assess WMH with the following parameters: TR = 4,800 milliseconds, TE = 275 milliseconds, inversion time = 1,650 milliseconds, flip angle = 90°, FOV = 240 × 240 × 165mm3, voxel size = 1.1 × 1.1 × 1.1mm3, number of slices = 150, axial orientation, and scan duration = 4 minutes 14 seconds.
MRI Data Processing
All MRI data were processed using in-house MATLAB (MathWorks, Natick, MA) scripts. Details of WEPCAST processing can be found in Lin et al.32,33 Briefly, PC velocity-encoded images were collected for control and label conditions, and their subtraction yielded arterially labeled signals (ΔM) at acquisition time t:
| (2) |
where E is the extraction fraction of water, α is labeling efficiency (assumed to be 86%44), δ is bolus arrival time (BAT) of SSS, and T1b is venous blood T1 (calculated based on individual hematocrit level45). M0 is the equilibrium magnetization and was measured from the M0 scan mentioned above. is the arterial input function, where τ is labeling duration. denotes the Gaussian kernel due to dispersion of the labeled bolus (where σ is the standard deviation of the distribution, assumed to be 0.5, which is 2 times that in the arterial side46) and ⊗ denotes convolution operation. Thus, the only unknowns in Equation 2 are δv and E. We took advantage of having measured WEPCAST signal along the entire length of the SSS. Then the peak signal should appear at the center of the labeling bolus, and the BAT of it is . Once δv is known, E can be estimated using Equation 2. Then PS was estimated from E and CBF using Equation 1.
The MPRAGE images were segmented using an automatic processing tool, MRICloud (www.MRICloud.org, Johns Hopkins University, Baltimore, MD), for total brain volume quantification, which is needed for CBF quantification. Additionally, we quantified temporal lobe volume (relative to intracranial volume) as an index of brain atrophy.
Qualitative WMH were assessed by a board-certified neuroradiologist to obtain a Fazekas score indicating their severity. Quantitative WMH volume was obtained by a Bayesian-based automatic detection method as described in DeCarli et al.47
CSF Sample Analysis
CSF was collected via LP. Thirty-four (age = 69.3 ± 7.3 years, 15 males, 19 females) of the 55 participants who received WEPCAST MRI underwent LP (62%).
CSF and blood albumin concentration were measured with the turbidimetric assay on the Tina-quant Albumin Gen.2 analyzer (Roche Diagnostics International, Rotkreuz, Switzerland). CSF/serum albumin ratio was calculated as the index of BBB permeability to albumin.
Additionally, AD biomarkers, including CSF Aβ42, Aβ40, total tau, and ptau-181 concentration (picograms/milliliter), were estimated in 32 participants (age = 69.1 ± 7.5 years, 15 males, 17 females) using the Neurology 3-plex Simoa immunoassay (Quanterix, Lexington, MA) on the SR-X platform. All samples were analyzed over 2 plates with the same lot number, and an average value for the 2 runs was recorded. The ratio between CSF Aβ42 and Aβ40 was used as an index of amyloid pathology. A CSF standard was run across both plates to ensure minimal plate-to-plate variability. Note that this group (n = 32) fully overlapped with the participants with CSF/serum albumin ratio (n = 34). Additionally, 12 participants (age = 69.9 ± 7.8 years, 5 males, 7 females, 4 controls, 8 MCI) who were recruited using the identical criteria but did not participate in the BBB study were included when making comparisons of the AD biomarkers between groups.
CSF neurofilament light chain (NFL) level was measured with the Simoa NF-Light Kit using the HD-X platform (Quanterix) in the same group of participants. Intra-assay and interassay coefficients of variation were <10% and <15% for quality control samples, respectively.
Vascular Risk Factors
Clinical evaluation of vascular risk factors was collected from all participants. There has not been a standard in the literature as to how the vascular risks should be quantified and combined; the present study used binary encoding of these variables based on procedures we employed previously.48,49 Specifically, 5 measures were considered: (1) hypertension (1 if recent, 0 if remote/absent), (2) hypercholesterolemia (1 if recent, 0 if remote/absent), (3) diabetes (1 if recent, 0 if remote/absent), (4) smoking (1 if smoked >100 cigarettes in his/her life, 0 if not), and (5) body mass index (BMI; calculated as weight in kilograms divided by height in meters squared; 1 if BMI > 30, 0 if not). A composite vascular risk score (VRS) was calculated as the sum of the 5 measures48–51 and ranged from 0 to 5.
APOE Status.
Genomic DNA was extracted from buffy coat using the QIAamp DNA Mini QIAcube Kit (QIAGEN, Germantown, MD). Genotyping was performed using premade TaqMan single nucleotide polymorphism genotyping assays C-905013-10 (rs405509), C-3084793-20 (rs429358), and C-904973-10 (rs7412) using an Applied Biosystems (Foster City, CA) 7900HT Real Time PCR System. The APOE4 carrier status was coded as follows: individuals with 2 E4 alleles were coded as 2, individuals with 1 E4 allele were coded as 1, and individuals with no E4 alleles were coded as 0.
Statistical Analysis
Group differences in demographic information (including age, sex, education, and APOE4 status) were examined by 2-sample t test. Group differences in cognitive performance, brain volumes, and NFL level between MCI patients and controls were assessed by linear regression. When relevant, age, sex, and education were included as covariates.
To examine whether there was a difference in water BBB permeability between MCI and control groups, multilinear regression analysis was performed where PS was the dependent variable and group index was the independent variable, with age and sex as covariates. Similar analyses were performed to test the group differences in CSF/serum albumin ratio.
We assessed the association between BBB permeability and cognitive performance using linear regression in which the cognitive test scores were the dependent variables (separately for cognitive composite score, 4 domain scores, and MoCA score) and BBB permeability (PS or CSF/serum albumin ratio) was the independent variable, with age, sex, and education as covariates.
The relationship between BBB permeability and AD pathology (including Aβ42/Aβ40 ratio, total tau, and ptau level) was tested by linear regression analysis where PS or CSF/serum albumin ratio was the independent variable and AD pathology was the dependent variable. Age and sex were included as covariates. Similar analyses were performed to examine the relationship between BBB permeability and CSF NFL level.
To test the association between BBB permeability and vascular risks, linear regression analysis was performed using PS or CSF/serum albumin ratio as the dependent variable and vascular risk factors as the independent variable. Age and sex were included as covariates.
The relationship between BBB permeability and APOE4 status was also assessed with linear regression, correcting for age and sex. The BBB group comparison analyses mentioned above were also repeated after adding APOE4 status as a covariate.
In all analyses, a 2-tailed p value of 0.05 or less was considered statistically significant. For analyses of domain cognitive scores (ie, memory, executive function, language, and processing speed), Šidák correction was performed, that is, corrected p value = 1 − (1 − p value)n, where n = 4 to account for 4 domains. In addition, 98.75% confidence interval (CI) was calculated as corrected CI. Similarly, Šidák corrections were performed for analyses involving domain vascular risks (ie, hypertension, hypercholesterolemia, diabetes, smoking, and BMI).
Results
Demographics, Cognitive Performance, and Brain Volume
Demographic information of the participants is summarized in Table 1. There were no differences between MCI and control groups in terms of age, sex, and education. However, the MCI group had a significantly higher fraction of participants with APOE4 in comparison with the control group (95% CI = 0.0076–0.63, p = 0.045). As expected, significant differences were found in cognitive composite score (95% CI = −0.88 to −0.48, p < 0.001), episodic memory (95% CI = −1.19 to −0.53, p < 0.001), executive function (95% CI = −1.13 to −0.56, p < 0.001), language (95% CI = −0.68 to −0.13, p = 0.019), processing speed (95% CI = −1.02 to 0.21, p = 0.014), and MoCA score (95% CI = −3.33 to −0.99, p < 0.001) between the 2 groups, after adjusting for age, sex, and education, with the MCI group having poorer scores on all tests. MCI patients also had a significantly smaller normalized temporal lobe volume compared with controls (95% CI = −0.47 to −0.042, p = 0.020) after adjusting for age and sex.
TABLE 1.
Demographic, Clinical, and Biomarker Information of All Participants (Mean ± Standard Deviation)
| Characteristic | All Participants MCI | Controls | P | |||
|---|---|---|---|---|---|---|
| MCI | Controls | P | ||||
| n | 33 | 22 | 17 | 17 | ||
| Age, yr | 68.2 ± 8.1 | 68.5 ± 6.2 | 0.90 | 68.1 ± 8.9 | 70.6 ± 5.4 | 0.32 |
| Females, n (%) | 16 (48.5%) | 13 (59.1%) | 0.45 | 8 (47.1%) | 11 (64.7%) | 0.31 |
| Education, yr | 15.6 ± 3.6 | 16.6 ± 2.6 | 0.26 | 14.9 ± 3.8 | 16.5 ± 2.8 | 0.17 |
| Episodic memory | −0.15 ± 0.65 | 0.76 ± 0.52 | <0.001 | −0.34 ± 0.74 | 0.79 ± 0.53 | <0.001 |
| Executive function | −0.24 ± 0.55 | 0.64 ± 0.41 | <0.001 | −0.35 ± 0.55 | 0.62 ± 0.44 | <0.001 |
| Language | −0.0096 ± 0.59 | 0.48 ± 0.54 | 0.019 | −0.042 ± 0.54 | 0.50 ± 0.55 | 0.025 |
| Processing speed | −0.055 ± 0.78 | 0.58 ± 0.58 | 0.014 | −0.31 ± 0.80 | 0.50 ± 0.47 | 0.0048 |
| Composite cognition | −0.11 ± 0.44 | 0.62 ± 0.29 | <0.001 | −0.26 ± 0.45 | 0.60 ± 0.31 | <0.001 |
| MoCA | 25.39 ± 2.47 | 27.59 ± 1.72 | <0.001 | 25.35 ± 2.74 | 27.59 ± 1.94 | 0.0013 |
| Vascular risk score | 1.91 ± 1.26 | 1.73 ± 1.24 | 0.60 | 1.71 ± 0.99 | 1.35 ± 1.00 | 0.31 |
| Hypercholesterolemia, n (%) | 20 (60.6%) | 13 (59.1%) | 0.91 | 11 (64.7%) | 8 (47.1%) | 0.31 |
| Hematocrit, % | 41.8 ± 3.6 | 42.2 ± 3.0 | 0.68 | 41.4 ± 3.5 | 42.0 ± 2.8 | 0.56 |
| Temporal lobe, % | 9.25 ± 0.40 | 9.47 ± 0.35 | 0.020 | 9.19 ± 0.44 | 9.42 ± 0.35 | 0.067 |
| CBF, ml/100g/min | 49.68 ± 9.47 | 47.39 ± 8.47 | 0.33 | 50.33 ± 10.78 | 47.95 ± 9.39 | 0.66 |
| APOE4 status | no E4, n = 21 1 E4, n = 9 2 E4, n = 3 |
no E4, n = 19 1 E4, n = 3 2 E4, n = 0 |
0.045 | no E4, n = 9 1 E4, n = 5 2 E4, n = 3 |
no E4, n = 14 1 E4, n = 3 2 E4, n = 0 |
0.035 |
| CSF NFL, pg/ml | 2,578.5 ± 802.5 | 2,281.0 ± 850.2 | 0.11 | |||
| Had AD pathology samples, n | 15 | 17 | ||||
| Aβ42/Aβ40 | 0.070 ± 0.022 | 0.073 ± 0.013 | 0.27 | |||
| Total tau, pg/ml | 141.32 ± 86.08 | 133.35 ± 56.38 | 0.20 | |||
| ptau, pg/ml | 49.87 ± 47.99 | 40.66 ± 15.05 | 0.037 |
AD = Alzheimer disease; CBF = cerebral blood flow; CSF = cerebrospinal fluid; MCI = mild cognitive impairment; MoCA = Montreal Cognitive Assessment; NFL = neurofilament light chain.
BBB Permeability in MCI and Controls
Figure 1A shows WEPCAST MRI data from representative MCI and control participants. Quantitative analysis of the WEPCAST data yields an estimation of BBB permeability to water, that is, PS value. A higher PS indicates a leakier BBB. A box plot comparing water PS values between the MCI and control groups is shown in Figure 2A. The MCI patients revealed a higher PS value (ie, breakdown of BBB) compared to controls (MCI, 142.6 ± 25.6ml/100g/min; control, 123.0 ± 26.0ml/100g/min, 95% CI of the difference = 4.8–33.8ml/100g/min, p = 0.010), after adjusting for age and sex.
FIGURE 1:
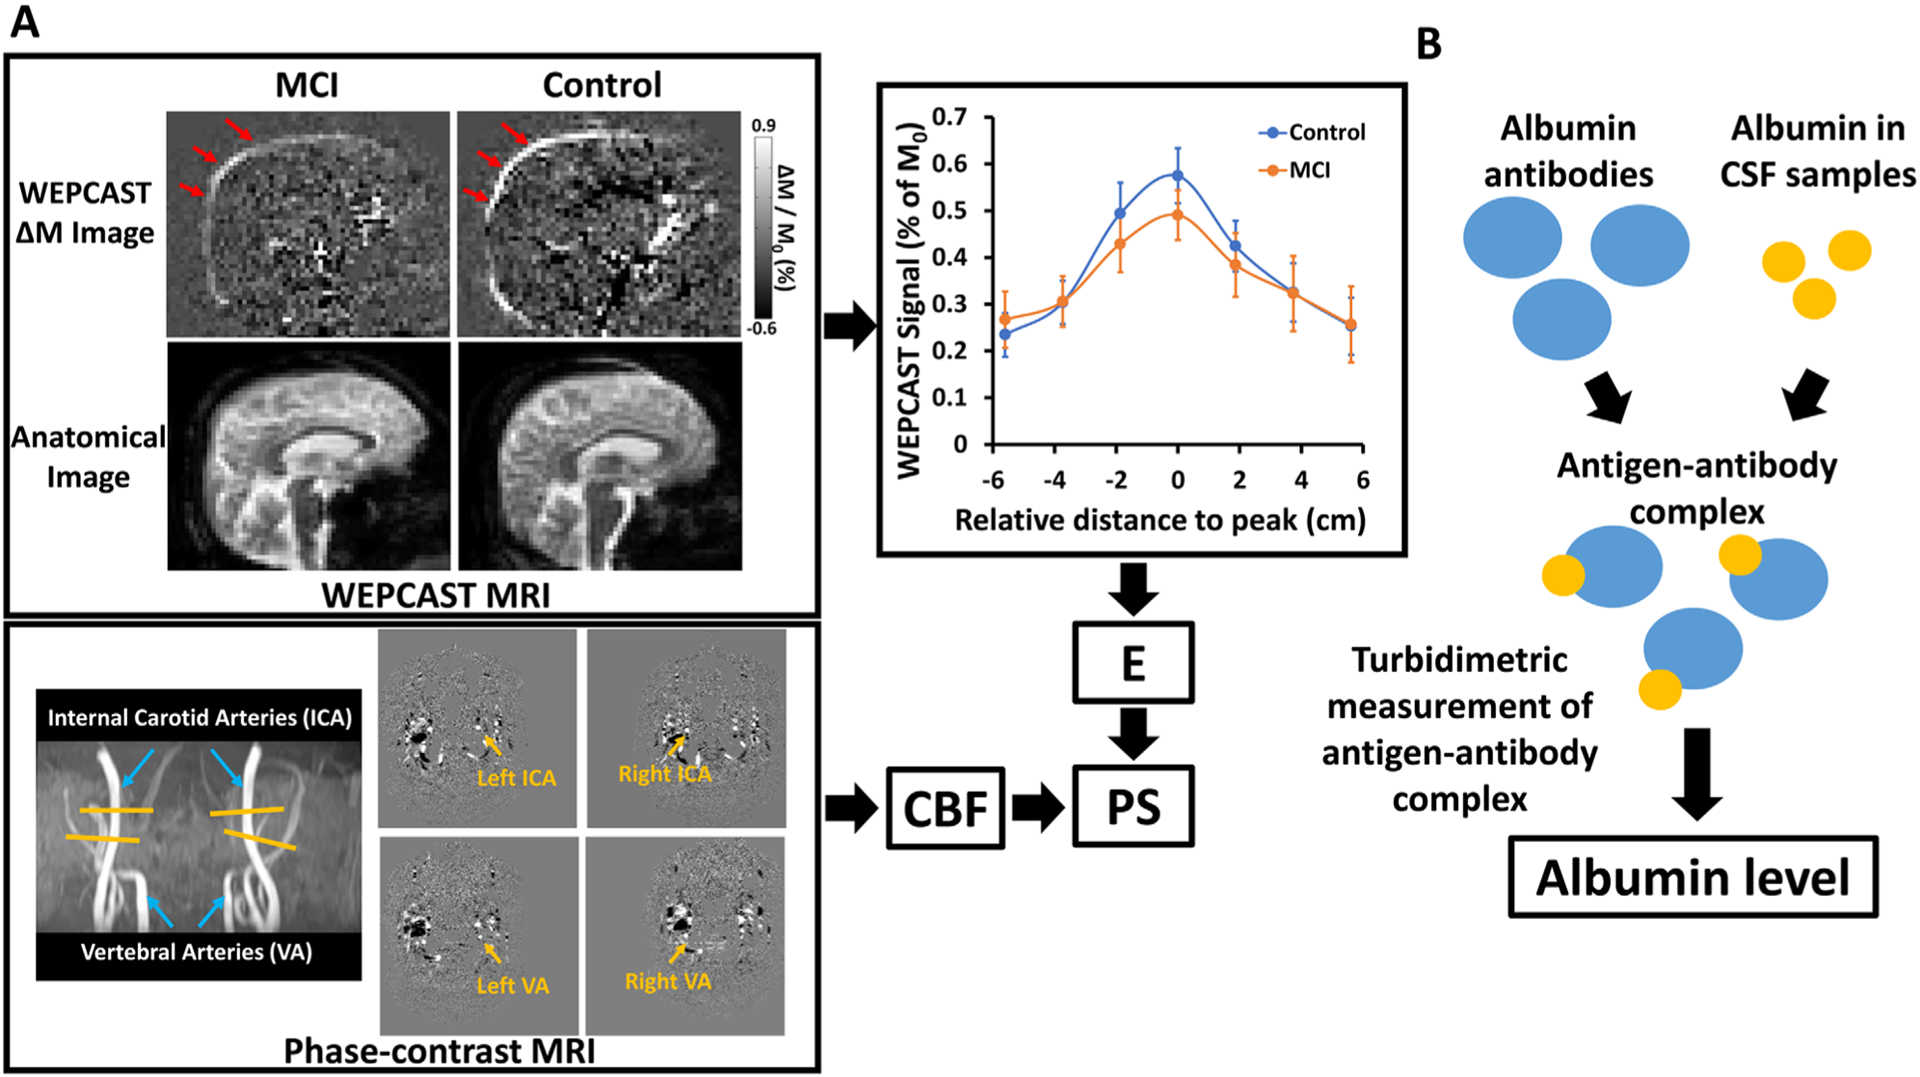
Measurement of blood–brain barrier (BBB) permeability to water and albumin. (A) Water extraction with phase contrast arterial spin tagging (WEPCAST) magnetic resonance imaging (MRI) for the assessment of BBB permeability to water. ΔM image in a representative mild cognitive impairment (MCI) and control subject and corresponding anatomic images are shown. WEPCAST difference signal curves along superior sagittal sinus (SSS) averaged for MCI and control groups are also shown. Error bar denotes standard error across participants. Peak SSS signal was used to calculate the water extraction fraction (E). Together with cerebral blood flow (CBF) measured by phase-contrast MRI, BBB permeability to water (ie, permeability–surface area product [PS] value) can be calculated. (B) Measurement of albumin level with turbidimetric assay. CSF = cerebrospinal fluid.
FIGURE 2:
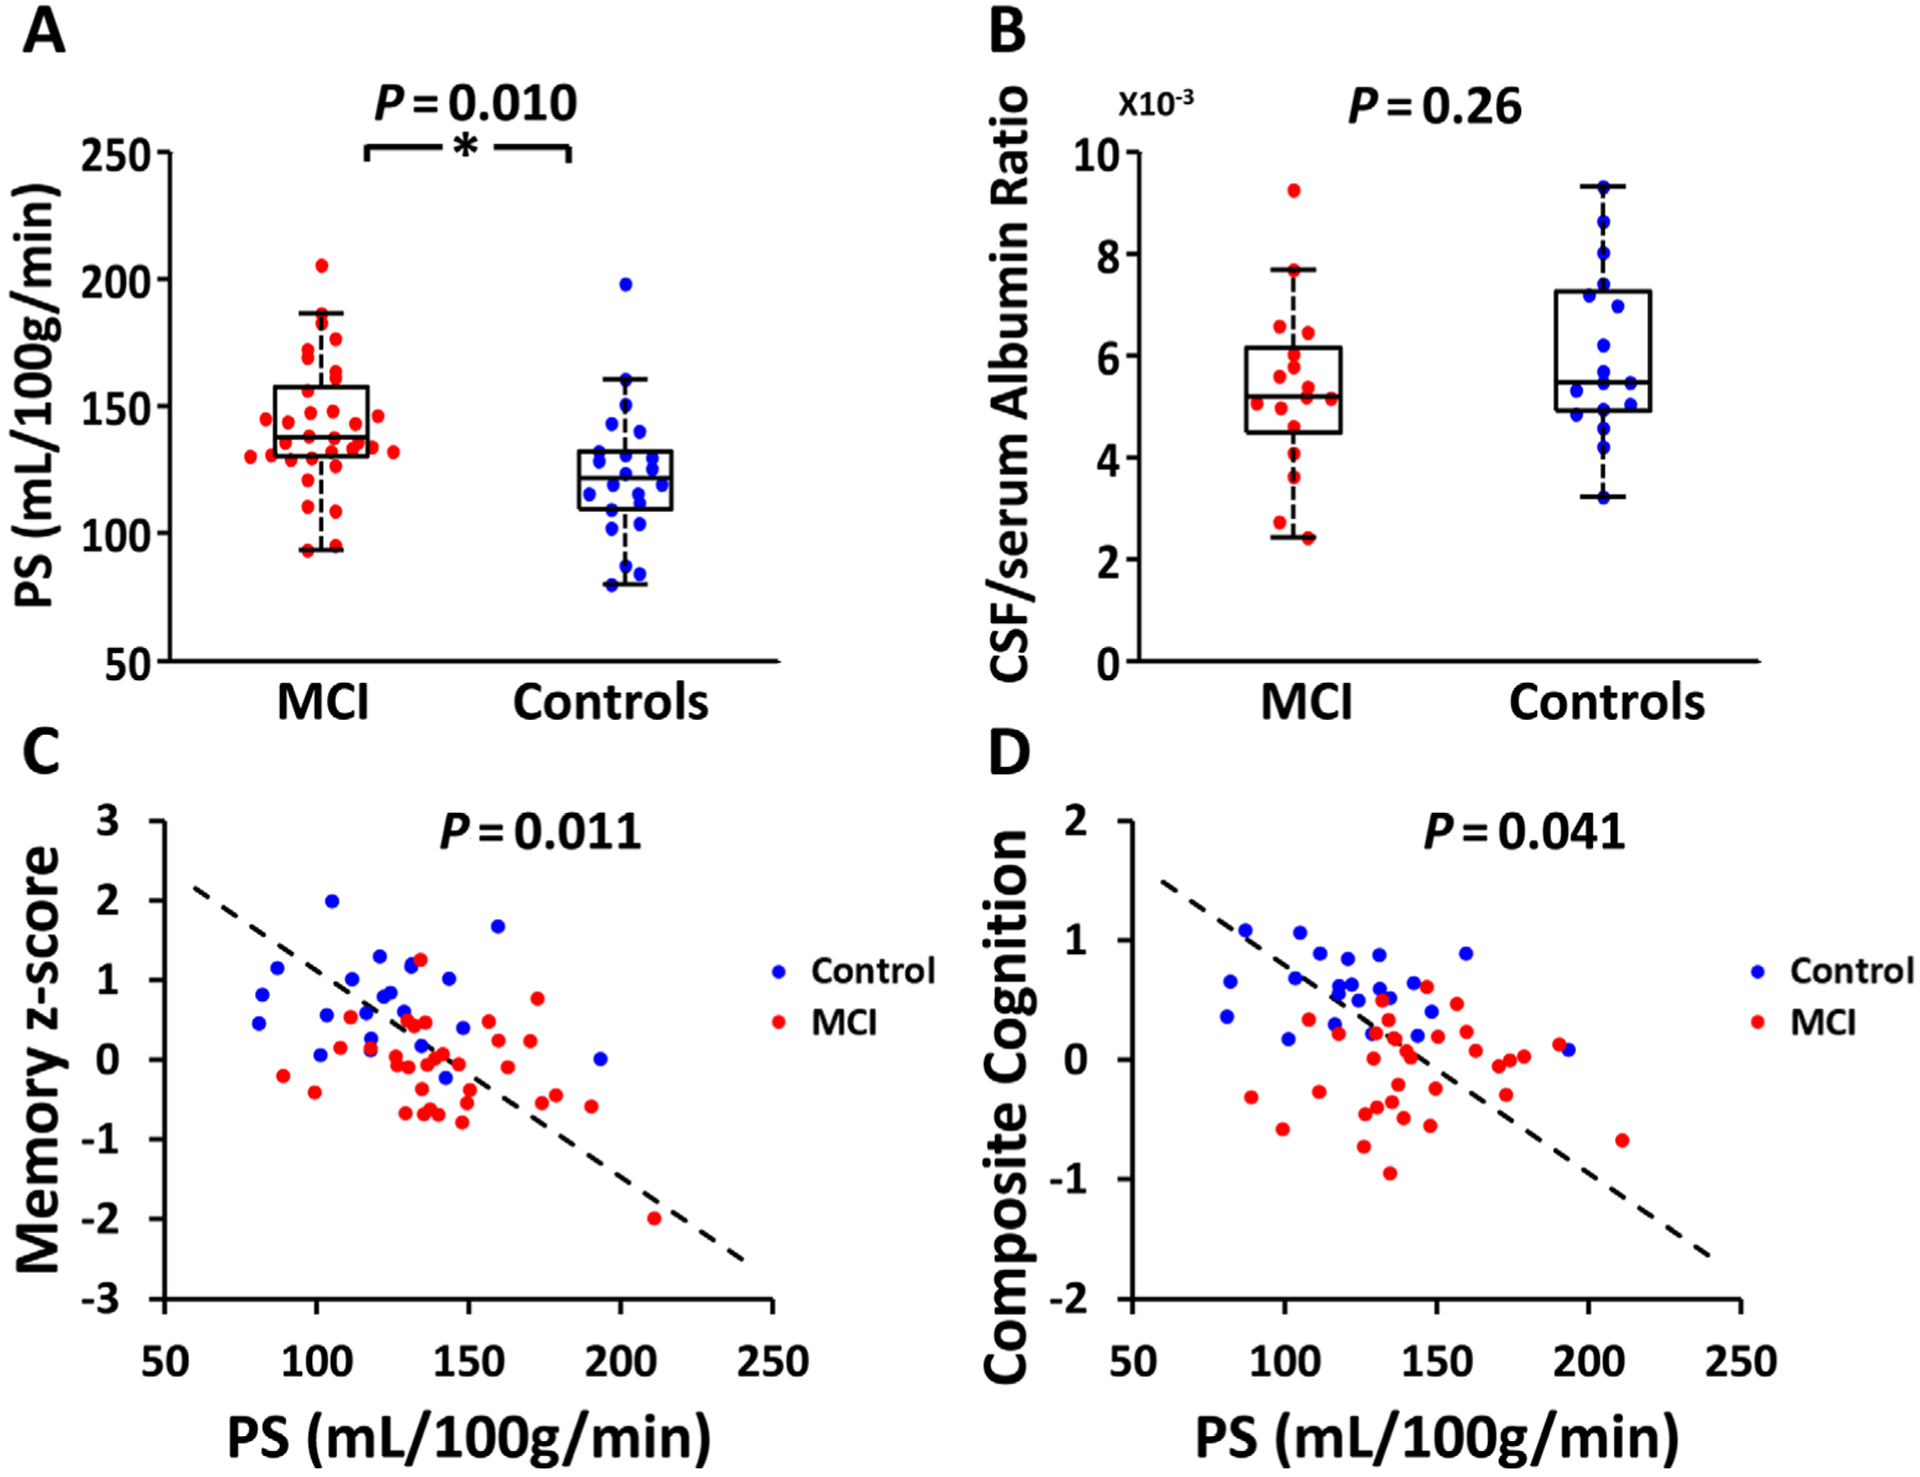
Relationship of blood–brain barrier permeability with clinical diagnosis cognition. (A) Box plot of water permeability–surface area product (PS) between mild cognitive impairment (MCI) and control groups. (*P < 0.05). (B) Box plot of cerebrospinal fluid (CSF)/serum albumin ratio between MCI and control groups. (C) Scatter plot between water PS and memory z score. (D) Scatter plot between water PS and composite cognition.
Figure 1B illustrates the CSF collection and assay procedures. CSF/serum albumin ratio was found to be 5.36 ± 1.70 (mg/dl)/(g/dl) and 5.99 ± 1.64 (mg/dl)/(g/dl) in MCI and controls, respectively. Figure 2B shows a box plot of the data. There was no difference between the 2 groups (95% CI = −1.94 to 0.54 [mg/dl]/[g/dl], p = 0.26).
Relationship between BBB Permeability to Water and Albumin and Cognitive Performance
Table 2 summarizes the relationship between BBB permeability and cognition. After adjusting for age, sex, and education, regression analysis revealed a significant inverse association between water PS and episodic memory (β = −0.0108, 95% CI = −0.018 to −0.0039, p = 0.011; see Fig 2C) and composite score (β = −0.0051, 95% CI = −0.0099 to −0.00022, p = 0.041; see Fig 2D). Individuals with a higher PS, that is, BBB leakage, had poorer cognitive performance. For the case of episodic memory, each 93ml/100g/min increase in PS will correspond to a decrease in memory performance by 1 standard deviation. Water PS also has a trend of negative association with language score (β = −0.0065, 95% CI = −0.012 to −0.0014, p = 0.053). However, it was not associated with other cognitive tests and domains, including MoCA (β = −0.017, 95% CI = −0.040 to 0.0066, p = 0.16), executive function (β = −0.0025, 95% CI = −0.0091 to 0.0042, p = 0.92), and processing speed (β = −0.00055, 95% CI = −0.0085 to 0.0074, p = 1.00), although in all results the coefficient values were negative (ie, higher PS corresponding to poorer cognitive scores).
TABLE 2.
Relationship between Blood–Brain Barrier Permeability to Water (PS) and Cognition
| Cognition | Coefficient for PS | 95% CI | Corrected CI | Uncorrected p | Corrected p |
|---|---|---|---|---|---|
| Episodic memory | −0.011 | −0.018 to −0.0039 | −0.020 to −0.0019 | 0.0028 | 0.011 |
| Executive function | −0.0025 | −0.0091 to 0.0042 | −0.011 to 0.0061 | 0.46 | 0.92 |
| Language | −0.0065 | −0.012 to −0.0014 | −0.013 to 0.000082 | 0.014 | 0.053 |
| Processing speed | −0.00055 | −0.0085 to 0.0074 | −0.011 to 0.0098 | 0.89 | 1.00 |
| Composite score | −0.0051 | −0.0099 to −0.00022 | −0.0099 to −0.00022 | 0.041 | 0.041 |
| MoCA score | −0.017 | −0.040 to 0.0066 | −0.040 to 0.0066 | 0.16 | 0.16 |
The coefficient of the relationship is written in the unit of z score per ml/100g/min.
CI = confidence interval; MoCA = Montreal Cognitive Assessment; PS = permeability–surface area product.
No significant associations between CSF/serum albumin ratio and domain or global cognitive scores were found, suggesting that BBB permeability to large molecules is less sensitive in predicting cognitive function.
Relationship between BBB Permeability and Alzheimer Pathology
Figure 3A shows a scatter plot between water PS and CSF Aβ42/Aβ40 ratio. Linear regression revealed that higher water PS, that is, worse BBB breakdown, was associated with lower CSF Aβ42/Aβ40 ratio (β = −0.00027, 95% CI = −0.00045 to −0.000097, p = 0.0037). Note that lower CSF Aβ42 corresponds to higher brain Aβ42.52 Thus, these data suggest that higher BBB permeability to water corresponds to more amyloid burden in the brain. Similarly, higher water PS was associated with a higher CSF ptau level (β = 0.45, 95% CI = 0.11–0.79, p = 0.012; see Fig 3B). There was not an association between water PS and total tau level in the CSF (β = 0.45, 95% CI = −0.38 to 1.28, p = 0.27).
FIGURE 3:
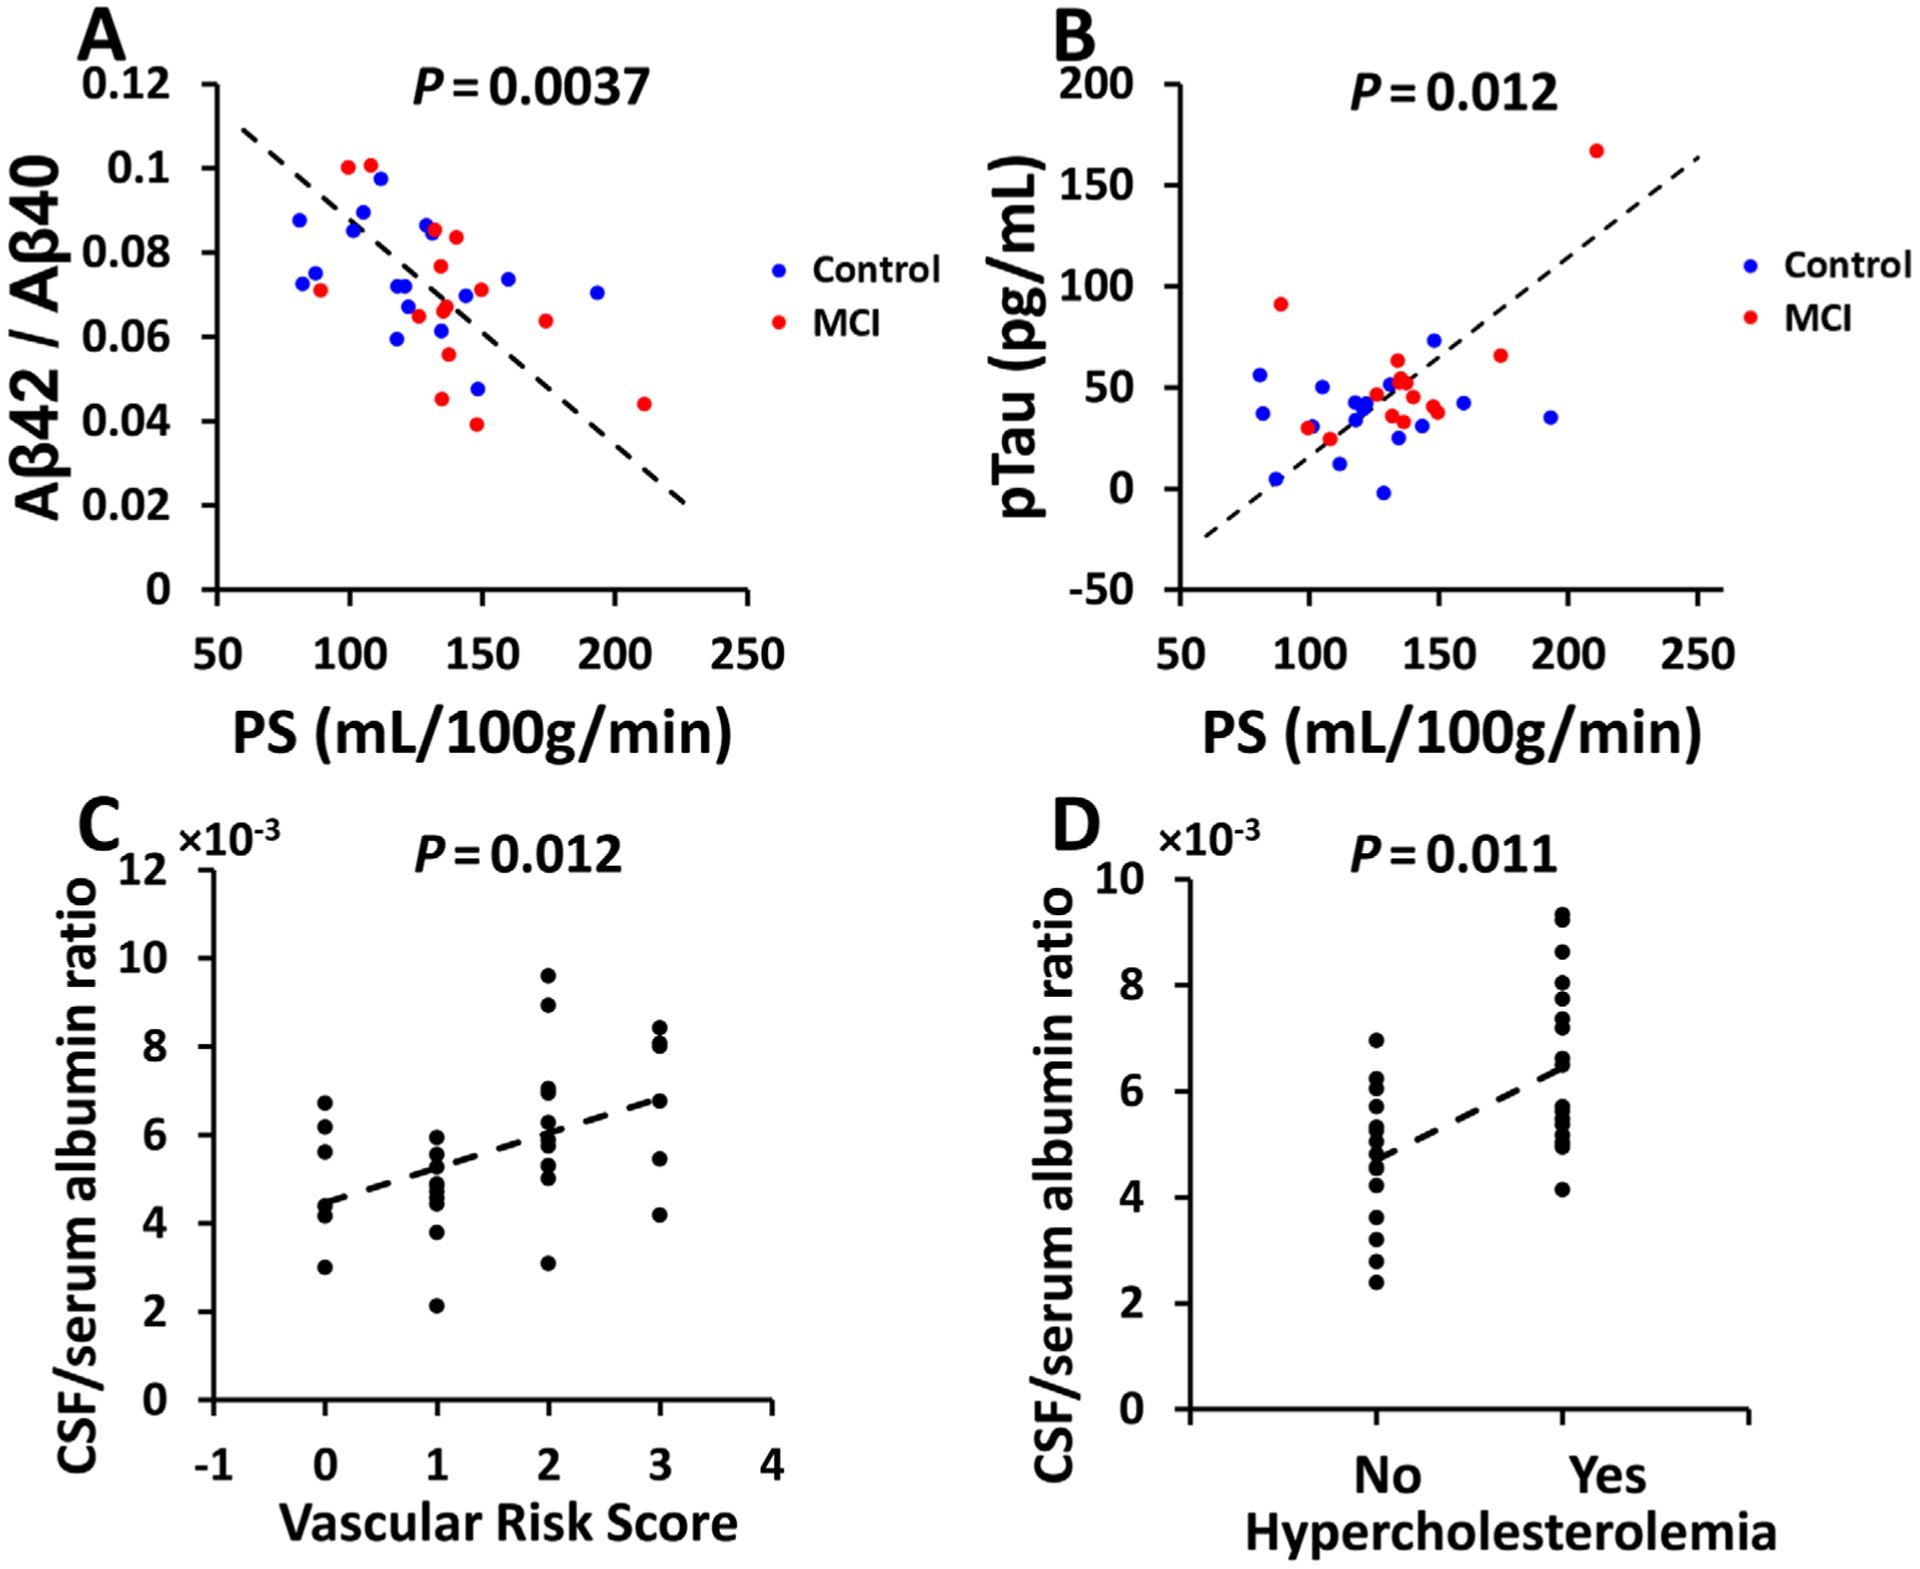
Relationship of blood–brain barrier permeability to Alzheimer disease pathology and vascular risks. (A) Scatter plot between permeability–surface area product (PS) and cerebrospinal fluid (CSF) Aβ42/Aβ40 level. (B) Scatter plot between PS and CSF ptau level. (C) Scatter plot between CSF/serum albumin ratio and vascular risk score. (D) Scatter plot between CSF/serum albumin ratio and hypercholesterolemia. MCI = mild cognitive impairment.
There was not an association between CSF/serum albumin ratio and any of the AD pathological markers, including Aβ42/Aβ40 ratio (β = 0.00060, 95% CI = −0.0029 to 0.0041, p = 0.73), total tau (β = 1.68, 95% CI = −12.67 to 16.02, p = 0.81), and ptau (β = −2.15, 95% CI = −8.59 to 4.30, p = 0.50).
Comparisons of AD markers between MCI and control participants showed a significant difference in ptau (β = 22.94, 95% CI = 1.49–44.38, p = 0.037), but no differences in Aβ42/Aβ40 ratio or total tau (Fig 4A–C). When including the additional participants that provided CSF samples, Aβ42/Aβ40 ratio or total tau also showed a trend of difference, whereas ptau remained different (see Fig 4D–F).
FIGURE 4:
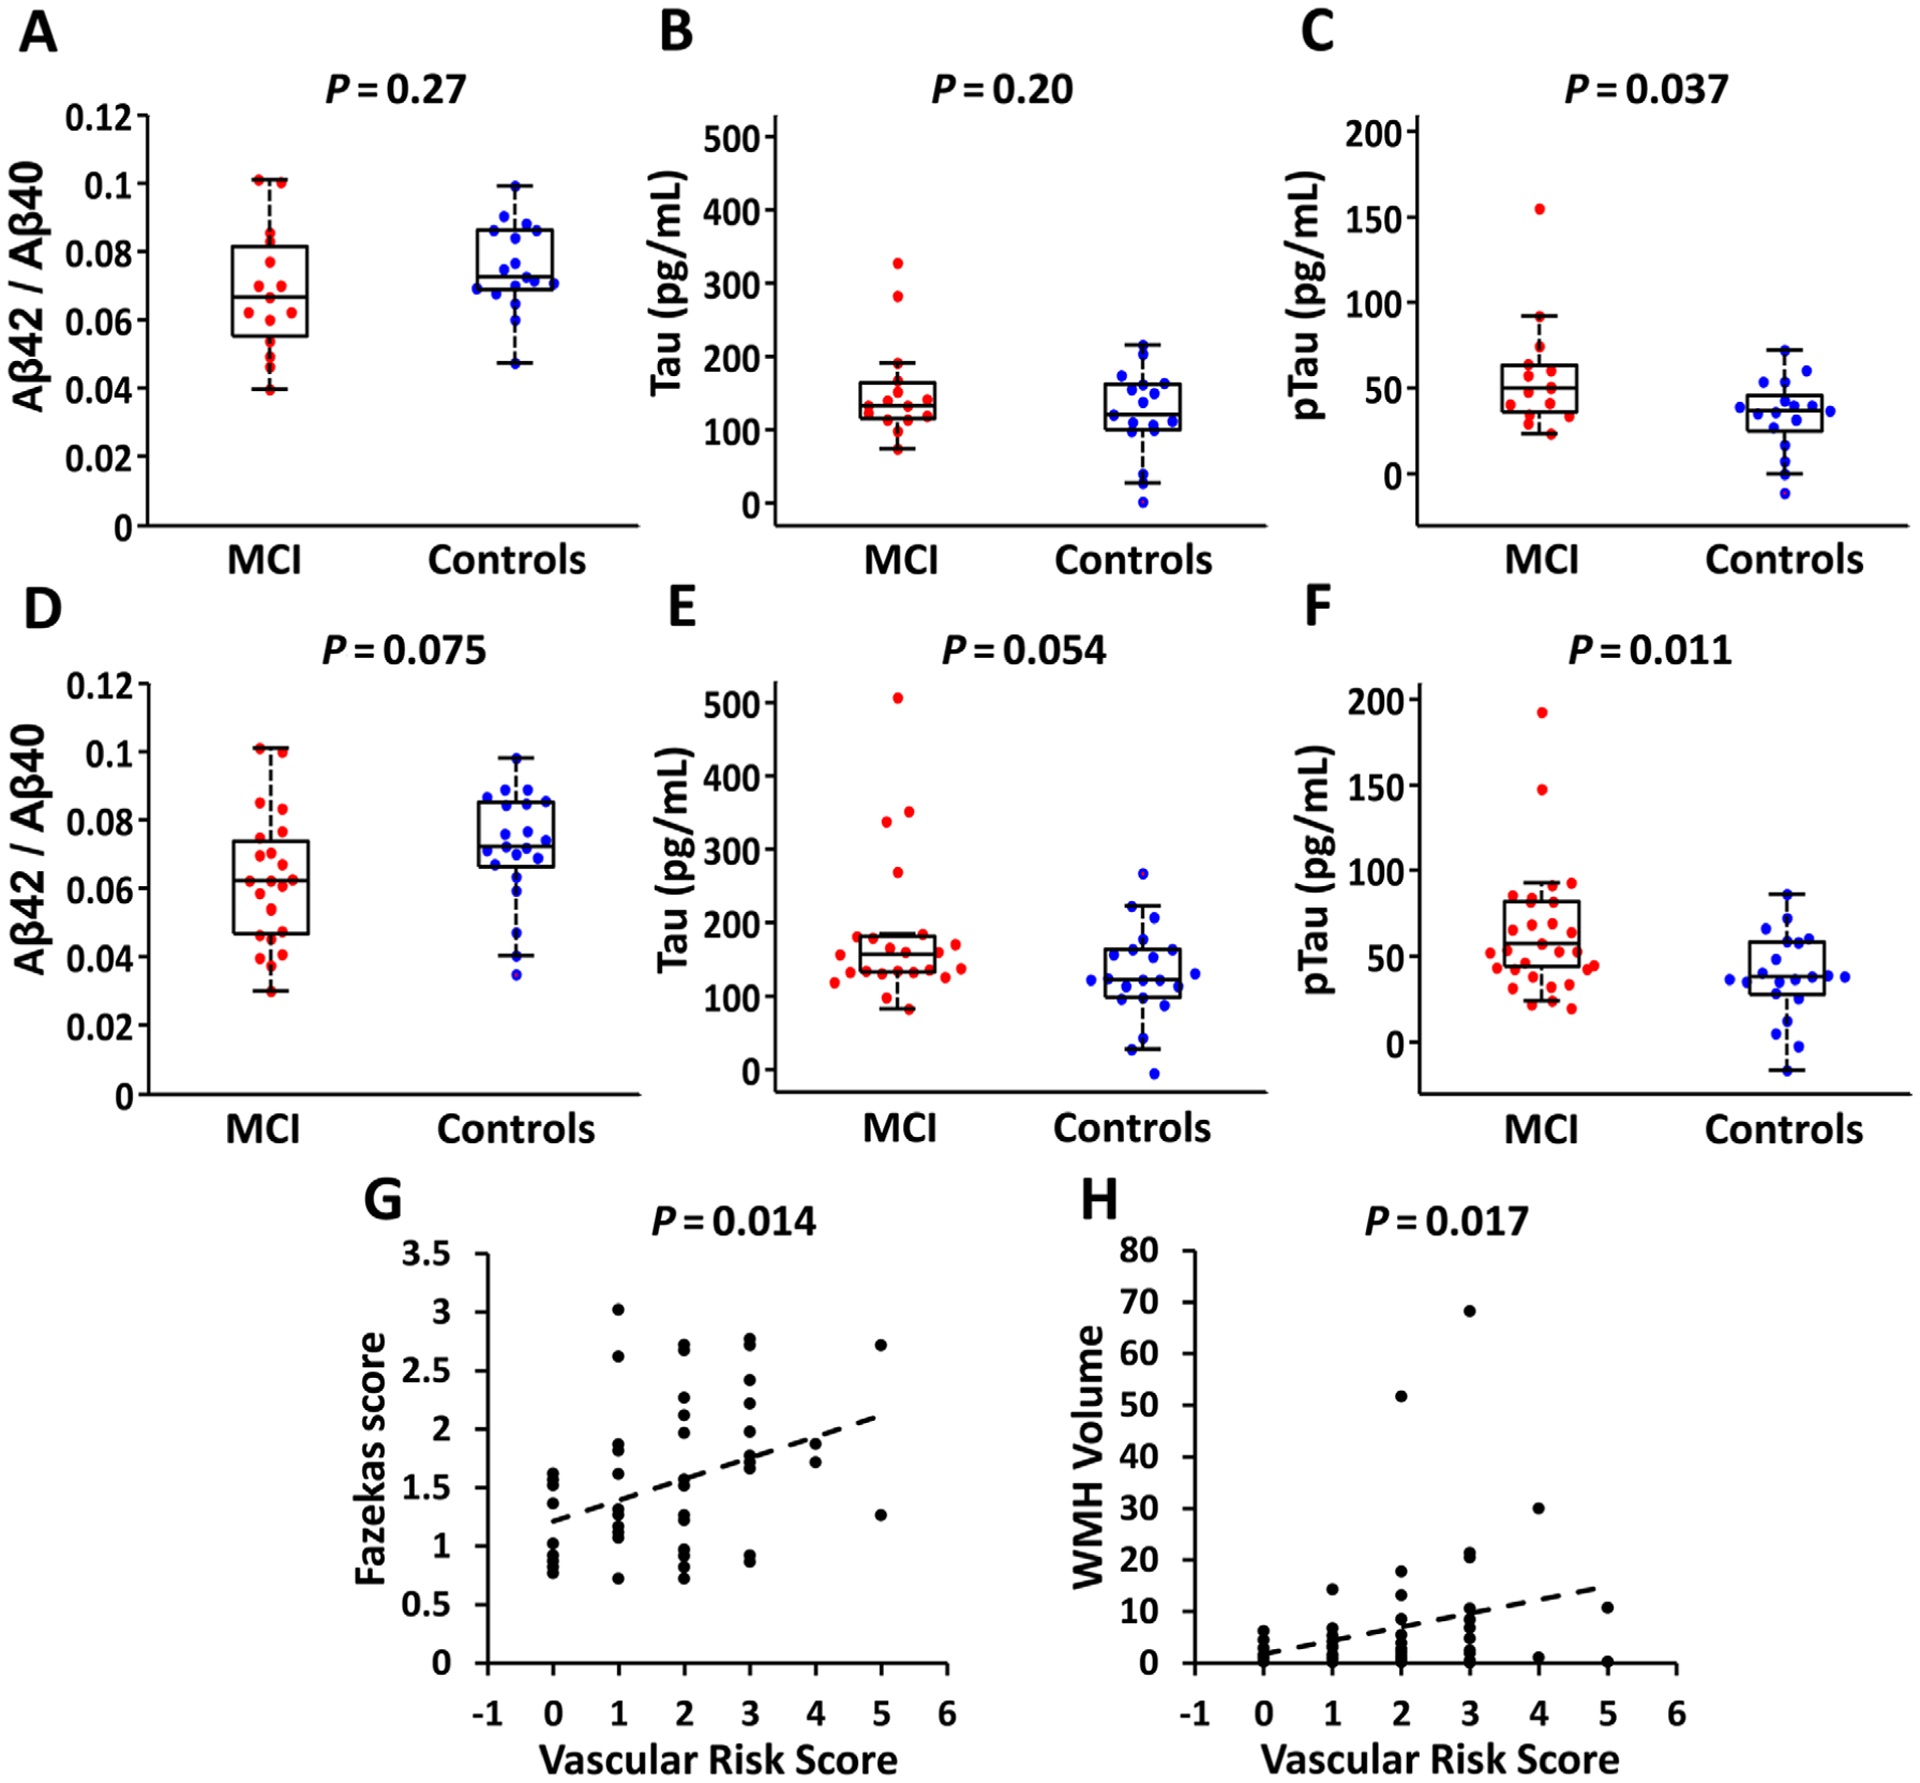
Summary of Alzheimer disease (AD) markers, vascular risks, and white matter hyperintensities (WMH) in the participants. (A–C) Box plots of AD pathological markers (Aβ42/Aβ40, tau, and ptau) between mild cognitive impairment (MCI) and control groups who received water extraction with phase contrast arterial spin tagging (WEPCAST) magnetic resonance imaging (MRI; n = 32, 15 MCI and 17 controls). (D–F) Box plots of AD pathological markers between MCI and control groups after including additional participants who provided cerebrospinal fluid samples but did not receive WEPCAST MRI (n = 44, 23 MCI and 21 controls). (G) Scatter plot between vascular risk factors and Fazekas score in the WEPCAST cohort. (H) Scatter plot between vascular risk factors and WMH volume in the WEPCAST cohort.
Comparison of CSF NFL between participant groups showed no difference between MCI and controls in the subjects who received WEPCAST BBB assessment (see Table 1). However, when including the additional participants who provided CSF but did not receive WEPCAST, MCI participants revealed significantly higher NFL than controls (MCI, 2,988.82 ± 1,223.90pg/ml; control, 2,356.93 ± 825.35pg/ml, β = 610.50, 95% CI = 6.86–1,214.14, p = 0.048). We did not find a significant association between CSF NFL levels and PS (β = −3.26, 95% CI = −12.74 to 6.23, p = 0.49) or CSF/serum albumin ratio (β = −86.04, 95% CI = −74.93 to 247.03, p = 0.74).
Relationship between BBB Permeability and Vascular Risks
Linear regression showed no significant associations between water PS and the composite VRS or any of the domain vascular risk factors.
Next, we examined the relationship between BBB permeability to albumin and vascular risk factors. It was found that CSF/serum albumin ratio was significantly associated with the composite VRS (β = 0.79, 95% CI = 0.19–1.39, p = 0.012; see Fig 3C) and the domain of hypercholesterolemia (β = 1.74, 95% CI = 0.67–2.80, p = 0.011; see Fig 3D). CSF/serum albumin ratio was not associated with the other domain vascular risks (Table 3).
TABLE 3.
Relationship between Blood–Brain Barrier Permeability to Albumin (CSF/Serum Albumin Ratio) and Vascular Risks
| Vascular Risks | Coefficient for Vascular Risks | 95% CI | Corrected CI | Uncorrected p | Corrected p |
|---|---|---|---|---|---|
| Hypertension | 0.83 | −0.43 to 2.09 | −0.86 to 2.53 | 0.19 | 0.65 |
| Hypercholesterolemia | 1.74 | 0.67 to 2.80 | 0.30 to 3.17 | 0.0023 | 0.011 |
| Diabetes | N/Aa | N/A | N/A | N/A | N/A |
| Smoking | 0.39 | −0.96 to 1.74 | −1.43 to 2.21 | 0.56 | 0.96 |
| Body mass index | −0.20 | −2.07 to 1.67 | −2.72 to 2.31 | 0.83 | 1.00 |
| Vascular risk score | 0.79 | 0.19 to 1.39 | 0.19 to 1.39 | 0.012 | 0.012 |
None of the diabetic participants received LP due to their use of anticoagulants such as warfarin and dabigatran or antiplatelets such as Plavix, which represented a contraindication to LP. Thus, the association of CSF/serum album ratio with diabetes was not studied.
CI = confidence interval; CSF = cerebrospinal fluid; LP = lumbar puncture; N/A = not applicable.
We also assessed the relationship between BBB permeability and WMH. No significant association was found between Fazekas score and water PS (β = −0.0010, 95% CI = −0.0079 to 0.0059, p = 0.78) or CSF/serum albumin ratio (β = 0.054, 95% CI = −0.087 to 0.20, p = 0.44). Similarly, no significant association was found between WMH volume and water PS (β = 0.077, 95% CI = −0.028 to 0.18, p = 0.15) or CSF/serum albumin ratio (β = 0.43, 95% CI = −2.22 to 3.09, p = 0.74). However, we found a positive association between Fazekas score and VRS (β = 0.18, 95% CI = 0.039–0.32, p = 0.014; see Fig 4G), and between WMH volume and VRS (β = 2.74, 95% CI = 0.51–4.96, p = 0.017; see Fig 4H).
Relationship between BBB Permeability and APOE4 Status
Linear regression showed that, after correcting for age and sex, APOE4 status was not associated with either PS (β = 4.13, 95% CI = −9.36 to 17.62, p = 0.54) or CSF/serum albumin ratio (β = −0.27, 95% CI = −1.23 to 0.70, p = 0.58). When adding APOE4 status as a covariate, the abovementioned relationship between BBB permeability and participant diagnostic group remained.
Discussion
In this study, we investigated BBB breakdown on 2 spatial scales in older individuals with MCI who have varying degrees of AD pathology and vascular risks. Our findings provide early evidence that, relative to cognitively normal subjects, BBB in MCI patients manifested an increased permeability to small molecules such as water but was no more permeable to large molecules such as albumin. BBB permeability to water was found to be related to AD markers of CSF Aβ and ptau. On the other hand, BBB permeability to albumin was found to be related to vascular risk factors, in particular hypercholesterolemia, but was not related to AD pathology. Moreover, BBB permeability to small molecules, but not to large molecules, was found to be predictive of cognitive function.
Disrupted BBB in cognitive impairment and dementia has been shown by recent literature.2,5,6,8,9,11 However, the mechanism and relationship of BBB breakdown to AD and vascular risks are still poorly understood and somewhat controversial. In this study, we showed that BBB breakdown is a multifaceted manifestation and that both AD and vascular risks can cause BBB disruption, but on different molecular scales. AD pathology is accompanied by increased BBB permeability to small molecules such as water. Vascular risk factors, on the other hand, are associated with elevated BBB permeability to larger molecules such as albumin. We note that BBB permeability to small and large molecules could be physiologically decoupled. For example, as shown in an illustration in Figure 5B, minor but pervasive BBB breakdown in brain capillaries would result in increased permeability to water but not albumin, as large molecules like albumin are unable to leak through the minor breakdown. On the other hand, as illustrated in Figure 5C, sparse but severe BBB damage in a small fraction (one-fifth in the example illustrated, but it could be fewer) of capillaries would result in leakage of large molecules such as albumin into parenchyma and CSF, but will have negligible impact on BBB permeability to water, because healthy BBB is already highly permeable to water and the leakage points are only present in a small subset of capillaries. Therefore, it appears that vascular risks cause isolated but severe BBB damage, whereas AD is accompanied by minor but widespread BBB breakdown. It should be pointed out that the sample size of participants with CSF/serum albumin ratio is relatively small due to the need to perform LP. Thus, the level of statistical significance was lower than some of the previous studies.3,20,53–55 However, other studies with larger sample sizes have confirmed that vascular dementia patients had significantly higher CSF/serum albumin ratios compared to non–vascular-type dementia patients.3,20,53–55 Those studies also observed a lack of association between albumin permeability and AD biomarkers.53,55
FIGURE 5:
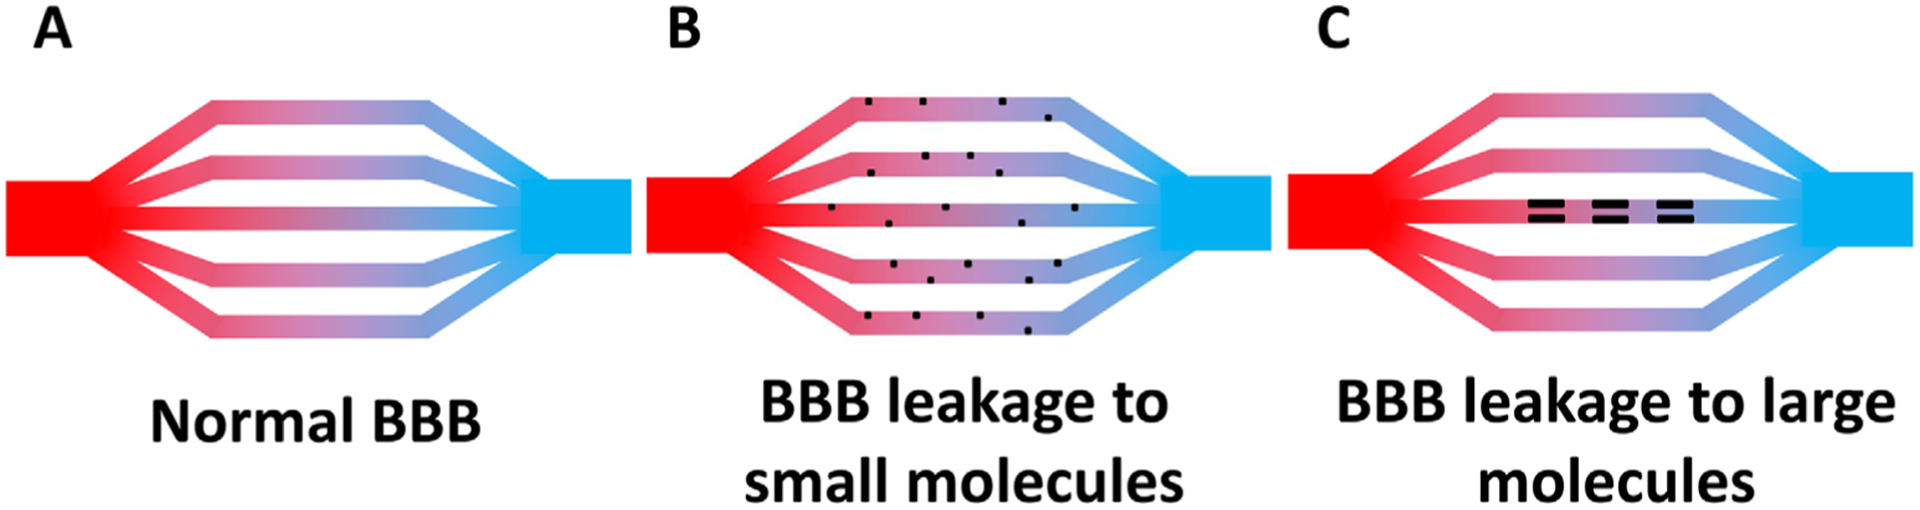
An illustration that blood–brain barrier (BBB) leakage can be specific to small and large molecules. (A) Normal BBB. (B) BBB that is leaky to small molecules, for example water, but not to large molecules. Black dots indicate leakage points. Numerous small leakages are present throughout the capillaries. (C) BBB that is leaky to large molecules, for example albumin. A limited number of leakage points are present, causing slow leaking of albumin, but their impact on water permeability is small because the leakage points are only present in a subset of capillaries (in this example, one-fifth).
Other potential reasons could explain the findings in the current study. The increased BBB permeability to water may also represent the dysregulation of the aquaporin-4 (AQP4) channels on the astrocyte endfeet.56 Both increased AQP4 expression and reduction of AQP4 polarization have been reported in aging and AD, which may have different effects on the water permeability.12,57,58 Future studies are needed to further understand the specific role of AQP4 in BBB dysfunction in dementia. Similarly, albumin in the plasma can enter the central nervous system (CNS) not only by crossing the BBB to the interstitial fluid and CSF, but also by directly crossing the blood–CSF barrier (BCSFB).59 Thus, the CSF/serum albumin ratio may also provide information on the BCSFB, which is a topic under intensive investigation in the aging and dementia field.60,61
Although the present work is a cross-sectional study, it is useful to discuss the potential causal relationship between BBB function and other pathological processes in cognitive impairment. Given the observed association between BBB disruption and Aβ42 and that amyloid accumulation is an early process in the pathogenesis of AD, it is plausible that amyloid deposition may cause damage to the BBB, such as diminished endothelial transport, loss of tight junction integrity, and pericyte and astrocyte degeneration, which results in BBB leakage.4,26,62,63 Additionally, amyloid may be deposited in cerebral vessels, causing cerebral amyloid angiopathy,64 which may cause further BBB damage. As an alternative hypothesis, it is also possible that BBB dysfunction is an upstream process for Aβ accumulation in CNS,21,65 which would suggest that Aβ accumulation partly reflects an immune response of the brain.21 Future studies are needed that examine BBB permeability in AD/MCI/high-risk patients with a variety of severities to elucidate the temporal relationship between BBB damage and AD pathological markers.
Our study has several limitations. First, the water permeability MRI technique is a global method with no regional information. Future studies are needed to develop a more region-specific technique for water BBB permeability measurement. Additionally, it should be pointed out that the technique used in this study, WEPCAST MRI, was only recently developed32,33; thus, further experience from more investigators/laboratories is needed to confirm these findings. Validation with invasive methods in animal models is also desirable. Second, this study has not collected longitudinal data; thus, we do not know whether the BBB disruption in older individuals can predict cognitive decline, which remains to be explored in future studies. Third, only a subset of participants received CSF-based measurements, which may have led to a lower sensitivity in the statistical analyses. Future studies in larger populations are needed to further verify the sensitivity of WEPCAST in assisting the diagnosis of AD.
In conclusion, this study assessed BBB breakdown in MCI patients on 2 molecular scales. We provided early evidence that MCI patients had higher BBB permeability compared with controls. Increased permeability to small molecules such as water was associated with lower Aβ42 and high ptau in CSF and poorer cognitive function. On the other hand, BBB permeability change to larger molecules such as albumin was associated with vascular risk factors. These findings suggested that BBB breakdown is related to both AD and vascular risks, but their effects can be differentiated by spatial scales.
Acknowledgments
The work is supported by NIH grants R01 AG064792 from National Institute on Aging (NIA), R01 AG071515 from NIA, R01 NS106711 from National Institute of Neurological Disorders and Stroke (NINDS), R01 NS106702 from NINDS, P41 EB015909 from National Institute of Biomedical Imaging and Bioengineering (NIBIB), and S10 OD021648 from Office of the Director (OD), and American Heart Association grant 19PRE34380371.
Footnotes
Potential Conflicts of Interest
Nothing to report.
References
- 1.https://www.who.int/news-room/fact-sheets/detail/dementia. Dementia; Last acessed June 3, 2021.
- 2.Erickson MA, Banks WA. Blood-brain barrier dysfunction as a cause and consequence of Alzheimer’s disease. J Cereb Blood Flow Metab 2013;33:1500–1513. [DOI] [PMC free article] [PubMed] [Google Scholar]
- 3.Farrall AJ, Wardlaw JM. Blood-brain barrier: ageing and microvascular disease—systematic review and meta-analysis. Neurobiol Aging 2009;30:337–352. [DOI] [PubMed] [Google Scholar]
- 4.Zlokovic BV. Neurovascular mechanisms of Alzheimer’s neurodegeneration. Trends Neurosci 2005;28:202–208. [DOI] [PubMed] [Google Scholar]
- 5.Nation DA, Sweeney MD, Montagne A, et al. Blood–brain barrier breakdown is an early biomarker of human cognitive dysfunction. Nat Med 2019;25:270–276. [DOI] [PMC free article] [PubMed] [Google Scholar]
- 6.Montagne A, Barnes SR, Sweeney MD, et al. Blood-brain barrier breakdown in the aging human hippocampus. Neuron 2015;85: 296–302. [DOI] [PMC free article] [PubMed] [Google Scholar]
- 7.Milikovsky DZ, Ofer J, Senatorov VV Jr, et al. Paroxysmal slow cortical activity in Alzheimer’s disease and epilepsy is associated with blood-brain barrier dysfunction. Sci Transl Med 2019;11:eaaw8954. [DOI] [PubMed] [Google Scholar]
- 8.Shao X, Ma SJ, Casey M, et al. Mapping water exchange across the blood-brain barrier using 3D diffusion-prepared arterial spin labeled perfusion MRI. Magn Reson Med 2019;81:3065–3079. [DOI] [PMC free article] [PubMed] [Google Scholar]
- 9.van de Haar HJ, Burgmans S, Jansen JF, et al. Blood-brain barrier leakage in patients with early Alzheimer disease. Radiology 2016; 281:527–535. [DOI] [PubMed] [Google Scholar]
- 10.Wengler K, Bangiyev L, Canli T, et al. 3D MRI of whole-brain water permeability with intrinsic diffusivity encoding of arterial labeled spin (IDEALS). Neuroimage 2019;189:401–414. [DOI] [PubMed] [Google Scholar]
- 11.Dickie BR, Vandesquille M, Ulloa J, et al. Water-exchange MRI detects subtle blood-brain barrier breakdown in Alzheimer’s disease rats. Neuroimage 2019;184:349–358. [DOI] [PubMed] [Google Scholar]
- 12.Ohene Y, Harrison IF, Evans PG, et al. Increased blood-brain barrier permeability to water in the aging brain detected using noninvasive multi-TE ASL MRI. Magn Reson Med 2021;85:326–333. [DOI] [PMC free article] [PubMed] [Google Scholar]
- 13.Montagne A, Nation DA, Sagare AP, et al. APOE4 leads to blood-brain barrier dysfunction predicting cognitive decline. Nature 2020; 581:71–76. [DOI] [PMC free article] [PubMed] [Google Scholar]
- 14.Abbott NJ, Ronnback L, Hansson E. Astrocyte-endothelial interactions at the blood-brain barrier. Nat Rev Neurosci 2006;7:41–53. [DOI] [PubMed] [Google Scholar]
- 15.Slemmon JR, Hughes CM, Campbell GA, Flood DG. Increased levels of hemoglobin-derived and other peptides in Alzheimer’s disease cerebellum. J Neurosci 1994;14:2225–2235. [DOI] [PMC free article] [PubMed] [Google Scholar]
- 16.Wisniewski HM, Kozlowski PB. Evidence for blood-brain barrier changes in senile dementia of the Alzheimer type (SDAT). Ann N Y Acad Sci 1982;396:119–129. [DOI] [PubMed] [Google Scholar]
- 17.Alafuzoff I, Adolfsson R, Bucht G, Winblad B. Albumin and immunoglobulin in plasma and cerebrospinal fluid, and blood-cerebrospinal fluid barrier function in patients with dementia of Alzheimer type and multi-infarct dementia. J Neurol Sci 1983;60:465–472. [DOI] [PubMed] [Google Scholar]
- 18.Elovaara I, Icen A, Palo J, Erkinjuntti T. CSF in Alzheimer’s disease. Studies on blood-brain barrier function and intrathecal protein synthesis. J Neurol Sci 1985;70:73–80. [DOI] [PubMed] [Google Scholar]
- 19.Hampel H, Kotter HU, Moller HJ. Blood-cerebrospinal fluid barrier dysfunction for high molecular weight proteins in Alzheimer disease and major depression: indication for disease subsets. Alzheimer Dis Assoc Disord 1997;11:78–87. [DOI] [PubMed] [Google Scholar]
- 20.Skoog I, Wallin A, Fredman P, et al. A population study on blood-brain barrier function in 85-year-olds: relation to Alzheimer’s disease and vascular dementia. Neurology 1998;50:966–971. [DOI] [PubMed] [Google Scholar]
- 21.Kumar DK, Choi SH, Washicosky KJ, et al. Amyloid-beta peptide protects against microbial infection in mouse and worm models of Alzheimer’s disease. Sci Transl Med 2016;8:340ra72. [DOI] [PMC free article] [PubMed] [Google Scholar]
- 22.Ashraf GM, Chibber S, Zaidi SK, et al. Recent updates on the association between Alzheimer’s disease and vascular dementia. Med Chem 2016;12:226–237. [DOI] [PubMed] [Google Scholar]
- 23.Diaz-Arrastia R Hyperhomocysteinemia: a new risk factor for Alzheimer disease? Arch Neurol 1998;55:1407–1408. [DOI] [PubMed] [Google Scholar]
- 24.Rodrigue KM, Rieck JR, Kennedy KM, et al. Risk factors for beta-amyloid deposition in healthy aging: vascular and genetic effects. JAMA Neurol 2013;70:600–606. [DOI] [PMC free article] [PubMed] [Google Scholar]
- 25.Zlokovic BV. The blood-brain barrier in health and chronic neurodegenerative disorders. Neuron 2008;57:178–201. [DOI] [PubMed] [Google Scholar]
- 26.Yamazaki Y, Kanekiyo T. Blood-brain barrier dysfunction and the pathogenesis of Alzheimer’s disease. Int J Mol Sci 2017;18:1965. [DOI] [PMC free article] [PubMed] [Google Scholar]
- 27.Freeze WM, Jacobs HIL, Schreuder F, et al. Blood-brain barrier dysfunction in small vessel disease related intracerebral hemorrhage. Front Neurol 2018;9:926. [DOI] [PMC free article] [PubMed] [Google Scholar]
- 28.Starr JM, Wardlaw J, Ferguson K, et al. Increased blood-brain barrier permeability in type II diabetes demonstrated by gadolinium magnetic resonance imaging. J Neurol Neurosurg Psychiatry 2003; 74:70–76. [DOI] [PMC free article] [PubMed] [Google Scholar]
- 29.Wallin A, Sjogren M, Edman A, et al. Symptoms, vascular risk factors and blood-brain barrier function in relation to CT white-matter changes in dementia. Eur Neurol 2000;44:229–235. [DOI] [PubMed] [Google Scholar]
- 30.van Nieuwenhuizen KM, Hendrikse J, Klijn CJM. New microbleed after blood–brain barrier leakage in intracerebral haemorrhage. BMJ Case Rep 2017;2017:bcr2016218794. [DOI] [PMC free article] [PubMed] [Google Scholar]
- 31.Wardlaw JM, Doubal F, Armitage P, et al. Lacunar stroke is associated with diffuse blood-brain barrier dysfunction. Ann Neurol 2009; 65:194–202. [DOI] [PubMed] [Google Scholar]
- 32.Lin Z, Li Y, Su P, et al. Non-contrast MR imaging of blood-brain barrier permeability to water. Magn Reson Med 2018;80:1507–1520. [DOI] [PMC free article] [PubMed] [Google Scholar]
- 33.Lin Z, Jiang D, Liu D, et al. Noncontrast assessment of blood-brain barrier permeability to water: shorter acquisition, test-retest reproducibility, and comparison with contrast-based method. Magn Reson Med 2021;86:143–156. [DOI] [PMC free article] [PubMed] [Google Scholar]
- 34.Albert MS, DeKosky ST, Dickson D, et al. The diagnosis of mild cognitive impairment due to Alzheimer’s disease: recommendations from the National Institute on Aging-Alzheimer’s Association work-groups on diagnostic guidelines for Alzheimer’s disease. Alzheimers Dement 2011;7:270–279. [DOI] [PMC free article] [PubMed] [Google Scholar]
- 35.Wechsler D WMS-R: Wechsler memory scale–revised. San Antonio, TX: Psychological Corporation, 1987. [Google Scholar]
- 36.Brandt J, Benedict R. Hopkins verbal learning test–revised, professional manual. Psychological Assessment Resources: Lutz, FL, 2001. [Google Scholar]
- 37.Reitan RM. The relation of the trail making test to organic brain damage. J Consult Psychol 1955;19:393–394. [DOI] [PubMed] [Google Scholar]
- 38.Wechsler D WAIS-R manual: Wechsler adult intelligence scale–revised manual. New York, NY: Psychological Corporation, 1981. [Google Scholar]
- 39.Stroop JR. Studies of interference in serial verbal reactions. J Exp Psychol 1935;18:643–662. [Google Scholar]
- 40.Ivanova I, Salmon DP, Gollan TH. The multilingual naming test in Alzheimer’s disease: clues to the origin of naming impairments. J Int Neuropsychol Soc 2013;19:272–283. [DOI] [PMC free article] [PubMed] [Google Scholar]
- 41.Benton A, Hamsher K. Multilingual aphasia examination manual. Iowa City, IA: University of Iowa, 1976. [Google Scholar]
- 42.Crone PB. Counting of tubercle bacilli. Mon Bull Minist Health Public Health Lab Serv 1963;22:44–46. [PubMed] [Google Scholar]
- 43.Peng SL, Su P, Wang FN, et al. Optimization of phase-contrast MRI for the quantification of whole-brain cerebral blood flow. J Magn Reson Imaging 2015;42:1126–1133. [DOI] [PMC free article] [PubMed] [Google Scholar]
- 44.Alsop DC, Detre JA, Golay X, et al. Recommended implementation of arterial spin-labeled perfusion MRI for clinical applications: a consensus of the ISMRM perfusion study group and the European consortium for ASL in dementia. Magn Reson Med 2015;73: 102–116. [DOI] [PMC free article] [PubMed] [Google Scholar]
- 45.Lu H, Clingman C, Golay X, van Zijl PC. Determining the longitudinal relaxation time (T1) of blood at 3.0 tesla. Magn Reson Med 2004;52: 679–682. [DOI] [PubMed] [Google Scholar]
- 46.Chappell MA, Woolrich MW, Kazan S, et al. Modeling dispersion in arterial spin labeling: validation using dynamic angiographic measurements. Magn Reson Med 2013;69:563–570. [DOI] [PubMed] [Google Scholar]
- 47.DeCarli C, Fletcher E, Ramey V, et al. Anatomical mapping of white matter hyperintensities (WMH): exploring the relationships between periventricular WMH, deep WMH, and total WMH burden. Stroke 2005;36:50–55. [DOI] [PMC free article] [PubMed] [Google Scholar]
- 48.Gottesman RF, Schneider ALC, Zhou Y, et al. Association between midlife vascular risk factors and estimated brain amyloid deposition. JAMA 2017;317:1443–1450. [DOI] [PMC free article] [PubMed] [Google Scholar]
- 49.Sur S, Lin Z, Li Y, et al. Association of cerebrovascular reactivity and Alzheimer pathologic markers with cognitive performance. Neurology 2020;95:e962–e972. [DOI] [PMC free article] [PubMed] [Google Scholar]
- 50.Jiang D, Lin Z, Liu P, et al. Brain oxygen extraction is differentially altered by Alzheimer’s and vascular diseases. J Magn Reson Imaging 2020;52:1829–1837. [DOI] [PMC free article] [PubMed] [Google Scholar]
- 51.Pettigrew C, Soldan A, Wang J, et al. Association of midlife vascular risk and AD biomarkers with subsequent cognitive decline. Neurology 2020;95:e3093–e3103. [DOI] [PMC free article] [PubMed] [Google Scholar]
- 52.Grimmer T, Riemenschneider M, Förstl H, et al. Beta amyloid in Alzheimer’s disease: increased deposition in brain is reflected in reduced concentration in cerebrospinal fluid. Biol Psychiatry 2009; 65:927–934. [DOI] [PMC free article] [PubMed] [Google Scholar]
- 53.Skillback T, Delsing L, Synnergren J, et al. CSF/serum albumin ratio in dementias: a cross-sectional study on 1861 patients. Neurobiol Aging 2017;59:1–9. [DOI] [PubMed] [Google Scholar]
- 54.Blennow K, Wallin A, Fredman P, et al. Blood-brain barrier disturbance in patients with Alzheimer’s disease is related to vascular factors. Acta Neurol Scand 1990;81:323–326. [DOI] [PubMed] [Google Scholar]
- 55.Janelidze S, Hertze J, Nägga K, et al. Increased blood-brain barrier permeability is associated with dementia and diabetes but not amyloid pathology or APOE genotype. Neurobiol Aging 2017;51: 104–112. [DOI] [PMC free article] [PubMed] [Google Scholar]
- 56.Ohene Y, Harrison IF, Nahavandi P, et al. Non-invasive MRI of brain clearance pathways using multiple echo time arterial spin labelling: an aquaporin-4 study. Neuroimage 2019;188:515–523. [DOI] [PMC free article] [PubMed] [Google Scholar]
- 57.Zeppenfeld DM, Simon M, Haswell JD, et al. Association of perivascular localization of aquaporin-4 with cognition and Alzheimer disease in aging brains. JAMA Neurol 2017;74:91–99. [DOI] [PubMed] [Google Scholar]
- 58.Moftakhar P, Lynch MD, Pomakian JL, Vinters HV. Aquaporin expression in the brains of patients with or without cerebral amyloid angiopathy. J Neuropathol Exp Neurol 2010;69:1201–1209. [DOI] [PMC free article] [PubMed] [Google Scholar]
- 59.Tumani H, Huss A, Bachhuber F. The cerebrospinal fluid and barriers—anatomic and physiologic considerations. Handb Clin Neurol 2017;146:21–32. [DOI] [PubMed] [Google Scholar]
- 60.Evans PG, Sokolska M, Alves A, et al. Non-invasive MRI of blood-cerebrospinal fluid barrier function. Nat Commun 2020;11:2081. [DOI] [PMC free article] [PubMed] [Google Scholar]
- 61.Balusu S, Brkic M, Libert C, Vandenbroucke RE. The choroid plexuscerebrospinal fluid interface in Alzheimer’s disease: more than just a barrier. Neural Regen Res 2016;11:534–537. [DOI] [PMC free article] [PubMed] [Google Scholar]
- 62.Chao AC, Lee TC, Juo SHH, Yang DI. Hyperglycemia increases the production of amyloid Beta-peptide leading to decreased endothelial tight junction. CNS Neurosci Ther 2016;22:291–297. [DOI] [PMC free article] [PubMed] [Google Scholar]
- 63.Wan WB, Cao L, Liu LM, et al. Aβ(1–42) oligomer-induced leakage in an in vitro blood-brain barrier model is associated with up-regulation of RAGE and metalloproteinases, and down-regulation of tight junction scaffold proteins. J Neurochem 2015;134:382–393. [DOI] [PubMed] [Google Scholar]
- 64.Jellinger KA. Prevalence and impact of cerebrovascular lesions in Alzheimer and Lewy body diseases. Neurodegener Dis 2010;7: 112–115. [DOI] [PubMed] [Google Scholar]
- 65.Erickson MA, Banks WA. Age-associated changes in the immune system and blood-brain barrier functions. Int J Mol Sci 2019;20:1632. [DOI] [PMC free article] [PubMed] [Google Scholar]