

Abstract
The Parkinson's disease (PD) risk gene GTP cyclohydrolase 1 (GCH1) catalyzes the rate-limiting step in tetrahydrobiopterin (BH4) synthesis, an essential cofactor in the synthesis of monoaminergic neurotransmitters. To investigate the mechanisms by which GCH1 deficiency may contribute to PD, we generated a loss of function zebrafish gch1 mutant (gch1–/–), using CRISPR/Cas technology. gch1–/– zebrafish develop marked monoaminergic neurotransmitter deficiencies by 5 d postfertilization (dpf), movement deficits by 8 dpf and lethality by 12 dpf. Tyrosine hydroxylase (Th) protein levels were markedly reduced without loss of ascending dopaminergic (DAergic) neurons. L-DOPA treatment of gch1–/– larvae improved survival without ameliorating the motor phenotype. RNAseq of gch1–/– larval brain tissue identified highly upregulated transcripts involved in innate immune response. Subsequent experiments provided morphologic and functional evidence of microglial activation in gch1–/–. The results of our study suggest that GCH1 deficiency may unmask early, subclinical parkinsonism and only indirectly contribute to neuronal cell death via immune-mediated mechanisms. Our work highlights the importance of functional validation for genome-wide association studies (GWAS) risk factors and further emphasizes the important role of inflammation in the pathogenesis of PD.
SIGNIFICANCE STATEMENT Genome-wide association studies have now identified at least 90 genetic risk factors for sporadic Parkinson's disease (PD). Zebrafish are an ideal tool to determine the mechanistic role of genome-wide association studies (GWAS) risk genes in a vertebrate animal model. The discovery of GTP cyclohydrolase 1 (GCH1) as a genetic risk factor for PD was counterintuitive, GCH1 is the rate-limiting enzyme in the synthesis of dopamine (DA), mutations had previously been described in the non-neurodegenerative movement disorder dopa-responsive dystonia (DRD). Rather than causing DAergic cell death (as previously hypothesized by others), we now demonstrate that GCH1 impairs tyrosine hydroxylase (Th) homeostasis and activates innate immune mechanisms in the brain and provide evidence of microglial activation and phagocytic activity.
Keywords: Parkinson's disease, GTP cyclohydrolase 1, tetrahydrobiopterin, zebrafish, tyrosine hydroxylase, microglia
Introduction
Parkinson's disease (PD) is the second most common neurodegenerative disorder after Alzheimer's disease with an estimated age-adjusted prevalence of 168/100,000 (Schrag et al., 2000). Monogenic, Mendelian inherited forms of PD are rare in the United Kingdom and similar populations, but 90 independent genome-wide significant risk signals have now been identified in the much more common sporadic form of PD (Nalls et al., 2019). The GTP cyclohydrolase 1 (GCH1) rs11158026 variant was first identified as a PD risk variant in 2014 (Nalls et al., 2014). This association was robustly replicated in a further meta-analysis of PD genome-wide association studies (GWAS; Nalls et al., 2019). Whole-exome sequencing independently confirmed an association of pathogenic GCH1 coding variants with PD (Mencacci et al., 2014). GCH1 catalyzes the conversion of GTP to D-erythro-7,8-dihydroneopterin triphosphate, the first and rate limiting step in the synthesis of tetrahydrobiopterin (BH4), an essential cofactor for tyrosine hydroxylase (Th), which catalyzes the conversion of tyrosine to L-DOPA.
Mendelian inherited GCH1 mutations were first described in dopa-responsive dystonia (DRD; Ichinose et al., 1994). The dopamine (DA) deficiency in DRD is therefore because of reduced enzymatic synthesis of DA rather than because of cell death of DAergic nigrostriatal neurons (Snow et al., 1993; Turjanski et al., 1993; Rajput et al., 1994; Jeon et al., 1998). Thus, while the genetic association between GCH1 and PD is robust, the underlying mechanisms linking BH4 deficiency and DAergic neuronal cell death remain unclear. Mencacci and colleagues speculated that GCH1 deficiency could directly predispose to nigral cell death but experimental evidence confirming this assumption is lacking. Gch1 knock-out mice are embryonically lethal by mid-gestation at E13.5 and therefore cannot be used to study the links between BH4 deficiency and nigral cell death (Douglas et al., 2015).
Zebrafish (Danio rerio) are ideally suited to undertake mechanistic validation of GWAS hits in a genetically tractable vertebrate model of human disease (Liu et al., 2013; Dina et al., 2015; Gorski et al., 2015). We and others previously demonstrated its usefulness to study both Mendelian PD genes such as PINK1 and genetic risk factors for PD such as glucocerebrosidase 1 (GBA1; Flinn et al., 2013; Keatinge et al., 2015). Their external development makes zebrafish ideally suited to study the consequences of enzymatic GCH1 deficiency through development. Their DAergic nervous system is well characterized, and they are amenable to pharmacological manipulation because of the ease of treatment by simply adding substances to the media.
Here, we describe the generation and functional characterization of gch1 loss of function (gch1–/–) zebrafish, and explore the mechanistic links between GCH1 deficiency and PD. Early development was normal, but by 8 d postfertilization (dpf), gch1–/– larvae became hypoactive and die by 12 dpf. Th protein levels were markedly depleted but, crucially, survival of DAergic ascending neurons was unaffected. RNAseq-based transcriptomic pathway analysis of gch1–/– larval brain tissue highlighted marked activation of immune-modulatory pathways. Subsequent morphologic and functional assays demonstrated clear microglial activation in gch1–/– as a novel, previously not implicated link between GCH1 deficiency and PD.
We conclude that rather than causing DAegic neuronal loss directly, GCH1 deficiency may unmask subclinical parkinsonism because of its effect on TH stability and contribute to PD pathogenesis indirectly via neuroinflammatory mechanisms.
Materials and Methods
Zebrafish husbandry
All larval and adult zebrafish were housed at the University of Sheffield; experimental procedures being in accordance United Kingdom Home Office Animals (Scientific Procedures) Act 1986 (Project license PPL 70/8437, held by O.B.). Adult zebrafish were maintained at 28°C in a 14/10 h light/dark cycle. AB strains of zebrafish were used as wild-type (WT) subjects for this study.
Generation of zebrafish knock-out
A loss of function gch1 zebrafish line was generated with CRISPR/Cas9, as previously described (Hruscha et al., 2013). Two sgRNAs were generated to target regions 5′-AGAAGAGCGCACCCGGAGCCTGG-3′ and 5′-GGGAGGATCCGCAGCGCCAGGGG-3′, respectively. sgRNAs were coinjected with Cas9 protein (NEB) into one-cell stage zebrafish embryos. Injected embryos were raised to adulthood. Founders were identified by genotyping by PCR, and crossed to WT to generate the gch1+/– working colony. The line was genotyped using gch1 genotyping primers listed in the key resource Table 1.
Table 1.
Key resources table
| Reagent/resource | Source | Identifier |
|---|---|---|
| Chemicals, Peptides, and Recombinant Proteins | ||
| 4c4 antibody | Gift from Dr. Alex McGown | Antibody registry ID: AB_10013752 |
| Mouse Th antibody | Immunostar | 22941 |
| Rabbit gch1 antibody | Eurogentech | Not commercially available |
| Chicken anti-GFP antibody | Abcam | ab13970 |
| Zymosan | Gift from Dr. Julie Mazzolini and Dr. Dirk Sieger | |
| L-DOPA | SIGMA | D9628 |
| TRIzol | SIGMA | T9424 |
| Critical commercial assays | ||
| Verso cDNA synthesis kit | Thermo Scientific | AB1453B |
| T7 RNA polymerase | Promega | P2075 |
| SP6 RNA polymerase | Promega | P1085 |
| Brilliant iii SYBR green | Agilent | 600882 |
| KOD Hot-Start DNA polymerase | Novagen | 710865 |
| InFusion | Takara Bio | 638909 |
| pGEX-6p-3 | GE Healthcare | GE28-9546-51 |
| XL1-blue E. coli | Agilent | 200236 |
| BL21 Codon plus (DE3) E. Coli | Stratagene | 230280 |
| Protease cocktail inhibitor | Roche | 5892970001 |
| GSTrap column | GE Healthcare | 17528201 |
|
gch1 PCR reverse 5′-TCTCCTGGTATCCCTTGGTG-3′ |
Integrated DNA Technologies | N/A |
|
gch1 qPCR forward 5′-CCACGATGAGATGGTGATTG-3′ |
Integrated DNA Technologies | N/A |
|
gch1 qPCR reverse 5′-CTGTTTGGTCAGACGCTCCT-3′ |
Integrated DNA Technologies | N/A |
|
ef1a qPCR F F 5′-TGGTACTTCTCAGGCTGACT-3′ |
Integrated DNA Technologies | N/A |
|
ef1a qPCR R 5′-TGACTCCAACGATCAGCTGT-3′ |
Integrated DNA Technologies | N/A |
|
irg1l qPCR forward 5′-ACATCTGGGAATGCACTGGA-3′ |
Integrated DNA Technologies | N/A |
|
irg1l qPCR reverse 5′-TTGGAGAGTGGCACCCTAAG-3′ |
Integrated DNA Technologies | N/A |
|
th qPCR forward 5′-GACGGAAGATGATCGGAGACA-3′ |
Integrated DNA Technologies | N/A |
|
th qPCR reverse 5′-CCGCCATGTTCCGATTTCT-3′ |
Integrated DNA Technologies | N/A |
| gch1 WISH riboprobe forward 5′-GAGCGATCAACGGACACTTT-3′ |
Integrated DNA Technologies | N/A |
| gch1 WISH riboprobe reverse 5′- GGATCAGGGTCAGGAACTCA-3′ |
Integrated DNA Technologies | N/A |
| gch1 cDNA amplification forward 5′-GGGGCCCCTGGGATCCATGGAGCGCTC CAAACAGAAAC-3′ |
Eurogentec | N/A |
| gch1 cDNA amplification reverse 5′-GGGAATTCGGGGATCTCAGCTCCGGAT CAGGGTC-3' |
Eurogentec | N/A |
| Software and Algorithms | ||
| IMARIS 9.0 | Oxford Instruments | N/A |
| Zebralab movement tracking software | Viewpoint | N/A |
Biological sample collection
Collection of RNA or protein was always performed on pooled samples of larvae. For qPCR, RNAseq and Western blotting experiments, each biological sample (n) represents 10–20 larvae obtained from an individual set of parents.
Reverse transcription polymerase chain reaction (RT-PCR) expression analysis of gch1 through development
RNA samples from whole WT larvae were collected from 1 to 5 dpf; RNA was additionally extracted from WT brain samples at 3 mpf. Verso cDNA synthesis kit (Thermo Scientific) was used to generate cDNA from 1-µg RNA per sample, using the oligo dT primer. Transcript levels of gch1 were demonstrated by performing standard PCR using gch1 qPCR primers, and ef1a was used as a housekeeping gene. Primers are listed in the key resource Table 1.
Whole-mount in situ hybridization (WISH)
WISH was performed as previously described (Thisse and Thisse, 2008), using digoxigenin-labeled riboprobes generated from a 696-bp region of gch1 cDNA, using riboprobe primers (see Extended Data Fig. 1-1).
Immunohistochemistry
For immunostaining on cryosections, slides were washed in PBSTw 3 × 5 min on benchtop, and subsequently blocked for 1 h at room temperature (RT) using 150-µl block (1% sheep serum, 5% BSA, 0.3% Triton X-100, and 0.1% Tween 20 in PBS) and covered with a Parafilm coverslip. Following blocking, slides were incubated with 100-µl primary antibody in block, then covered with a Parafilm coverslip and maintained at 4°C overnight. Primary antibodies were used at the following concentrations: rabbit Gch1 1:100 (custom antibody, Eurogentec), mouse TH 1:1000 (Immunostar), chicken anti-GFP 1:200 (Abcam). The following day, slides were washed in PBSTw 3 × 5 min, before adding 100-µl secondary antibody (1:200) in block, and covered with Parafilm, and incubated at 37°C for 1.5 h. Slides were then washed in PBSTw 3 × 20 min, before partially drying, adding fluoroshield with DAPI, and applying a glass coverslip.
Whole-mount immunostaining with anti-4c4 was performed as previously described (Inoue and Wittbrodt, 2011), using a heating method in 150 mm Tris-HCl, pH 9.0, followed by an acetone crack, before standard whole-mount fluorescent immunostaining. 4c4 antibody was used at a concentration of 1:50.
qPCR
To validate loss of gch1 mRNA stability, RNA was extracted from WT and gch1–/– sibs at 5 dpf. RNA concentration and quality were quantified using the Nanodrop 1000 Spectrophotometer. cDNA was synthesized from 1-µg RNA using Verso cDNA synthesis kit. Transcript levels of gch1 mRNA in WT versus gch1–/– samples were quantified by qPCR using Brilliant iii SYBR-green on a Stratagene MxPro 3000P (Stratagene) qPCR machine. gch1 expression was quantified using gch1 qpCR primers, and was normalized using ef1a as a housekeeping gene. Data were analyzed using the δ-δ Ct method.
qPCR for irg1l and th expression was performed at multiple developmental stages, using cDNA produced from RNA samples from larval heads. th primer sequences were used as previously described (Chen et al., 2009). ef1a was used as a reference gene when assessing irg1l expression; rps29 was used as a reference gene for th expression. All primers are listed in the key resource Table 1.
Patch clamping
Larval zebrafish were anaesthetized in MS-222 (0.02%) dissolved in Evans physiological saline (134 mm NaCl, 2.9 mm KCl, 2.1 mm CaCl2, 1.2 mm MgCl2, and 10 mm HEPES, pH 7.8). Fish were pinned laterally to a Sylgard-lined Petri dish using 25-µm diameter tungsten pins through the notochord and jaw. One eye was removed using a pair of fine forceps to expose the underlying diencephalon. The preparation was transferred to the patch clamp setup for loose patch recording in which the specimen were perfused with Evans physiological saline containing glucose (10 mm) and d-tubocurarine (10 μm). To study autonomous firing activity of DC2/4, kynurenic acid (1 mm) and picrotoxin (100 μm) were added to the Evan's physiological saline to abolish synaptic transmission.
Patch clamp electrodes (resistance = 7–10 MΩ) were generated in house and pulled from filamented borosilicate glass (1.5-mm outer diameter, 0.06-mm inner diameter; Harvard Apparatus) with a P-80 micropipette puller (Sutter Instrument). Electrodes were filled with Evan's physiological saline and used to obtain low-resistance (15–30 MΩ) seals to enable noninvasive loose patch recordings of extracellular spike discharges. Recordings were acquired using a RK-400 amplifier (Intracell) and A-D converter connected to a PC running WinEDR (V3.1.3; Strathclyde Electrophysiology Software). Raw traces were acquired at 10–20 kHz and filtered using a bandpass filter between 1 and 4 kHz. Analysis was conducted offline using Clampfit (Molecular Devices).
High-performance liquid chromatography (HPLC)
The samples for HPLC were homogenized by sonication in 150-µl ice-cold 2% HClO4, centrifuged (4°C, 30 min), and 25 or 30 µl supernatant (for sex matched adult brains and larvae, respectively) were injected onto the column. The HPLC system included a Waters 717plus autosampler, a Gemini C18 5-μm 150 × 4.60 mm column (Phenomenex), and a Waters Concorde electrochemical detector with an integrated column oven. The working potential of the electrochemical cell was set to at +0.80 V. The mobile phase consisted of purified water with 8% methanol, 50 mm citric acid, 1.5 mm 1-octanesulfonic acid, 0.05 mm EDTA, and 50 mm phosphoric acid, pH 2.71. The column temperature was set at 35°C and the flow rate at 1 ml/min. The Waters Empower software (Waters) was used for system control, data acquisition and analysis. Standard curves for the substances analyzed were linear from 10 nm to 1 μm. The procedure has been described previously in detail (Sallinen et al., 2009). Three groups of larvae were analyzed for each genotype at each age. For the adults, five brains were analyzed for each genotype and were sexed matched. The protein pellets derived from the samples were dissolved by sonication in 150-µl 5% sodium dodecyl sulfate solution, and protein content was determined by the BCA assay (with the Pierce BCA assay kit from Thermo Scientific) for normalization of the neurotransmitter levels.
th WISH + counts
WISH and counting of th neurons was performed as previously described (Flinn et al., 2013). Populations DC2 and DC4/DC5, as described previously (Rink and Wullimann, 2002), were counted in a blinded fashion, using a Zeiss Axioplan microscope with a Plan-Neo FLUAR 20×/0.5 objective (Zeiss). Counting was performed on samples from at least three independent clutches of larvae.
Quantification of DAergic neurons in zebrafish larvae (Vmat2+ neuron counting)
An etVmat2-GFP transgenic line, labeling populations of monoaminergic neurons, was used for quantification of DAergic neurons in gch1–/– and WT larvae at 8 dpf. Larvae were anaesthetized and mounted in 1% low-melting point agarose, before imaging on the Zeiss Airyscan confocal microscope with a 20× objective lens. A stack of images was taken of the DC2 and DC4/5 neurons of the ventral diencephalon, and larvae were genotyped following imaging to confirm genotype. Images were blinded to genotype before counting of the DC2 and DC4/5 neurons. Mean number of DC2 and DC4/5 neuron counts were observed over three independent experiments.
Protein extract preparation
Protein samples for Western blotting were isolated from larval zebrafish heads, using ∼15 per sample, and tissue was homogenized in 25-µl RIPA buffer. Samples were left on ice for between 10 and 30 min, then centrifuged to recover protein at 13,000 rpm for 15 min at 4°C. 5 µl of sample was retained for a BCA assay, then an equal volume of Laemmli buffer was added to the larger aliquot of protein. BCA assay was used to quantify protein concentration.
Generation of anti-Gch1 antibody
A cDNA clone encoding Gch1 was obtained from Eurogentec. A Gch1 PCR fragment was cloned into the BamHI site of the expression vector pGEX-6p-3. The GST-Gch1 fusion protein was expressed in Codon Plus (DE3) Escherichia coli and purified by standard methods. GST-Gch1 Fusion protein was injected into rabbits using a three-month immunization protocol by Eurogentec.
Western blotting
Equal amounts of protein per sample (prepared as described above) were denatured for 3–5 min at 95°C in a heat block. Protein samples were resolved by SDS-PAGE using Bio-Rad Mini-PROTEAN TGX Precast acrylamide gels, and subsequently transferred to a PVDF membrane by a wet transfer. Following transfer, samples were blocked in TBST with 5% skimmed milk powder for 1 h at RT, before overnight incubation with primary Th antibody (1:1000 dilution in TBST with 5% milk) at 4°C. Membranes were subsequently incubated for 1 h with anti-mouse secondary antibody in TBST. ECL chemiluminescence kit (ThermoFisher) was used to develop the membrane, followed by detection using a Bio-Rad ChemiDoc imager. The membrane underwent blocking and subsequent steps with a β-actin primary antibody, to normalize Th protein levels to β-actin.
Behavioral analysis, L-DOPA treatment, and survival analysis
Larvae from a gch1+/– incross were dechorionated at 1 dpf, and subsequently maintained in 1 mm L-DOPA + 0.01% DMSO in E3 media, or a control solution of 0.01% DMSO. Larvae were maintained in treatment in a light-protected box, until 8 dpf. At 8 dpf, larvae were transferred to a 48-well tissue culture plate, in fresh treatment, and then underwent behavioral analysis using the Viewpoint zebrabox system. Behavior was analyzed as previously described (Cario et al., 2011). In brief, larvae were habituated for 30min, at 10% light intensity; larvae were then tracked for a 40-min period of alternating 5-min dark and light cycles (of 0% and 10% light intensity).
Survival analysis
Larvae were culled if showing obvious signs of illness, including lack of a normal escape response to a touch of the tailfin.
L-DOPA treatment
Larvae were treated with 1 mm L-DOPA + 0.01% DMSO in E3 and were maintained in the dark during the treatment course from 1 to 10 dpf. Drug solution was pH corrected by addition of 0.5 m HCl. Control-treated fish were treated with E3 + 0.01% DMSO. Media were refreshed daily.
RNAseq
Larvae from a gch1+/– incross were genotyped at 3 dpf by PCR of tailfin biopsy, then raised to 8 dpf. Twenty brains per genotype were dissected from the larvae. A TRIzol-based protocol was used to extract RNA from the tissue. Briefly, larval brains were homogenized in 250-µl TRI reagent (Sigma) and incubated at RT before adding 50-µl chloroform (Thermo Fisher Scientific). The samples were centrifuged at 13,300 × g and the top aqueous phase was collected and transferred to a separate tube. RNA was precipitated from the aqueous phase by mixing with equal volume of isopropanol (Thermo Fisher Scientific) and centrifugation at 13,300 × g. Precipitated RNA was resuspended in DEPC-treated water (Thermo Fisher Scientific) and its concentration and quality were quantified using the Nanodrop 1000 Spectrophotometer; 750 ng of high-quality total RNA, with an RNA integrity number (RIN) of 9 or above, was used in the preparation of sequencing libraries using the NEB Ultra II Directional RNA Library Prep kit (NEB catalog #E7760), following the poly A mRNA workflow. Libraries were individually indexed and pooled for sequencing. Single-end 100-bp sequencing was performed on the Illumina HiSeq 2500 platform using Rapid Run mode with V2 chemistry.
Gene-level analysis
RNAseq samples were preprocessed with RNAseq pipeline bcbio (https://github.com/bcbio/bcbio-nextgen) using Salmon quantification (Patro et al., 2017). Outliers were identified with principal component analysis (PCA). WT replicate 2 was identified as an outlier from the other WT samples and was excluded from all further analysis. Salmon counts were rounded to the nearest integer, and analyzed with the R package DESeq2 (Love et al., 2014) to perform differential gene expression analysis. gch1–/– and gch1+/– samples were compared against WT controls. Transcripts were mapped to Entrez IDs using the R package biomaRt (Durinck et al., 2009). Differentially expressed (DE) genes were defined as those meeting absolute log fold change (FC) > 1 and adjusted p < 0.05 thresholds. Unannotated genes were searched in Ensembl for human orthologues; if a human orthologue was identified, the human gene description was used in place of the original descriptor. Unannotated genes with no human homology were excluded from the list.
Microglial counting
Larvae from a gch1+/– incross were raised to 8 dpf before fixation with 4% PFA in PBSTw and subsequent immunostaining with 4c4 antibody, a microglial marker. Immunostained larvae were decapitated for imaging, with tails being used for genotyping of samples by PCR. Immunostained heads were mounted in a clear bottomed-96-well plate (Greiner), and imaged on the Perkin-Elmer Opera Phenix High Content Screening System using the 20× objective. Images were exported and blinded before analysis and microglial cells in the midbrain were counted. Image files were unblinded for analysis.
Zymosan microinjection
Larvae were maintained in E3 with PTU until 5dpf, then anaesthetised with 4.2% tricaine before being mounted in 2% low-melting point agarose in a Petri dish, dorsal-side up. Once the agarose had set, the Petri dish was filled with E3 and 4.2% tricaine until the larvae and agarose were completely submerged. The agarose surrounding the head area was removed, to allow a clear trajectory for injection. An injection mix was prepared, composed of 1.66-µl pacific blue-labeled zymosan (2.5 × 10⁵ zymosan/µl), 2 µl phenol red dye, and 6.33 µl of PBS. Injection mixture was microinjected into the tectum using a gated (i.e., untimed) setting at low pressure, until the tectum filled with the injection mix, but before the mix filling the midbrain ventricle; this was ∼1 nl, containing an estimated 41 zymosan particles. Following injection, larvae were carefully removed from the agarose and transferred to fresh E3 + PTU media, and maintained at 28°C for a further 6 h, before perfusion fixation in 4% PFA at 4°C overnight. Larvae were dehydrated in methanol at −20°C, before immunostaining with the 4c4 antibody. Following immunostaining, tails were transected from the samples for genotyping, and the heads were imaged on the PerkinElmer Opera Phenix, using the 20× objective.
Phagocytic activity assay
To quantify phagocytic activity, the proportion of zymosan that had been engulfed by microglia was calculated. To achieve this, Z-stacks of 4c4-immunostained, zymosan-injected larvae were imported into IMARIS as two separate channels (channel 1 = zymosan, channel 2 = microglia), and a “surface” was created to summarize the properties of the zymosan in the image. On the Surpass Scene viewer in IMARIS, a surface was rendered manually, specific to channel 1 using the Marching Cubes tool. Only zymosan within the tectum was selected. Specific values for the intensity sum of channel 1 were exported and saved; these values correspond to the total intensity of the selected zymosan fluorescence within the tectum. Returning to the surface rendering function, any zymosan that had not been engulfed was deleted from the surface rendering, leaving only the engulfed particles. Intensity sum of these remaining zymosan particles was then exported, providing us with two datasets: total zymosan intensity, and engulfed zymosan intensity. To calculate phagocytic efficiency, the following equation was used:
Experimental design and statistical analysis
Data were analyzed for statistical significance with using Prism 9 software (GraphPad Software). Unpaired t tests were used to compare two different groups, while each group was composed of data points from at least three independent clutches. When three or more groups where to be compared, one-way ANOVA was employed for these comparisons. Each group is composed of data points from at least three independent clutches of embryos. All data are presented as the mean ± SEM. Specific samples sizes are indicated in the legends. All each n number represented a separate individual, unless embryos needed to be pooled to generate an appropriate amount of material to study. For example, groups of 20 larvae would be pooled to generate enough RNA for a single qPCR data point. For survival curves, Gehan–Breslow–Wilcoxon test was employed in each case to test for significance between different groups.
Results
CRISPR-induced deletion in gch1 results in predicted protein truncation and reduced mRNA stability
There is high sequence identity at both the DNA (71%) and protein (75%) level between human GCH1 (ENSG00000131979) and zebrafish gch1 (ENSDARG00000070453). Both the human and zebrafish proteins have a single conserved domain, spanning from residue 66 to 250 in human GCH1 and from residue 73 to 251 in zebrafish Gch1 (Fig. 1A). The zebrafish paralogue gch2 (ENSDARG00000099101) also retains sequence homology with human GCH1 with 67% identity at DNA level and 69% at protein level. However, expression patterns of gch2 are spatiotemporally distinct from the constitutive neuronal expression of gch1, with expression of gch2 localized to the melanophore and xanthophore lineages during development, and expression almost undetectable by 3 dpf (Pelletier et al., 2001). In contrast to gch2, gch1 retains conserved synteny with human GCH1 (Extended Data Fig. 1-1).
Figure 1.

CRISPR-induced deletion in gch1 results in predicted truncation of protein and reduced mRNA stability. A, Human GCH1 (top) and zebrafish Gch1 protein sequence (middle) have a high protein identity score (75%), and the WT zebrafish Gch1 protein sequence contains a conserved GCH1 domain from residue 73 to 251. The predicted mutant protein sequence (bottom) has a frameshift mutation (red), from residue 59 to 86, before a nonsense mutation resulting in a premature stop codon (*) at residue 87. B, The large CRISPR-induced 94-bp deletion allows for genotyping by PCR. The upper band (300 bp) shows WT DNA, the lower band (200 bp) is mutant DNA. C, Quantitative polymerase chain reaction of gch1 transcript levels in WT and gch1–/–; gch1–/– expression is expressed as a percentage of WT expression (p = 0.0130, one-tailed Welch's t test, n = 3, FC = 0.213, F = 50.59, DFn =2, DFd = 2; see Extended Data Fig. 1-1).
Synteny map of the human GCH1 and zebrafish gch1 genes. Zebrafish gch1 retains conserved synteny with human GCH1, with preserved colocalization with the genes SAMD4A, WDHD1, and SOCS4. Download Figure 1-1, TIF file (3.1MB, tif) .
To generate a gch1 mutant line, we used CRISPR/Cas9 to produce a large deletion detectable by standard PCR. We co-injected two sgRNAs targeting exon 1 of the gch1 gene, inducing a 94-bp deletion (Fig. 1B), which resulted in a frameshift mutation with a predicted nonsense protein product from residue 59, and a truncation at residue 87, removing the crucial GCH functional domain. gch1–/– larvae were assessed for gch1 mRNA stability by qPCR at 5 dpf. mRNA levels of gch1 were reduced to 21.3% in gch1–/– compared with WT gch1 expression levels (p = 0.0130, one-tailed Welch's t test, n = 3, F = 50.59, DFn = 2, DFd = 2; Fig. 1C), indicating nonsense-mediated decay of the transcript. However, the loss of Gch1 protein expression in gch1–/– was not able to be confirmed by western blot in whole larval homogenates from WT and gch1–/– 8-dpf larvae (data not shown), likely because of cross reactivity of the custom antibody with the Gch1 paralogue Gch2 (80% homology at the amino acid level to Gch1).
Zebrafish Gch1 is expressed in the ventral diencephalic DAergic neurons
In order to identify temporal and spatial expression patterns of gch1 during zebrafish development, we performed RT-PCR and WISH for gch1. RT-PCR for gch1 revealed increasing expression from 1 to 5 dpf, in addition to strong expression in adult brains (3 mpf; Fig. 2A). gch1 WISH patterns were consistent with previously described expression patterns in mice (Shimoji et al., 1999). The gch1 mRNA WISH signal was highly localized within the DAergic neurons of the posterior tuberculum of the ventral diencephalon (Fig. 2B). This was validated by co-immunostaining on coronal sections of the larval brain at 5 dpf, using the custom Gch1 antibody in parallel with anti-Th as a DAergic cell marker (Fig. 2C). Gch1 protein expression was strongly detected in combination with Th expression in the DC2 and DC4/5 populations of the posterior tuberculum. However there was large variability in the Gch1 protein signal between different populations of Th neurons, which is in keeping with the heterogeneity of Gch1 expression previously documented in this cell type (Kapatos, 2013).
Figure 2.

Zebrafish gch1 is expressed in the ventral diencephalic DAergic neurons. A, gch1 is expressed from 1 to 5 dpf in WT larvae, as demonstrated by RT-PCR. ef1α was used as a loading control. B, Whole-mount ISH for gch1 in 2-dpf WT larvae reveals expression consistent with the DAergic neurons of the diencephalon, and the serotonergic neurons of the raphe nuclei. C, Immunostaining for GCH1 in coronal sections of 5-dpf WT larvae confirms colocalization with Th (white arrows) in the DAergic neurons of the ventral diencephalon.
gch1−/− mutants have significantly reduced levels of monoaminergic neurotransmitters, but normal DAergic neuronal activity, and show lethality by 12 dpf
gch1–/– larvae develop normally until 5 dpf, at which point they fail to inflate their swim bladder (Fig. 3A). By 8 dpf, larvae are visibly emaciated, have reduced spontaneous swim movement, and begin to develop a curved spine. After 8 dpf, gch1–/– larvae show further decline, and fail to survive beyond 12 dpf (Gehan–Breslow–Wilcoxon test, WT n = 21, gch1+/– n = 31, gch1–/– n = 28, p < 0.0001; Fig. 3B). To determine the functional consequences of the CRISPR-induced gch1 deletion on Gch1 enzymatic activity and its consequences for neurotransmitter synthesis, we quantified levels of monoaminergic neurotransmitters and their metabolites. By 5 dpf, DA, serotonin and noradrenaline levels were significantly depleted in gch1–/– in comparison to WT [two-way ANOVA, Dunnett's multiple comparison test, F(6,24) = 12.13, serotonin (p < 0.0001) and noradrenaline (p < 0.0001); Fig. 3C]. By 8 dpf, adrenaline was also significantly reduced (p = 0.0226, two-way ANOVA, Dunnett's multiple comparison test, F(6,24) = 16.32; Fig. 3D). At 8 dpf, gch1–/– also showed additional large reductions in levels of 3-MT and 5-HIAA (Extended Data Fig. 3-1). There were no changes in neurotransmitter levels in gch1+/– larvae at 8 dpf (data not shown). DA and serotonin levels were also normal in gch1+/– adult brains, but there was a modest reduction in noradrenaline levels (p = 0.0015, two-way ANOVA, Dunnett's multiple comparison test, F(7,64) = 1.814; Extended Data Fig. 3-2).
Figure 3.
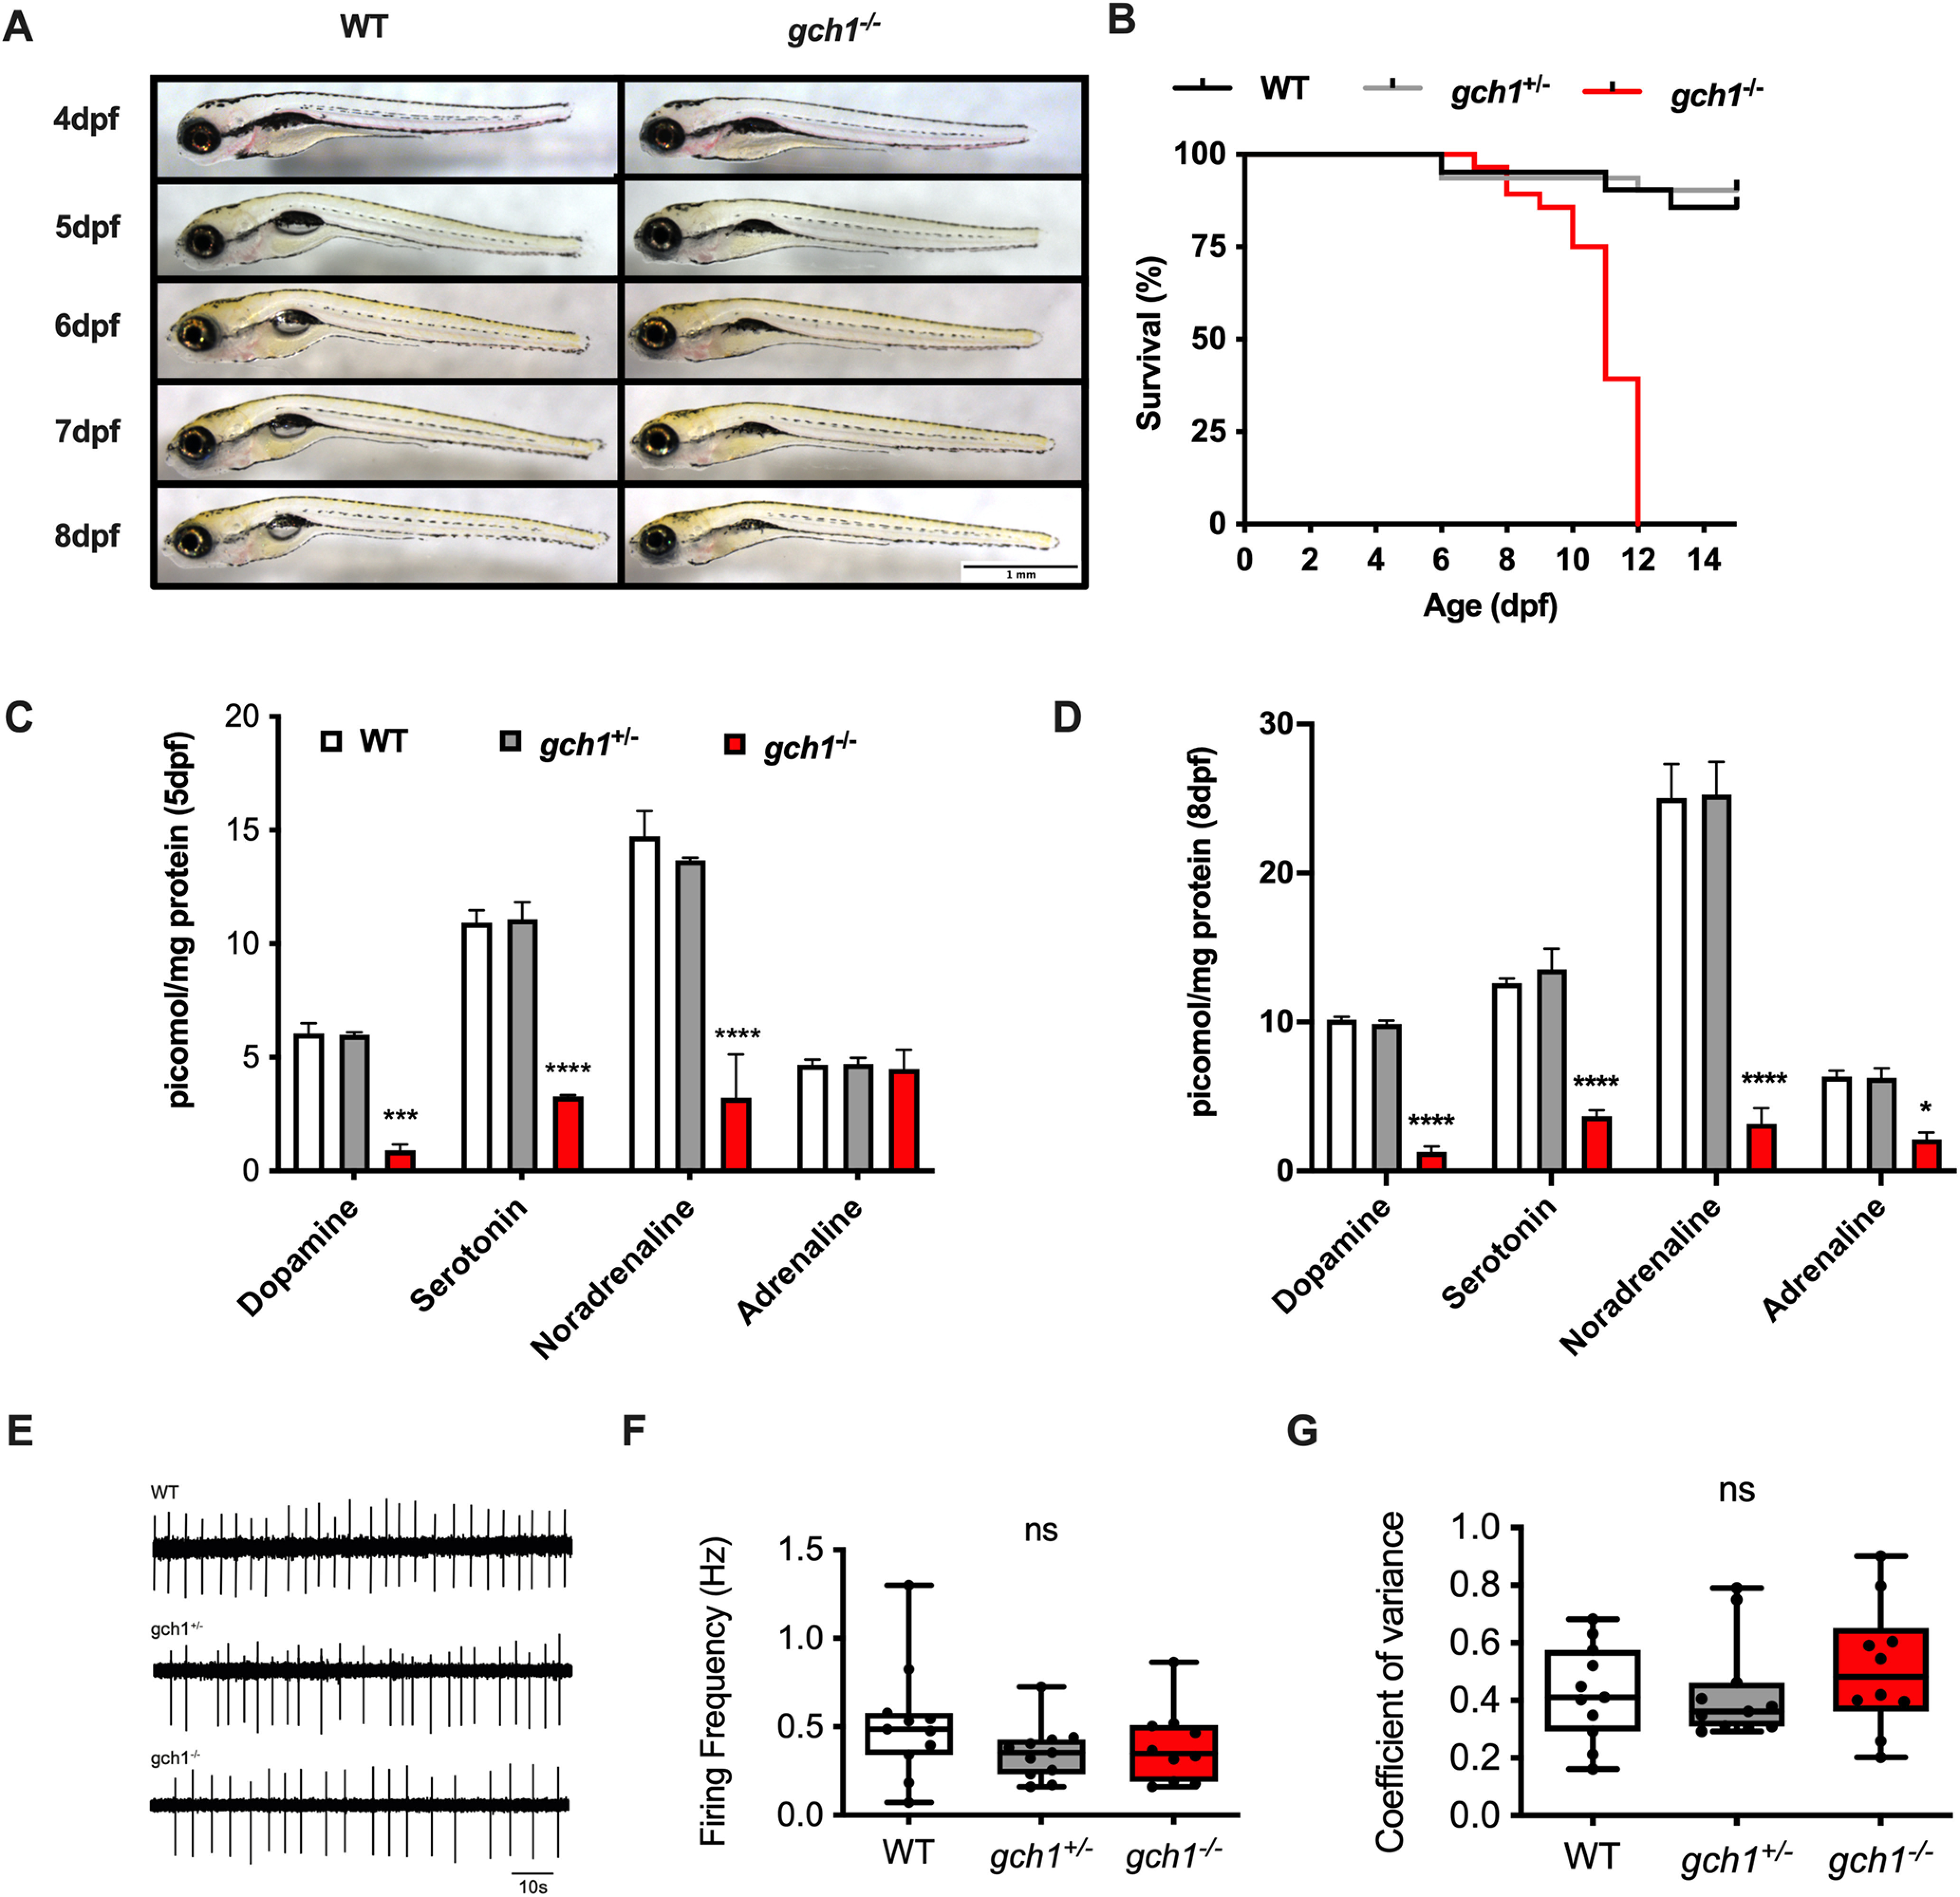
gch1–/– mutants have significantly reduced levels of monoaminergic neurotransmitters and die by 12 dpf. A, gch1–/– develop normally until 5 dpf, at which point they do not show swim bladder inflation. By 8 dpf, gch1–/– larvae are visibly emaciated. B, Survival analysis demonstrated increased mortality of gch1–/– larvae with 100% mortality by 12 dpf (Gehan–Breslow–Wilcoxon test, WT n = 21, gch1+/– n = 31, gch1–/– n = 28, p < 0.0001). C, HPLC-based analysis of monoaminergic neurotransmitters at 5 dpf revealed significantly reduced levels of DA (p < 0.0001), serotonin (p < 0.0001), and noradrenaline (p < 0.0001, two-way ANOVA, Dunnett's multiple comparison test, F(6,24) = 12.13). D, At 8 dpf, adrenaline was also significantly depleted (p = 0.0226, two-way ANOVA, Dunnett's multiple comparison test, F(6,24) = 16.32; see Extended Data Figs. 3-1, 3-2). E, Loose patch clamp recordings of autonomous spike activity generated by DAergic neurons in WT, gch1+/–, and gch1–/– fish at 4 dpf. F, Instantaneous firing frequency was similar in WT, gch1+/–, and gch1–/– (p = 0.2547, ordinary one-way ANOVA, F(2,29) = 1.434, n = 10–11). G, There were also no differences in coefficient of variance of the instantaneous firing frequency between WT, gch1+/–, and gch1–/– (p = 0.5137, ordinary one-way ANOVA, F(2,29) = 0.6816, n = 10–11).
Additional metabolites measure by HPLC in 8-dpf gch1 genotypes. HPLC analysis of metabolites at 8dpf demonstrated gch1–/– have large reductions in 5-HIAA (p = 0.0226) and 3-MT (p < 0.0001) compared to WT (n = 3, two-way ANOVA, Dunnett's multiple comparison test, F(6,24) = 16.32). Download Figure 3-1, TIF file (100.7KB, tif) .
Neurotransmitter levels in adult gch1+/– brains. No perturbations were detected in DA or serotonin in adult brain samples from gch1+/– fish and their WT sibling controls. Noradrenaline showed a modest 12% reduction in gch1+/– versus WT (78.2 vs 88.7 pmol/mg, p = 0.0015, n = 5, two-way ANOVA, Dunnett's multiple comparison test, F(7,64) =1.814). Adrenaline was measured but not detected (n = 5, two-way ANOVA). No significant changes were observed in the DA breakdown products DOPAC, 5-HIAA, HVA, or 3-MT. Download Figure 3-2, TIF file (134.8KB, tif) .
To further determine the functional consequences of the observed neurotransmitter deficiency on neuronal activity, patch-clamp recordings of DAergic neurons were undertaken at 4 dpf. To this end, DC2/4 neurons were recorded with the loose patch clamp method. Cells were bathed in synaptic blockers kynurenic acid (1 mm) and picrotoxin (100 μm) to abolish glutamatergic and GABAergic synaptic transmission, respectively, thereby allowing us to monitor autonomous spike activity generated by DAergic neurons (Jay et al., 2015) in WT, gch1+/– and gch1–/– fish (Fig. 3E). Subsequent analysis revealed no changes in instantaneous firing frequency (WT = 0.53 ± 0.33 Hz, nfish = 11, gch1+/– = 0.37 ± 0.16 Hz, nfish = 11, gch1–/– = 0.39 ± 0.21 Hz, nfish = 10, p = 0.2502, ordinary one-way ANOVA, F(2,29) = 1.434; Fig. 3F) or the coefficient of variation for instantaneous firing frequency (WT = 0.43 ± 0.17, nfish = 11, gch1+/– = 0.43 ± 0.18, nfish = 11, gch1–/– = 0.51 ± 0.22, nfish = 10, p = 0.5436, ordinary one-way ANOVA, F(2,29) = 0.6816; Fig. 3G). Together, this suggests Gch1 deficiency does not affect endogenous firing activity of DAergic neurons at 4 dpf.
gch1−/− larvae do not develop DAergic neuronal cell loss
The posterior tuberculum contains different populations of DAergic neurons, termed DC1–DC7, from anterior to posterior. Retrograde tracing experiments have demonstrated that populations DC2 and DC4/DC5 project to the subpallium (equivalent to the human striatum), and are thus considered to be comparable to the ascending DAergic neurons of the substantia nigra pars compacta in humans (Rink and Wullimann, 2002). The identification of GCH1 as a risk gene for PD suggests an effect of GCH1 deficiency on survival of DAergic neurons. To test this hypothesis, we quantified the number of DAergic neurons in the DC2 and DC4/5 populations in gch1–/– and WT controls at both 5 and 8 dpf, using WISH for th on a gch1+/– incross (Fig. 4A). We had previously used the same method to describe early loss of DAergic neurons in pink1–/– zebrafish (Flinn et al., 2013). However, quantification of DAergic neurons in these populations did not reveal a difference in cell count between WT and gch1–/– larvae (p = 0.7629, Welch's t test, F = 3.050, DFn = 27, Dfd = 20; Fig. 4B); furthermore, the spatiotemporal distribution and staining intensity of the neurons appeared normal in gch1–/– (Fig. 4A), suggesting Gch1 is neither required for the specification, nor for survival of DAergic neurons in the zebrafish midbrain.
Figure 4.
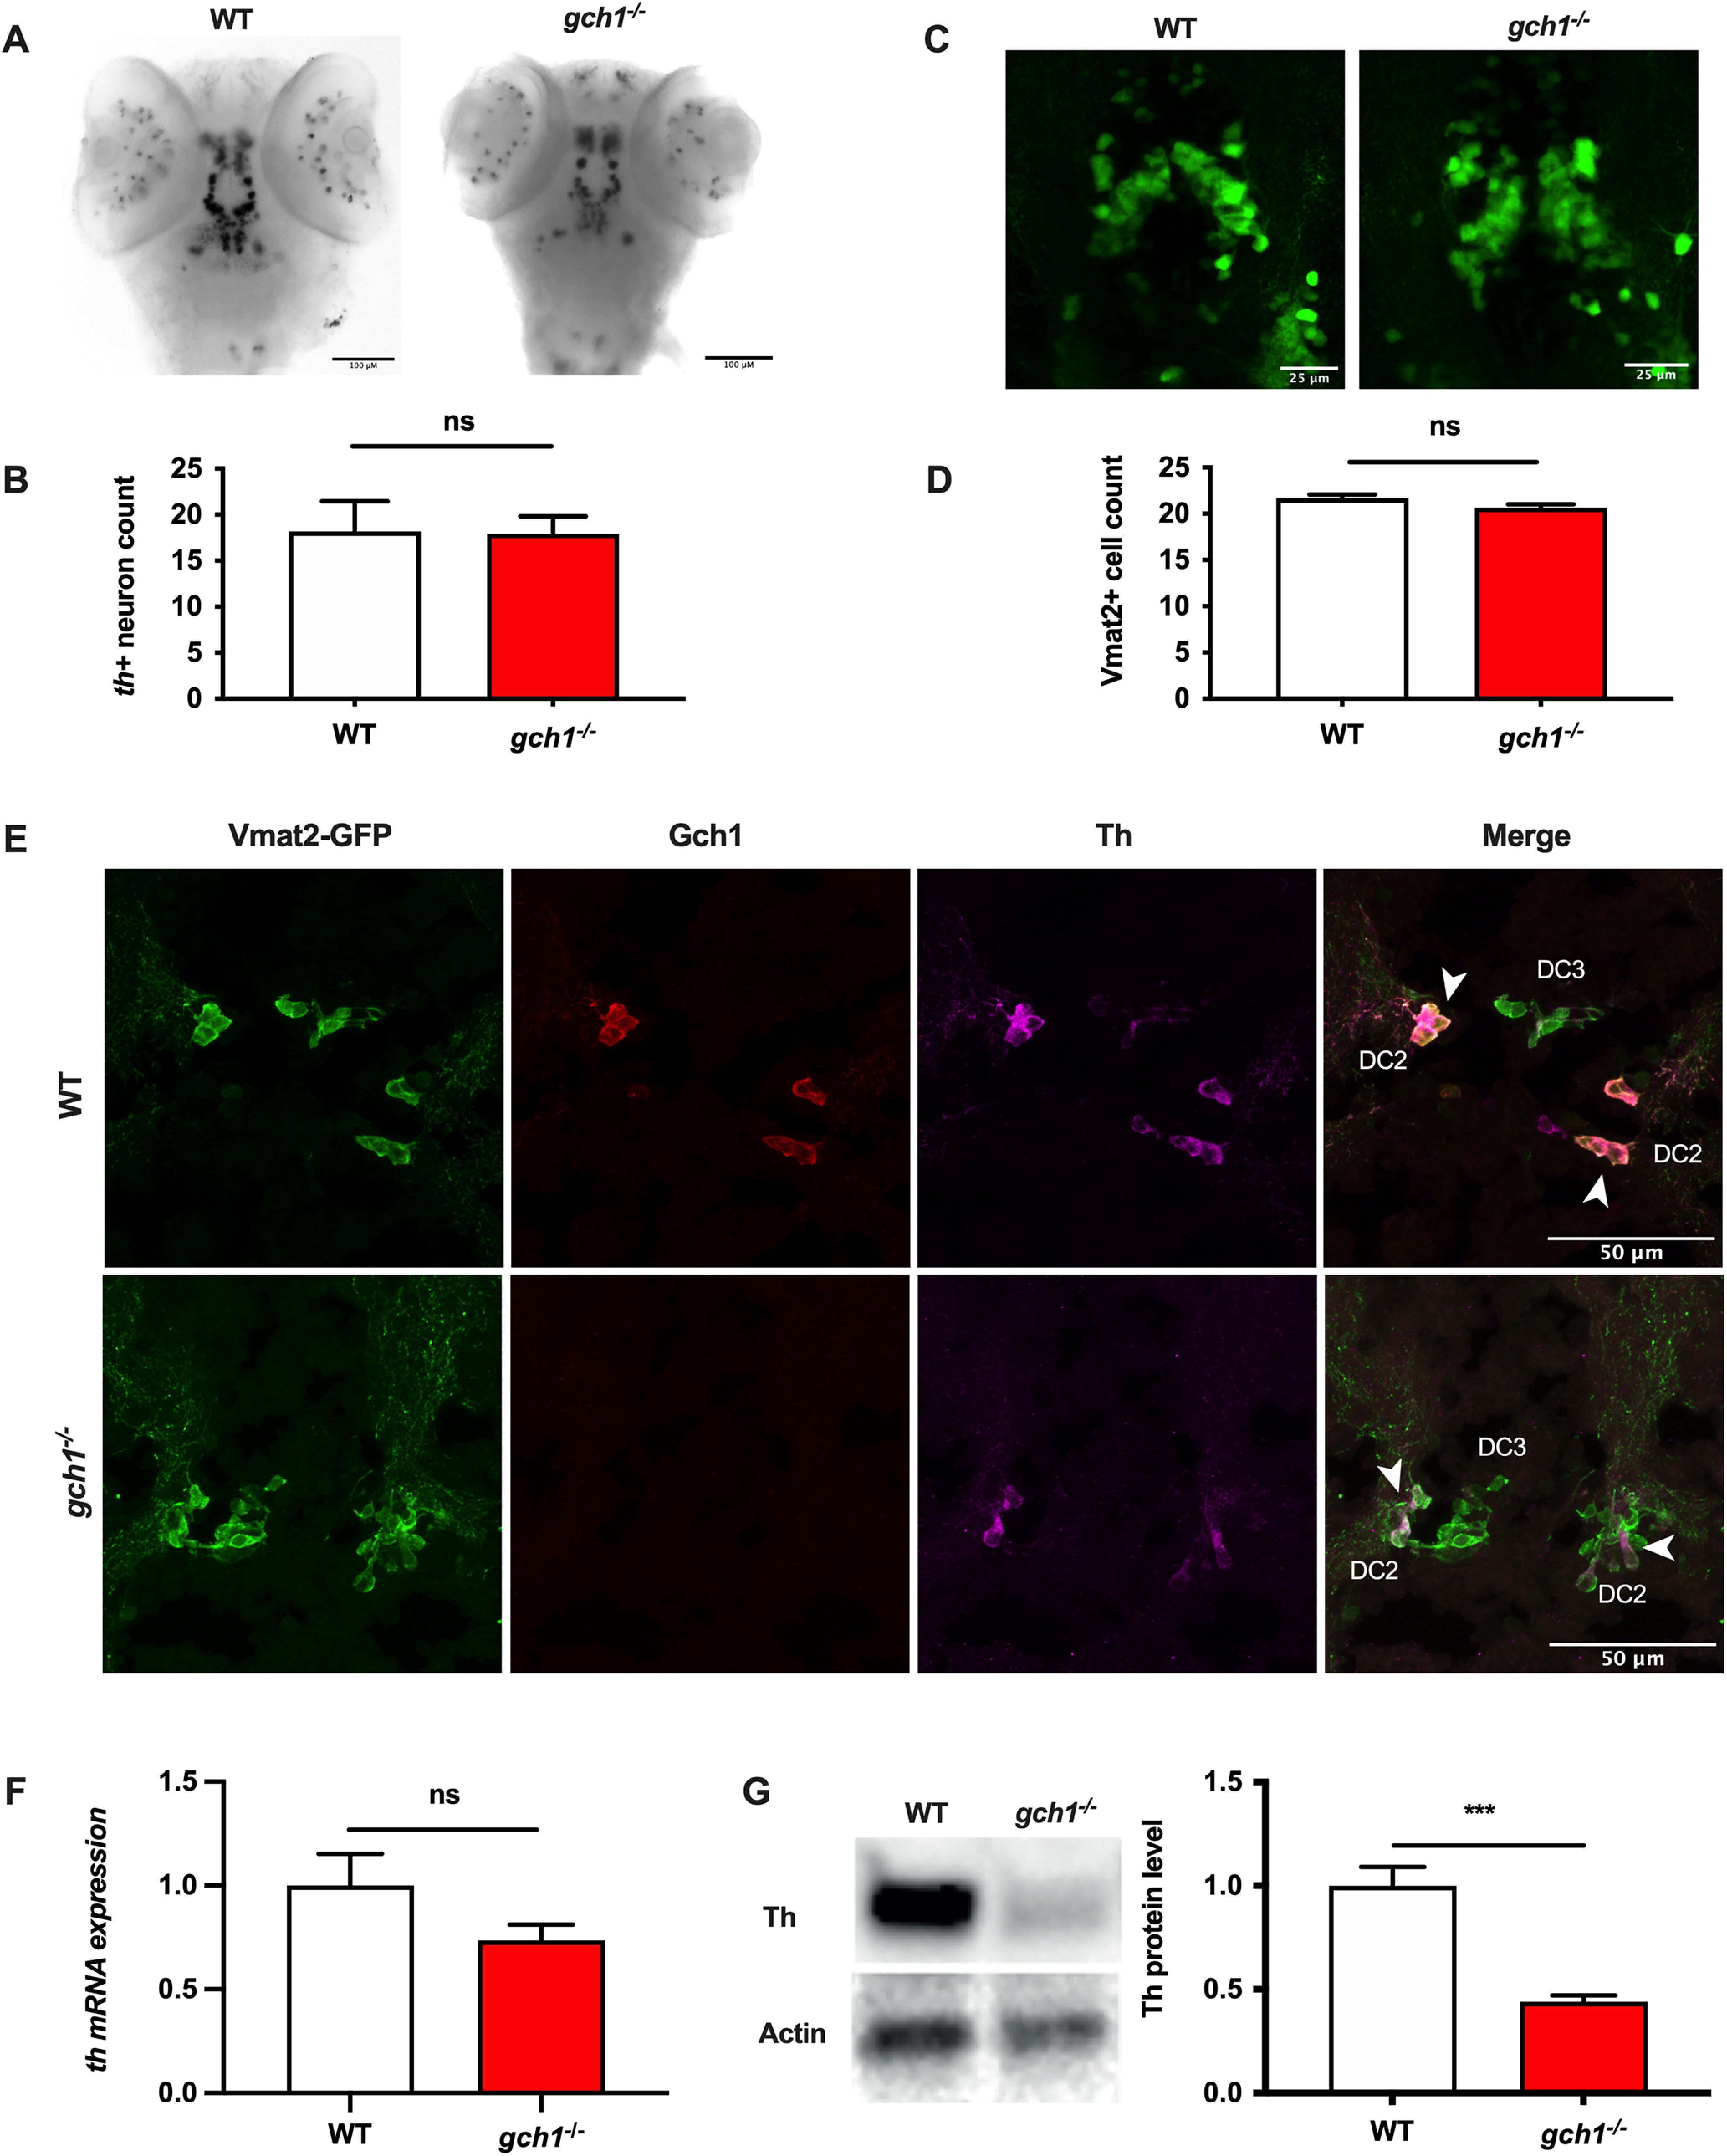
Th levels are depleted at the protein level in gch1–/– larvae. A, ISH for th shows no change in staining of DAergic neuron populations in gch1–/– larvae, with no observed alterations in distribution or intensity of staining. B, Neuron counts of the th+ ventral diencephalic population (DC2, DC4, and DC5) reveal no difference in neuron counts between WT and gch1–/– (p = 0.7629, n = 28 and 21, respectively, Welch's t test, F = 3.050, DFn = 27, Dfd = 20) C, Representative image of a dorsal view of the etVmat2-labeled DAergic neurons of the diencephalic cluster (anterior-posterior, left-to-right). D, Neuron counts of the DC2 and DC4 DAergic populations at 8 dpf, performed on etVmat2-GFP transgenic larvae, show no change between WT and gch1–/– larvae (p = 0.0652, n = 31, Welch's t test, F = 1.182, DFn = 30, Dfd = 30; see also Extended Data Fig. 4-1). E, Diencephalic DAergic neurons of a WT zebrafish are positively immunolabelled by vmat2, Gch1, and Th antibodies, the arrows depict strong colocalization of Vmat2, Gch1, and Th in the DC2 neurons. gch1–/– larvae are positively stained by vmat2, however lack immunostaining for Gch1 and show reduced immunofluorescence for Th at 5 dpf; arrows indicate DC2 cells with colocalization of Vmat2 and Th. F, qPCR for th at 8 dpf reveals no significant change in transcript levels between WT and gch1–/– (p = 0.1722, WT n = 5, gch1–/– n = 4, Welch's t test, F = 5.011, DFn = 4, Dfd = 3). G, Western blotting against Th shows a 55% decrease in Th immunoreactivity in 8 dpf gch1–/– larvae (p = 0.0004, n = 5 per group, unpaired t test, F = 8.080, Dfn = 4, Dfd = 4).
MPP+ susceptibility in gch–/– larvae. Larvae from a gch1+/– incross were treated at 2 dpf with 3 mm MPP+ for 24 h. Quantification of th+ neurons revealed a decrease in neuron counts in MPP+-treated larvae of 25% (p < 0.0001, two-way anova, F(2,56) = 0.6355), however no effect of genotype on neuron counts (p = 0.7863); n = 15 per group. Download Figure 4-1, TIF file (111.1KB, tif) .
We next determined whether Gch1 deficiency may only result in loss of DAergic neurons at a later stage where the larvae have developed a clear, overt phenotype (Fig. 3A), using a complementary approach. gch1+/– heterozygote fish were crossed to the ETvmat2:GFP transgenic reporter line which labels monoaminergic cell populations (Fig. 4C). Quantification of DAergic neurons in the DC2 and DC4/5 neurons of gch1–/–;ETvmat2:GFP and WT;ETvmat2:GFP larvae again demonstrated a similar cell count for DAergic neurons at 8 dpf (p = 0.0652, Welch's t test, F = 1.182, DFn = 30, Dfd = 30; Fig. 4D) despite the markedly abnormal neurotransmitter analysis at 8 dpf (see Fig. 3D).
GCH1 deficiency does not interact with mitochondrial complex I inhibition to exacerbate DAergic neuronal cell death
Genetic risk factors for sporadic PD may interact with exogenous toxins. Mitochondrial dysfunction is a key disease mechanism in both sporadic and familial PD. We hypothesized that a combined effect of complex I inhibition because of exposure to the classical PD neurotoxin and complex I inhibitor 1-methyl-4-phenylpyridinium (MPP+), and Gch1 deficiency may result in a more marked DAergic neuron loss after MPP+ exposure in gch1–/– than in WT siblings. WT and gch1–/– were treated at 2 dpf with MPP+ at a dose of 3 mm for 24 h. DC2 and DC4/5 DAergic neurons were then quantified at 3 dpf using th WISH as described above. MPP+ exposure had a significant effect on the number of DAergic neurons, reducing them by 25% (p < 0.0001, two-way ANOVA, n = 15 per group, F(2,56) = 0.6355), however, neither genotype nor genotype-treatment interaction had any effect (p = 0.7863; Extended Data Fig. 4-1).
Th protein is depleted in gch1−/− DAergic neurons
It has previously been demonstrated in vitro that deficiency of DA via inhibition of GCH1 or inhibition of aromatic l-amino acid decarboxylase (AADC), the enzyme responsible for conversion of L-DOPA to DA, results in phosphorylation of TH at Ser40 and subsequent degradation via the ubiquitin proteasome system (Kawahata et al., 2015). To address whether TH degradation also occurs in cases of Gch1 deficiency in vivo, we performed immunostaining on cryosections using a combination of anti-Gch1, anti-TH, and anti-GFP on 5-dpf larvae from a gch1+/–; ETvmat2:GFP incross (Fig. 4E). As predicted, we found that the DAergic neurons in gch1–/– larvae (Fig. 4E) showed reduced staining for TH protein, in addition to the anticipated loss of Gch1 staining. Staining for the Vmat2-GFP transgene, however, was normal in gch1–/– larvae. To validate this reduction in TH, we next investigated Th expression at the mRNA and protein levels. qPCR for th mRNA at 8 dpf only revealed a mild, nonsignificant change in mRNA levels between WT and gch1–/– (p = 0.2165, WT n = 5, gch1–/– n = 4, unpaired t test, F = 5.011; Fig. 4F). In contrast, Western blotting revealed a 56% reduction in protein levels of TH in gch1–/– versus WT samples (p = 0.0004, n = 5 per group, unpaired t test, F = 8.080; Fig. 4G). These results indicate that TH is being depleted at the protein level in gch1–/–, consistent with previous observations in vitro (Kawahata et al., 2015).
Treatment with L-DOPA fails to rescue reduced motility in gch1−/− larvae
DA deficiency leads to slowness of movement in both DRD and PD with excellent response to L-DOPA in DRD and typically also in the early stages of PD. As expected, there was a striking decrease in spontaneous motor activity in gch1–/– larvae compared with WT at 8 dpf (Fig. 5A,B). To determine to which extent L-DOPA could rescue movement deficits in gch1–/– and improve survival, larvae were treated with 1 mm L-DOPA from 1 to 8 dpf. The prolonged L-DOPA treatment failed to improve spontaneous swimming activity of gch1–/– (Fig. 5A,B). We additionally assessed whether treatment with L-DOPA prolongs survival of gch1–/– larvae. Treatment with L-DOPA prolonged the survival of gch1–/– larvae, with median survival increasing from 8 to 10 dpf (Fig. 5C). At 10 dpf, only 2 out of 48 (4.2%) untreated gch1–/– larvae were remaining, whereas, in the L-DOPA-treated group, 15 of 53 (28.3%) gch1–/– larvae were still alive at 10 dpf, indicating that treatment with L-DOPA is sufficient to alleviate the phenotype but only provides a partial rescue effect.
Figure 5.

The effect of L-DOPA on spontaneous motor activity in gch1–/– or WT larvae. A, Larvae from a gch1+/– incross were treated with 1 mm L-DOPA from 1 to 8 dpf. Movement analysis over alternating dark and light cycles revealed a significant decrease in distance traveled by gch1–/– versus WT when untreated (p < 0.0001). Treatment with L-DOPA failed to improve spontaneous motor activity; two-way ANOVA with eight repeated measures, WT n = 35, gch1–/– n = 38, L-DOPA WT n = 32, L-DOPA gch1–/– n = 37, F(21,966) = 3.479). B, Tracking plots from the first 5-min period of tracking show a marked difference in the distance covered by gch1–/– larvae. C, Treatment of gch1–/– larvae with 1 mm L-DOPA resulted in prolonged survival versus untreated (p = 0.0008, Gehan–Breslow–Wilcoxon test, untreated gch1–/– n = 48, L-DOPA gch1–/– n = 53). Median survival time increased from 8 dpf in untreated larvae, to 10 dpf, in treated larvae.
Gene expression analysis in gch1−/− brains reveals upregulated innate immune response
We next undertook RNAseq based transcriptome analysis to obtain further insight into the mechanistic links between GCH1 and PD. We performed RNA extraction on pooled brain samples from four biological replicates per genotype (gch1–/–, gch1+/–, and WT) at 8 dpf, and undertook whole-transcriptome analysis of these samples. PCA of the data were conducted to assess variance between the three different genotypes (Extended Data Fig. 6-1). At this stage, WT replicate 2 was identified as an outlier from the other WT samples and was excluded from all further analysis. The variance between WT and heterozygous gch1+/– samples was low, with similar clustering of the groups; conversely, gch1–/– showed distinct separation from WT and heterozygous samples on the first and second principal component.
Consistent with the PCA, only five annotated genes of all 23,457 identified transcripts were DE in gch1+/– versus WT (adj. p < 0.05, |log2FC|>1; Extended Data Fig. 6-1), all of which were upregulated. In gch1–/–, 395 annotated genes of 23,457 identified transcripts were differentially expressed (DE), 294 of which were upregulated and 101 were downregulated (Fig. 6A; see Extended Data Fig. 6-2). gch1 was identified in the group of significantly downregulated genes (log2FC = −1.27; FC = 0.41, adj. p < 0.0001), consistent with our qPCR validation of reduced gene expression (FC = 0.21, p = 0.0130; Fig. 1C). Of the five annotated DE genes in the gch1+/– dataset, two were also upregulated in gch1–/–: aftiphilin b (ENSDARG00000071347) and retinol binding protein 1 (ENSDARG00000038742).
Figure 6.

RNAseq in gch1–/– larval brain samples. A, Volcano plot showing DE genes (red) from 8 dpf gch1–/– larval brain samples (|log2foldchange| > 1, FDR p < 0.05). For gene lists, see Extended Data Figures 6-2, 6-3. B, qPCR validation of irg1l expression in gch1–/– at 3, 5, and 8 dpf. At least four biological replicates were used per genotype at each time point (Welch's two-tailed t test, 5 dpf: p = 0.034, F = 5.049, DFn = 4, Dfd = 4, 8 dpf: p = 0.0002, F = 643.4, DFn = 3, Dfd = 3). Extended Data Figure 6-1 supports this figure.
PCA. PCA of RNAseq data shows similar distribution of WT and gch1+/– samples on the first and second principal component, and distinct separation of the gch1–/– samples (green) from WT (blue) and gch1+/– samples (red). Download Figure 6-1, TIF file (146.8KB, tif) .
DE genes in gch1–/– versus WT. DE genes were defined as those meeting the following criteria: |log2FC| >1, FDR adj. p < 0.05. Genes are ranked by FC, from most upregulated to most downregulated. baseMean = mean of normalized counts of all samples. Download Figure 6-2, DOCX file (14.2KB, docx) .
DE genes in gch1–/– versus WT.c. DE genes were defined as those meeting the following criteria: |log2FC| >1, FDR adj. p < 0.05. Genes are ranked by FC, from most upregulated to most downregulated. baseMean = mean of normalized counts of all samples. Download Figure 6-3, DOCX file (104.5KB, docx) .
At the individual gene level, we noted that the most upregulated annotated transcript, the immunoresponsive gene-like 1 (irg1l) showed a striking increase in expression of 5.88 log2FC (∼59.05 FC, adj. p < 0.0001). irg1l's homolog, IRG1, has recently been described to show significant induction of expression in BCG infected mouse Gch1fl/flTie2Cre macrophage cells in comparison to WT control, and with only minimal expression present in uninfected cells (Bailey et al., 2019). Additionally, irg1l has been described to be upregulated in response to wounding and bacterial infection in zebrafish (van Soest et al., 2011; Hall et al., 2014; Shan et al., 2015). To validate upregulation of irg1l, and to assess expression over time, we performed qPCR at 3, 5, and 8 dpf, from RNA extracted from larval heads (Fig. 6B). At 3 dpf no difference was observed between WT and gch1–/–, but by 5 dpf, there was a 3.2-fold increase in expression normalized to WT (p = 0.034, Welch's two-tailed t test, 5dpf: F = 5.049, DFn = 4, Dfd = 4). By 8 dpf, expression was 55.9-fold higher than WT expression (p = 0.0002, Welch's two-tailed t test, F = 643.4, DFn = 3, Dfd = 3), consistent with the 59.1-fold increase detected by RNAseq. In addition to elevated irg1l expression, we also detected significant increases in mmp9 (6.6-fold), mmp13a (14.1-fold) and its regulator E74-like factor 3 (6.0-fold), and mmp14b (2.5-fold) in the RNAseq analysis. Furthermore, we detected increases in numerous chemokines and inflammation linked transcripts such as cxcl18b (5.0-fold), ggt5a (3.5-fold), dram1 (3.1-fold), il11a (6.3-fold), and mst1 (2.1-fold). To our knowledge, previous reports of elevated irg1l expression have been exclusively in models of infection or inflammation. Our observation of markedly upregulated irg1l expression in brain tissue of gch1–/– larvae therefore indicates innate immune activation in the brain in the absence of infection or wounding.
Microglia demonstrate morphologic and functional features of activation
Given the role of irg1l in macrophage recruitment and its marked upregulation in gch1–/–, we hypothesized that gch1–/– larvae would show evidence of microglial activation. In a quiescent state, microglia typically have long, fine ramified processes, but when activated, microglial cells may proliferate and undergo changes in cell morphology, retracting processes inwards and taking on an amoeboid cell shape with increased transcription of cytokines and other proinflammatory mediators to respond to stress.
In order to investigate microglia for signs of activation, we performed immunostaining with anti-4c4, a microglial marker, and quantified microglial number and morphology in the midbrain of WT, gch1+/– and gch1–/– larvae at 8 dpf. Counting of the microglia did not reveal differences in the number of microglial cells in the gch1–/– midbrain compared with WT (Fig. 7A,B). However, gch1–/– larvae had an increased number of amoeboid-shaped, activated microglial cells (Fig. 7A,B). In addition to assessing morphologic signs of activation, we sought to characterize the microglial cells for functional signs of activation. Zymosan is commonly used to induce sterile inflammation in experimental models, including modeling traumatic brain injury in zebrafish (Kyritsis et al., 2012). Zymosan is a glycan complex derived from yeast cell wall, which directly activates microglia/macrophages to stimulate an innate immune response (Novak and Vetvicka, 2008). Additionally, the use of zymosan is established in techniques for measuring phagocytic activity of macrophages (Suzuki et al., 1988). We performed microinjection of zymosan into the tectum of larvae at 5 dpf (Fig. 7C), and quantified the phagocytic activity of the microglia by calculating the proportion of zymosan that had been engulfed after a 6-h period. gch1–/– microglia showed increased phagocytic activity at 5 dpf compared with WT controls (Fig. 7D,E). Phagocytic efficiency was 71.1% in WT, compared with 86.8% in gch1–/– (p = 0.0096), suggesting that gch1 deficiency confers heightened innate immune response in the brain.
Figure 7.
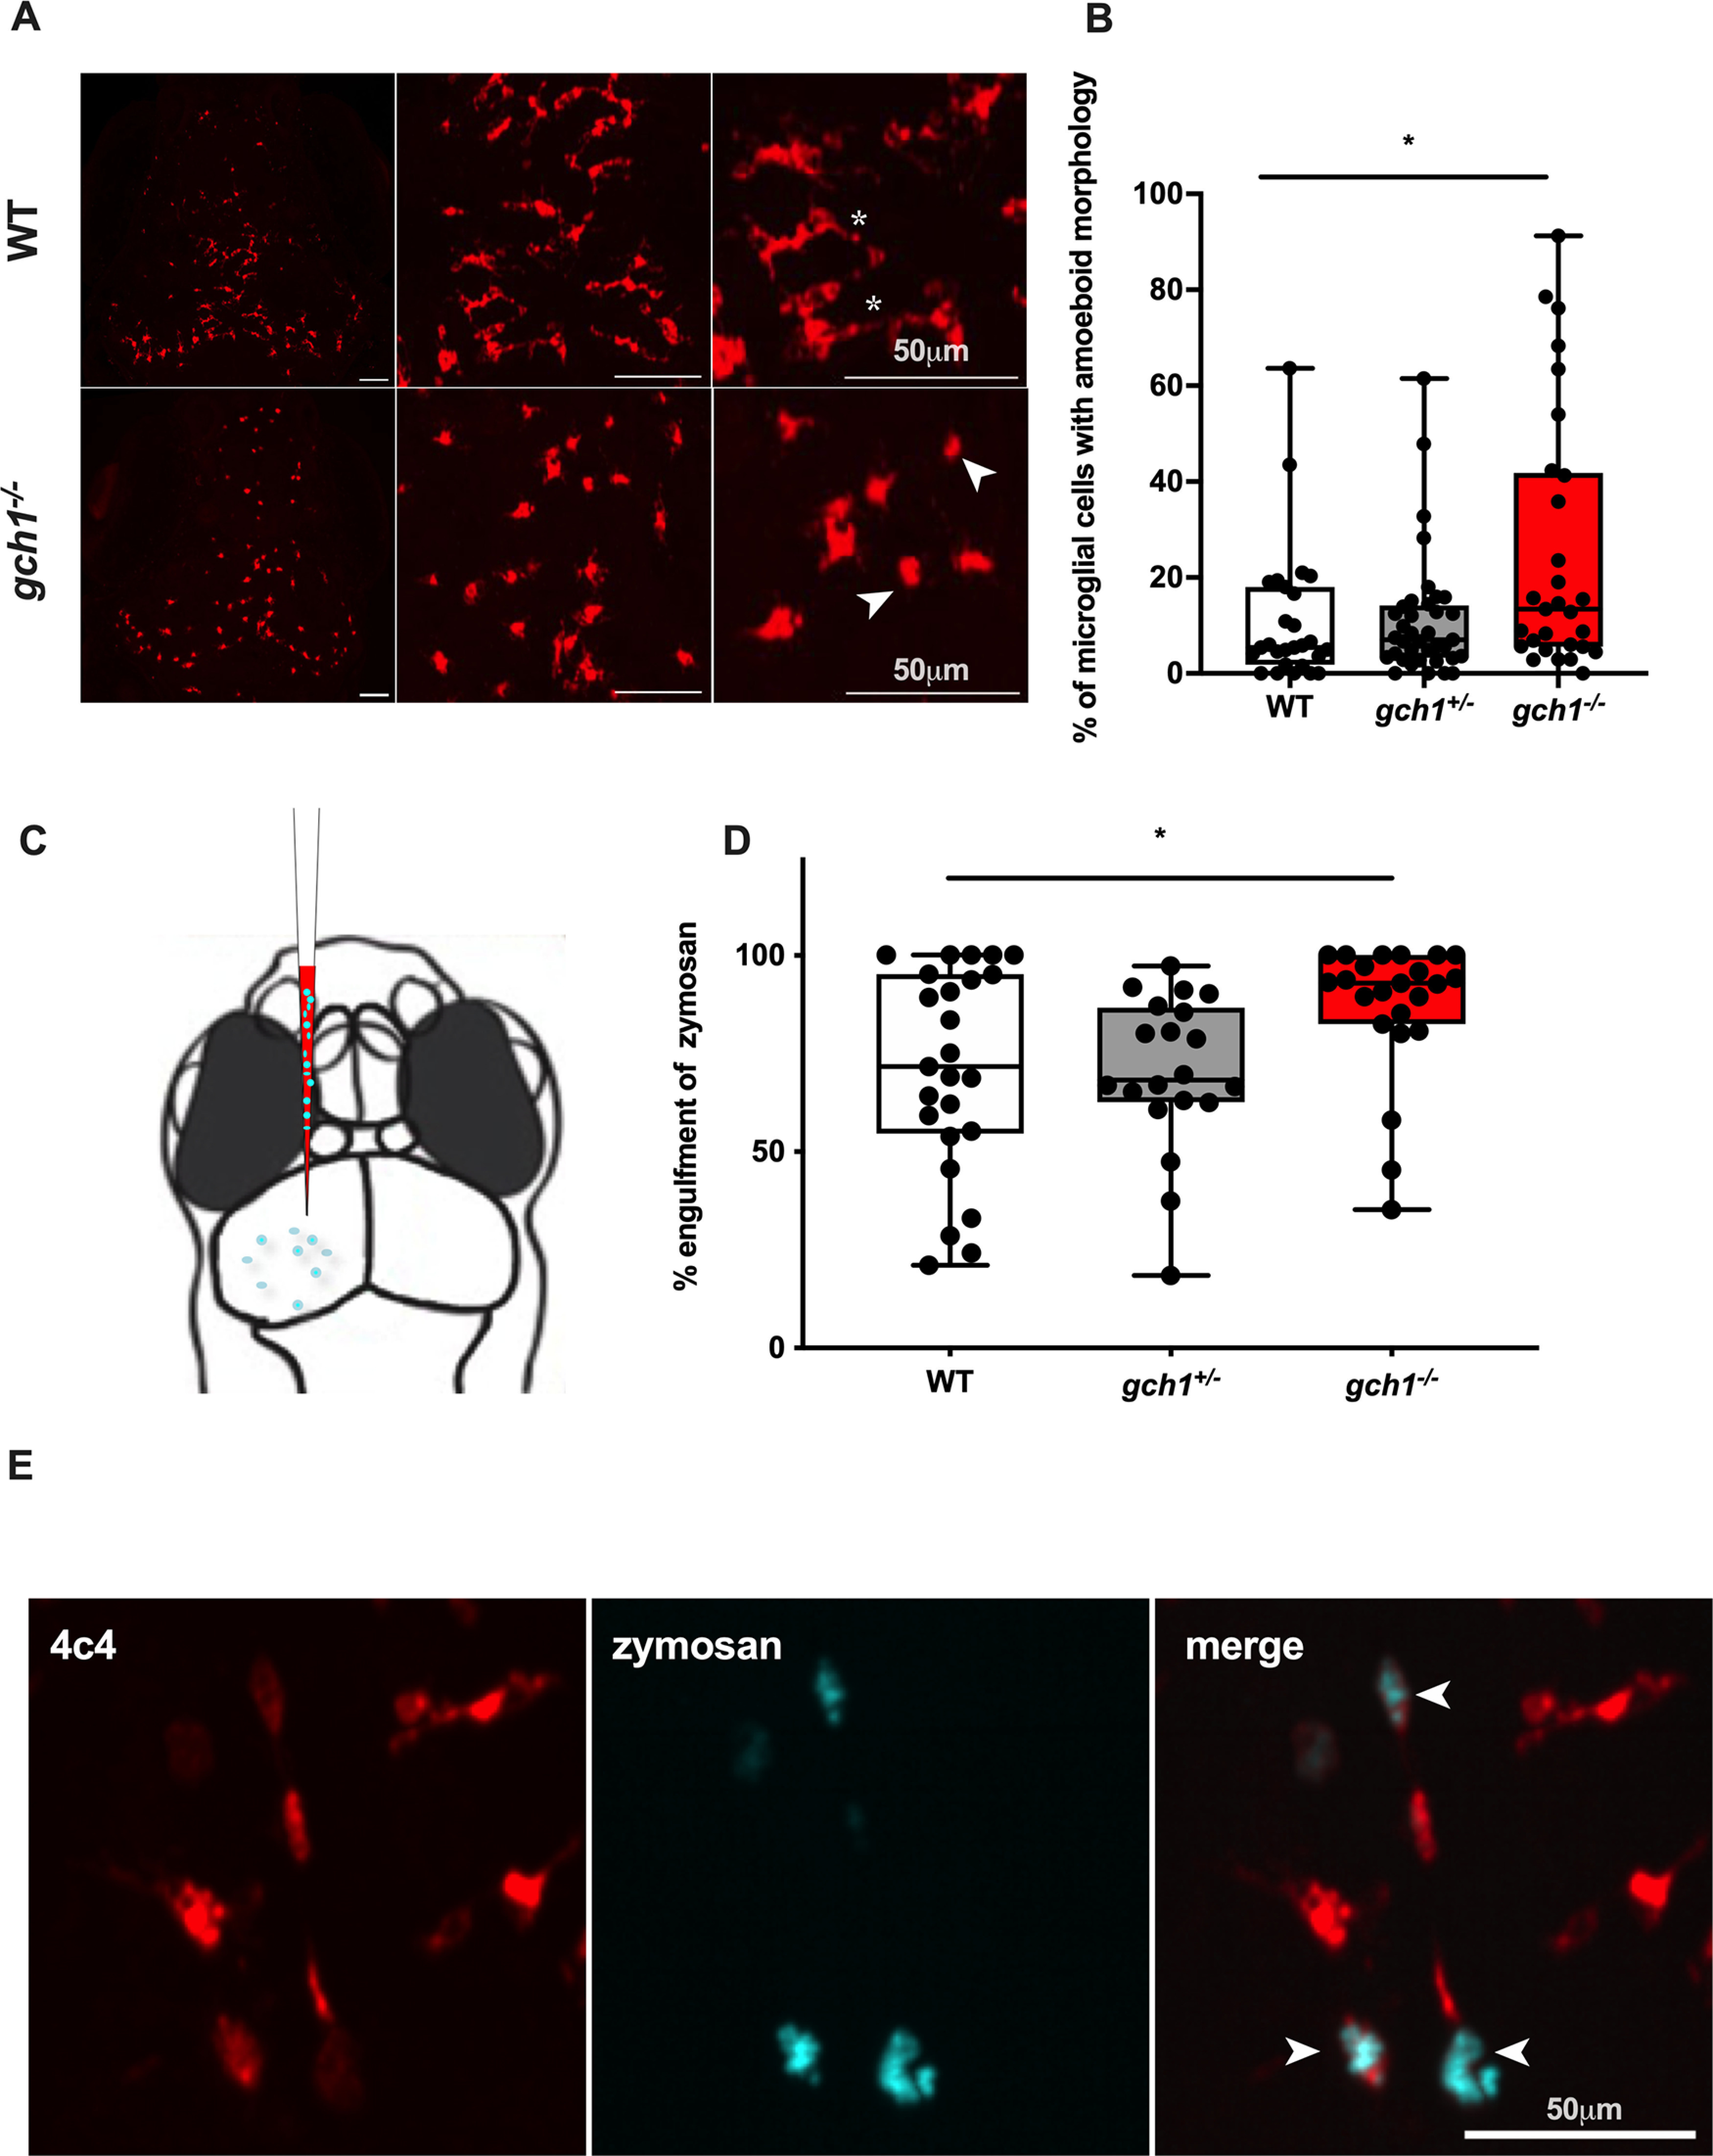
Microglial activation in gch1–/–. A, Whole-mount 4c4 immunostaining of the microglia in WT and gch1–/– larvae, at three different magnifications. Asterisks indicate ramified microglia with long processes; arrows indicate amoeboid cells with processes retracted. Scale bar: 50 µm. B, The percentage of amoeboid microglia in the brain was quantified in 4c4-immunostained larvae from a gch1+/– incross at 8 dpf. gch1–/– larvae (n = 29) showed elevated proportions of amoeboid microglia versus their WT (n = 27) and heterozygous (n = 37) sibs (p = 0.0303, Kruskal–Wallis test). C, Fluorescently-tagged zymosan was injected into the tectum of larvae from a gch1+/– incross at 5 dpf. D, gch1–/– show increased engulfment of zymosan by the microglia at 6 h after injection (p = 0.0096, Kruskal–Wallis test, WT n = 25, gch1+/– n = 20, gch1–/– n = 23). E, Representative image, depicting zymosan phagocytosed by microglia (arrows). Scale bar: 50 µm.
Discussion
An association between rare GCH1 variants and PD has now been reported by some but not replicated by others (see Rudakou et al., 2019). Mencacci and colleagues had already reported an unusually young age at onset (43.2 ± 13.4 years) in their initial report (Mencacci et al., 2014). The PD-associated GCH1 SNP variant rs11158026 may lead to an earlier age of onset by five years in those presenting with the illness before 50 years (Webb and Willette, 2017), but was not a recognized risk factor for earlier age of onset for PD at a later and thus more typical age in a GWAS study focused on the identification of factors contributing to the age of onset in PD (Blauwendraat et al., 2019). The absence of an apparent association between GCH1 coding/splice site variants or the GCH1 risk SNP and PD in some studies may therefore be because of the older age of PD patients included in these negative studies. For example, the mean age of the PD patients in an Australian study reporting “lack of reproducibility” between GCH1 polymorphisms and PD was 71 ± 10 years (Newman et al., 2014). The assumption of a selective effect of GCH1 variants in patients with earlier onset or familial, but not late onset PD is supported by the results of a recent large two-cohort case control study which applied whole genome sequencing for extensive GCH1 variant analysis (Pan et al., 2020).
The uncertainty about the pathogenicity of at least some of the GCH1 variants reported to be associated with PD (for review, see Rudakou et al., 2019) further emphasizes the need for functional studies elucidating the mechanistic links between GCH1 deficiency and nigral cell death, ideally in a suitable vertebrate animal model. Our observation of a lack of an effect of Gch1 deficiency on the number of ascending DAergic neurons is of interest for a PD susceptibility gene. We acknowledge the ongoing discussions about the precise projection of the different DAergic neuronal subpopulations in zebrafish larval brains (Tay et al., 2011). However, we had previously observed loss of DAergic neurons in the DC2, DC4/5 DAergic neuronal populations in pink1 stable mutant zebrafish larvae and parkin morpholino knock-down larvae as well as after MPP+ exposure or MG132 exposure in dj1 morpholino knock-down larvae (Bretaud et al., 2007; Flinn et al., 2009, 2013). While we were unable to demonstrate loss of function of our gch1–/– mutant line through western blot, we could confirm the mutation results in loss of function through alternative means. RNA seq and qPCR both showed a large reduction in gch1 transcript levels in our gch1–/– indicating the mutation activates nonsense-mediated decay. Our IHC demonstrated a complete absence of Gch1 protein in our gch1–/– mutants and also included a large reduction in neurotransmitters. We also acknowledge that the th probe used in our experiments only detects th1, not th2. th2 has been described as a homolog of th1, but others have suggested that the zebrafish th2 gene actually encodes a tryptophan hydroxylase and should be used as a marker of serotoninergic neurons (Chen et al., 2009; Ren et al., 2013). In any case, the lack of DAergic neuronal cell loss in the gch1–/–;ETvmat2:GFP line at 8 dpf confirmed, independently of the th1 versus th2 controversy, that Gch1 deficiency does not have a deleterious effect on DAergic neuronal survival.
It has previously been hypothesized that GCH1 deficiency and the resulting DA deficiency could directly predispose to nigral cell death (Mencacci et al., 2014); however, the results of our study do not support this hypothesis. A recent clinical study also failed to provide evidence of a neuroprotective effect of DA replacement in PD (Verschuur et al., 2019). Neuropathological studies in genetically confirmed cases of DRD typically report normal DA neuronal cell count in the SN and absence of Lewy bodies (LB). However, LB pathology with marked loss of DA neurons has been reported in a single GCH1 mutation carrier who presented with juvenile-onset DRD and parkinsonism and died at 39 years of age (Schneider and Alcalay, 2017). A further popular hypothesis is the assumption that PD GWAS risk factors may increase susceptibility to exogenous risk factors. However, gch1–/– embryos were no more susceptible to the traditional PD neurotoxin MPTP than WT controls.
Previous findings in Drosophila Punch (GCH1) mutants have demonstrated that GCH1 and TH are directly interacting binding partners, and their interaction regulates TH activity via phosphorylation (Bowling et al., 2008). Western blotting in Punch mutants has revealed no consistent evidence of depletion of TH (Krishnakumar et al., 2000). However, more recent research in PC12D cells demonstrated that inhibition of GCH1 or inhibition of AADC, the enzyme responsible for the conversion of L-DOPA to DA, both result in phosphorylation of TH at Ser40 and subsequent degradation via the ubiquitin proteasome system (Kawahata et al., 2015). TH protein levels were also markedly reduced (<3%) in the putamen of two autopsied patients with DRD (Furukawa et al., 1999). The modest effect of L-DOPA treatment on survival remains consistent with observations in the GCH1 knock-out mouse model (Douglas et al., 2015), indicating that, while supplementation with L-DOPA prolongs survival, it is not sufficient to rescue the lethality or the movement phenotype. This suggested that there may be additional pathologic mechanisms leading to premature lethality other than deficiency of monoaminergic transmitters within neurons. For example, GCH1 has been reported to be expressed in additional cell types such as microglia (Jia et al., 2021). These non-neuronal cell types could be modulating survival in response to L-DOPA.
To identify additional pathomechanisms, we undertook unbiased RNAseq analysis of larval gch1–/– brains and WT controls at 8 dpf. The second most highly upregulated annotated transcript in gch1–/– larval brains was irg1l. irg1l is relatively uncharacterized in zebrafish, but has been identified to be upregulated in response to wounding and bacterial infection. Of note, irg1 is also markedly upregulated in α-synuclein mediated microglial activation (Sarkar et al., 2020). irg1l stimulates fatty acid uptake into the mitochondria, and increases oxidation of fatty acids to stimulate mitochondrial ROS production, resulting in increased transcription of mmp9, which contributes to enhanced leukocyte recruitment (Hall et al., 2014). We also detected significantly increased expression of mmp9, mmp13a, and mmp14b, and numerous inflammatory cytokines, chemokines and inflammation-linked transcripts in gch1–/– larval brains. Elevated phagocytic efficiency in gch1–/– larvae may therefore be attributed to increased mmp9 activity, contributing to more rapid recruitment of microglia to the site of inflammation, as observed by Hall et al. (2014).
Induction of matrix metalloproteases had been previously observed in other PD model systems, primarily through neuroinflammatory mechanisms. In an MPTP-induced Parkinson's mouse model, Mmp9 expression from neurons and microglia was upregulated within 3 h of MPTP injection into the striatum (Lorenzl et al., 2004); treatment of mice with an MMP inhibitor attenuated DAergic cell death and DA depletion in the substantia nigra of MPTP-treated mice, indicating that MMP9 activity is strongly linked to neurodegeneration. Furthermore, MMP9 expression has been shown to promote glial activation and neuroinflammation, and continued inflammation and upregulation of MMP9 has been linked to exacerbated DAergic neuronal death in macaques (Annese et al., 2015).
Microglia play a key role in the resolution of inflammation and phagocytosis of damaged or misfolded proteins such as α-synuclein in PD, however, it is unclear whether microglial activation is a cause or a consequence of DAergic cell death. Postmortem histology of PD brains and PET imaging studies have revealed microglial activation both within the substantia nigra (Langston et al., 1999; Doorn et al., 2014; Stokholm et al., 2017) and widespread microglial activation throughout the brain (Gerhard et al., 2006). Neuroinflammation and activation of microglia has also been reported in different animal models of PD (Kurkowska-Jastrzebska et al., 1999; Wu et al., 2002; Barcia et al., 2004; Su et al., 2008).
We propose the mechanism for neuroinflammation and microglial activation in gch1-deficient larvae is likely mediated via decreased NO-signaling because of limited BH4 availability. A NO-dependent mechanism would be consistent with recent findings of increased microglial activation in an iNOS−/− mouse model; proliferation of microglia in the iNOS−/− mouse was repressed by application of a NO-donor, whereas inhibition of iNOS had the opposite effect (Maksoud et al., 2020). Basal NO signaling is sufficient to prevent microglial activation by preventing cell-cycle progression via a protein kinase G (PKG)-dependent mechanism. While iNOS−/− mice showed increased microglial proliferation, the total number of microglia in the cortex of WT and iNOS−/− mice was not significantly different, possibly because of higher levels of apoptosis. We likewise observed no difference in microglial number in the WT versus gch1–/– zebrafish, although we have not assessed markers of proliferation.
NO also influences the (EGFR)/RAS/MAPK signaling cascade, which modulates cell proliferation (Napoli et al., 2013) in addition to microglial motility and expression of proinflammatory cytokines IL-1β and TNFα (Qu et al., 2012). High levels of phosphorylated EGFR are associated with enhanced microglial motility and increased levels of IL-1β and TNFα, and blockade of EGFR is sufficient to attenuate microglial activation following spinal cord injury (Qu et al., 2012). Multiple potential mechanisms exist for microglial activation via a NO-mediated pathway, and further research on gch1–/– could focus on whether lack of NO signaling is responsible for microglial activation, and whether supplementation of NO is capable of attenuating neuroinflammation. Our observation of microglial activation, in the absence of neuronal loss, suggests that GCH1 deficiency contributes to chronic neuroinflammation and production of proinflammatory mediators which might lead to increased susceptibility to DAergic denervation over time.
Footnotes
This work was supported by Parkinson's UK Grants G1404 and G1704 and Medical Research Council (MRC) Grants MR/R011354/1 and MR/M006646/1. This work was also supported by the National Institute for Health Research Sheffield Biomedical Research Center (BRC). R.B.M. was supported by the Biotechnology and Biological Sciences Research Council (BBSRC) Grant BB/S010386/1. S.T.S. was supported by the BBSRC grant BB/M002322/1. This work was part-funded by the Wellcome Trust (ref: 105624) through the Center for Chronic Diseases and Disorders (C2D2) at the University of York. S.T.S. was also supported by the Jared Cartwright and Mick Miller from the Protein Production Laboratory at the Technology Facility, Department of Biology, University of York, United Kingdom.
The authors declare no competing financial interests.
References
- Annese V, Herrero MT, Di Pentima M, Gomez A, Lombardi L, Ros CM, De Pablos V, Fernandez-Villalba E, De Stefano ME (2015) Metalloproteinase-9 contributes to inflammatory glia activation and nigro-striatal pathway degeneration in both mouse and monkey models of 1-methyl-4-phenyl-1,2,3,6-tetrahydropyridine (MPTP)-induced Parkinsonism. Brain Struct Funct 220:703–727. 10.1007/s00429-014-0718-8 [DOI] [PubMed] [Google Scholar]
- Bailey JD, Diotallevi M, Nicol T, McNeill E, Shaw A, Chuaiphichai S, Hale A, Starr A, Nandi M, Stylianou E, McShane H, Davis S, Fischer R, Kessler BM, McCullagh J, Channon KM, Crabtree MJ (2019) Nitric oxide modulates metabolic remodeling in inflammatory macrophages through TCA cycle regulation and itaconate accumulation. Cell Rep 28:218–230. 10.1016/j.celrep.2019.06.018 [DOI] [PMC free article] [PubMed] [Google Scholar]
- Barcia C, Sánchez Bahillo A, Fernández-Villalba E, Bautista V, Poza Y Poza M, Fernández-Barreiro A, Hirsch EC, Herrero MT (2004) Evidence of active microglia in substantia nigra pars compacta of parkinsonian monkeys 1 year after MPTP exposure. Glia 46:402–409. 10.1002/glia.20015 [DOI] [PubMed] [Google Scholar]
- Blauwendraat C, Heilbron K, Vallerga CL, Bandres-Ciga S, von Coelln R, Pihlstrøm L, Simón-Sánchez J, Schulte C, Sharma M, Krohn L, Siitonen A, Iwaki H, Leonard H, Noyce AJ, Tan M, Gibbs JR, Hernandez DG, Scholz SW, Jankovic J, Shulman LM, et al. (2019) Parkinson's disease age at onset genome-wide association study: defining heritability, genetic loci, and α-synuclein mechanisms. Mov Disord 34:866–875. 10.1002/mds.27659 [DOI] [PMC free article] [PubMed] [Google Scholar]
- Bowling KM, Huang Z, Xu D, Ferdousy F, Funderburk CD, Karnik N, Neckameyer W, O'Donnell JM (2008) Direct binding of GTP cyclohydrolase and tyrosine hydroxylase: regulatory interactions between key enzymes in dopamine biosynthesis. J Biol Chem 283:31449–31459. 10.1074/jbc.M802552200 [DOI] [PMC free article] [PubMed] [Google Scholar]
- Bretaud S, Allen C, Ingham PW, Bandmann O (2007) p53-dependent neuronal cell death in a DJ-1-deficient zebrafish model of Parkinson's disease. J Neurochem 100:1626–1635. [DOI] [PubMed] [Google Scholar]
- Cario CL, Farrell TC, Milanese C, Burton EA (2011) Automated measurement of zebrafish larval movement. J Physiol 589:3703–3708. 10.1113/jphysiol.2011.207308 [DOI] [PMC free article] [PubMed] [Google Scholar]
- Chen YC, Priyadarshini M, Panula P (2009) Complementary developmental expression of the two tyrosine hydroxylase transcripts in zebrafish. Histochem Cell Biol 132:375–381. 10.1007/s00418-009-0619-8 [DOI] [PubMed] [Google Scholar]
- Dina C, Bouatia-Naji N, Tucker N, Delling FN, Toomer K, Durst R, Perrocheau M, Fernandez-Friera L, Solis J, Le Tourneau T, Chen MH, Probst V, Bosse Y, Pibarot P, Zelenika D, Lathrop M, Hercberg S, Roussel R, Benjamin EJ, Bonnet F, et al. (2015) Genetic association analyses highlight biological pathways underlying mitral valve prolapse. Nat Genet 47:1206–1211. 10.1038/ng.3383 [DOI] [PMC free article] [PubMed] [Google Scholar]
- Doorn KJ, Moors T, Drukarch B, van de Berg WD, Lucassen PJ, van Dam A-M (2014) Microglial phenotypes and toll-like receptor 2 in the substantia nigra and hippocampus of incidental Lewy body disease cases and Parkinson's disease patients. Acta Neuropathol Commun 2:90. [DOI] [PMC free article] [PubMed] [Google Scholar]
- Douglas G, Hale AB, Crabtree MJ, Ryan BJ, Hansler A, Watschinger K, Gross SS, Lygate CA, Alp NJ, Channon KM (2015) A requirement for Gch1 and tetrahydrobiopterin in embryonic development. Dev Biol 399:129–138. 10.1016/j.ydbio.2014.12.025 [DOI] [PMC free article] [PubMed] [Google Scholar]
- Durinck S, Spellman PT, Birney E, Huber W (2009) Mapping identifiers for the integration of genomic datasets with the R/Bioconductor package biomaRt. Nat Protoc 4:1184–1191. 10.1038/nprot.2009.97 [DOI] [PMC free article] [PubMed] [Google Scholar]
- Flinn L, Mortiboys H, Volkmann K, Köster RW, Ingham PW, Bandmann O (2009) Complex I deficiency and dopaminergic neuronal cell loss in parkin-deficient zebrafish (Danio rerio). Brain 132:1613–1623. 10.1093/brain/awp108 [DOI] [PubMed] [Google Scholar]
- Flinn LJ, Keatinge M, Bretaud S, Mortiboys H, Matsui H, De Felice E, Woodroof HI, Brown L, McTighe A, Soellner R, Allen CE, Heath PR, Milo M, Muqit MMK, Reichert AS, Köster RW, Ingham PW, Bandmann O (2013) TigarB causes mitochondrial dysfunction and neuronal loss in PINK1 deficiency. Ann Neurol 74:837–847. 10.1002/ana.23999 [DOI] [PMC free article] [PubMed] [Google Scholar]
- Furukawa Y, Nygaard TG, Gütlich M, Rajput AH, Pifl C, DiStefano L, Chang LJ, Price K, Shimadzu M, Hornykiewicz O, Haycock JW, Kish SJ (1999) Striatal biopterin and tyrosine hydroxylase protein reduction in dopa-responsive dystonia. Neurology 53:1032–1041. 10.1212/WNL.53.5.1032 [DOI] [PubMed] [Google Scholar]
- Gerhard A, Pavese N, Hotton G, Turkheimer F, Es M, Hammers A, Eggert K, Oertel W, Banati RB, Brooks DJ (2006) In vivo imaging of microglial activation with [11C](R)-PK11195 PET in idiopathic Parkinson's disease. Neurobiol Dis 21:404–412. 10.1016/j.nbd.2005.08.002 [DOI] [PubMed] [Google Scholar]
- Gorski M, Tin A, Garnaas M, McMahon GM, Chu AY, Tayo BO, Pattaro C, Teumer A, Chasman DI, Chalmers J, Hamet P, Tremblay J, Woodward M, Aspelund T, Eiriksdottir G, Gudnason V, Harris TB, Launer LJ, Smith AV, Mitchell BD, et al. (2015) Genome-wide association study of kidney function decline in individuals of European descent. Kidney Int 87:1017–1029. 10.1038/ki.2014.361 [DOI] [PMC free article] [PubMed] [Google Scholar]
- Hall CJ, Boyle RH, Sun X, Wicker SM, Misa JP, Krissansen GW, Print CG, Crosier KE, Crosier PS (2014) Epidermal cells help coordinate leukocyte migration during inflammation through fatty acid-fuelled matrix metalloproteinase production. Nat Commun 5:1–17. [DOI] [PubMed] [Google Scholar]
- Hruscha A, Krawitz P, Rechenberg A, Heinrich V, Hecht J, Haass C, Schmid B (2013) Efficient CRISPR/Cas9 genome editing with low off-target effects in zebrafish. Development 140:4982–4987. [DOI] [PubMed] [Google Scholar]
- Ichinose H, Ohye T, Takahashi E, Seki N, Hori T, Segawa M, Nomura Y, Endo K, Tanaka H, Tsuji S (1994) Hereditary progressive dystonia with marked diurnal fluctuation caused by mutations in the GTP cyclohydrolase I gene. Nat Genet 8:236–242. 10.1038/ng1194-236 [DOI] [PubMed] [Google Scholar]
- Inoue D, Wittbrodt J (2011) One for all-a highly efficient and versatile method for fluorescent immunostaining in fish embryos. PLoS One 6:e19713. 10.1371/journal.pone.0019713 [DOI] [PMC free article] [PubMed] [Google Scholar]
- Jay M, De Faveri F, McDearmid JR (2015) Firing dynamics and modulatory actions of supraspinal dopaminergic neurons during zebrafish locomotor behavior. Curr Biol 25:435–444. [DOI] [PMC free article] [PubMed] [Google Scholar]
- Jeon BS, Jeong JM, Park SS, Kim JM, Chang YS, Song HC, Kim KM, Yoon KY, Lee MC, Lee SB (1998) Dopamine transporter density measured by [123I]β-CIT single-photon emission computed tomography is normal in dopa-responsive dystonia. Ann Neurol 43:792–800. 10.1002/ana.410430614 [DOI] [PubMed] [Google Scholar]
- Jia S, Chen G, Liang Y, Liang X, Meng C (2021) GCH1-regulated miRNAs are potential targets for microglial activation in neuropathic pain. Biosci Rep 41:BSR20210051. [DOI] [PMC free article] [PubMed] [Google Scholar]
- Kapatos G (2013) The neurobiology of tetrahydrobiopterin biosynthesis: a model for regulation of GTP cyclohydrolase I gene transcription within nigrostriatal dopamine neurons. IUBMB Life 65:323–333. 10.1002/iub.1140 [DOI] [PubMed] [Google Scholar]
- Kawahata I, Ohtaku S, Tomioka Y, Ichinose H, Yamakuni T (2015) Dopamine or biopterin deficiency potentiates phosphorylation at (40)Ser and ubiquitination of tyrosine hydroxylase to be degraded by the ubiquitin proteasome system. Biochem Biophys Res Commun 465:53–58. 10.1016/j.bbrc.2015.07.125 [DOI] [PubMed] [Google Scholar]
- Keatinge M, Bui H, Menke A, Chen YC, Sokol AM, Bai Q, Ellett F, Da Costa M, Burke D, Gegg M, Trollope L, Payne T, McTighe A, Mortiboys H, de Jager S, Nuthall H, Kuo MS, Fleming A, Schapira AHV, Renshaw SA, et al. (2015) Glucocerebrosidase 1 deficient Danio rerio mirror key pathological aspects of human Gaucher disease and provide evidence of early microglial activation preceding alpha-synuclein-independent neuronal cell death. Hum Mol Genet 24:6640–6666. 10.1093/hmg/ddv369 [DOI] [PMC free article] [PubMed] [Google Scholar]
- Krishnakumar S, Burton D, Rasco J, Chen X, O'Donnell J (2000) Functional interactions between GTP cyclohydrolase I and tyrosine hydroxylase in Drosophila. J Neurogenet 14:1–23. 10.3109/01677060009083474 [DOI] [PubMed] [Google Scholar]
- Kurkowska-Jastrzebska I, Wrońska A, Kohutnicka M, Członkowski A, Członkowska A (1999) The inflammatory reaction following 1-methyl-4-phenyl-1,2,3,6-tetrahydropyridine intoxication in mouse. Exp Neurol 156:50–61. 10.1006/exnr.1998.6993 [DOI] [PubMed] [Google Scholar]
- Kyritsis N, Kizil C, Zocher S, Kroehne V, Kaslin J, Freudenreich D, Iltzsche A, Brand M (2012) Acute inflammation initiates the regenerative response in the adult zebrafish brain. Science 338:1353–1356. 10.1126/science.1228773 [DOI] [PubMed] [Google Scholar]
- Langston JW, Forno LS, Tetrud J, Reeves AG, Kaplan JA, Karluk D (1999) Evidence of active nerve cell degeneration in the substantia nigra of humans years after 1-methyl-4-phenyl-1,2,3,6-tetrahydropyridine exposure. Ann Neurol 46:598–605. [DOI] [PubMed] [Google Scholar]
- Liu LY, Fox CS, North TE, Goessling W (2013) Functional validation of GWAS gene candidates for abnormal liver function during zebrafish liver development. Dis Model Mech 6:1271–1278. [DOI] [PMC free article] [PubMed] [Google Scholar]
- Lorenzl S, Calingasan N, Yang L, Albers DS, Shugama S, Gregorio J, Krell HW, Chirichigno J, Joh T, Beal MF (2004) Matrix metalloproteinase-9 is elevated in 1-methyl-4-phenyl-1,2,3,6-tetrahydropyridine-induced Parkinsonism in mice. Neuromolecular Med 5:119–131. 10.1385/NMM:5:2:119 [DOI] [PubMed] [Google Scholar]
- Love MI, Huber W, Anders S (2014) Moderated estimation of fold change and dispersion for RNA-seq data with DESeq2. Genome Biol 15:550. 10.1186/s13059-014-0550-8 [DOI] [PMC free article] [PubMed] [Google Scholar]
- Maksoud MJE, Tellios V, Xiang YY, Lu WY (2020) Nitric oxide signaling inhibits microglia proliferation by activation of protein kinase-G. Nitric Oxide 94:125–134. 10.1016/j.niox.2019.11.005 [DOI] [PubMed] [Google Scholar]
- Mencacci NE, Isaias IU, Reich MM, Ganos C, Plagnol V, Polke JM, Bras J, Hersheson J, Stamelou M, Pittman AM, Noyce AJ, Mok KY, Opladen T, Kunstmann E, Hodecker S, Münchau A, Volkmann J, Samnick S, Sidle K, Nanji T, et al. (2014) Parkinson's disease in GTP cyclohydrolase 1 mutation carriers. Brain 137:2480–2492. 10.1093/brain/awu179 [DOI] [PMC free article] [PubMed] [Google Scholar]
- Nalls MA, Pankratz N, Lill CM, Do CB, Hernandez DG, Saad M, Destefano AL, Kara E, Bras J, Sharma M, Schulte C, Keller MF, Arepalli S, Letson C, Edsall C, Stefansson H, Liu X, Pliner H, Lee JH, Cheng R, et al. (2014) Large-scale meta-analysis of genome-wide association data identifies six new risk loci for Parkinson's disease. Nat Genet 46:989–993. [DOI] [PMC free article] [PubMed] [Google Scholar]
- Nalls MA, Blauwendraat C, Vallerga CL, Heilbron K, Bandres-Ciga S, Chang D, Tan M, Kia DA, Noyce AJ, Xue A, Bras J, Young E, von Coelln R, Simón-Sánchez J, Schulte C, Sharma M, Krohn L, Pihlstrøm L, Siitonen A, Iwaki H, et al. (2019) Identification of novel risk loci, causal insights, and heritable risk for Parkinson's disease: a meta-analysis of genome-wide association studies. Lancet Neurol 18:1091–1102. [DOI] [PMC free article] [PubMed] [Google Scholar]
- Napoli C, Paolisso G, Casamassimi A, Al-Omran M, Barbieri M, Sommese L, Infante T, Ignarro LJ (2013) Effects of nitric oxide on cell proliferation: novel insights. J Am Coll Cardiol 62:89–95. 10.1016/j.jacc.2013.03.070 [DOI] [PubMed] [Google Scholar]
- Newman JRB, Todorovic M, Silburn PA, Sutherland GT, Mellick GD (2014) Lack of reproducibility in re-evaluating associations between GCH1 polymorphisms and Parkinson's disease and isolated dystonia in an Australian case–control group. Parkinsonism Relat Disord 20:668–670. 10.1016/j.parkreldis.2014.02.014 [DOI] [PubMed] [Google Scholar]
- Novak M, Vetvicka V (2008) Beta-glucans, history, and the present: immunomodulatory aspects and mechanisms of action. J Immunotoxicol 5:47–57. 10.1080/15476910802019045 [DOI] [PubMed] [Google Scholar]
- Pan HX, Zhao YW, Mei JP, Fang ZH, Wang Y, Zhou X, Zhou YJ, Zhang R, Zhang KL, Jiang L (2020) GCH1 variants contribute to the risk and earlier age-at-onset of Parkinson's disease: a two-cohort case-control study. Transl Neurodegener 9:31. [DOI] [PMC free article] [PubMed] [Google Scholar]
- Patro R, Duggal G, Love MI, Irizarry RA, Kingsford C (2017) Salmon provides fast and bias-aware quantification of transcript expression. Nat Methods 14:417–419. [DOI] [PMC free article] [PubMed] [Google Scholar]
- Pelletier I, Bally-Cuif L, Ziegler I (2001) Cloning and developmental expression of zebrafish GTP cyclohydrolase I. Mech Dev 109:99–103. 10.1016/S0925-4773(01)00516-0 [DOI] [PubMed] [Google Scholar]
- Qu WS, Tian DS, Guo ZB, Fang J, Zhang Q, Yu ZY, Xie MJ, Zhang HQ, Lü JG, Wang W (2012) Inhibition of EGFR/MAPK signaling reduces microglial inflammatory response and the associated secondary damage in rats after spinal cord injury. J Neuroinflammation 9:178. [DOI] [PMC free article] [PubMed] [Google Scholar]
- Rajput AH, Gibb WR, Zhong XH, Shannak KS, Kish S, Chang LG, Hornykiewicz O (1994) Dopa-responsive dystonia: pathological and biochemical observations in a case. Ann Neurol 35:396–402. 10.1002/ana.410350405 [DOI] [PubMed] [Google Scholar]
- Ren G, Li S, Zhong H, Lin S (2013) Zebrafish tyrosine hydroxylase 2 gene encodes tryptophan hydroxylase. J Biol Chem 288:22451–22459. [DOI] [PMC free article] [PubMed] [Google Scholar]
- Rink E, Wullimann MF (2002) Development of the catecholaminergic system in the early zebrafish brain: an immunohistochemical study. Brain Res Dev Brain Res 137:89–100. 10.1016/S0165-3806(02)00354-1 [DOI] [PubMed] [Google Scholar]
- Rudakou U, Ouled Amar Bencheikh B, Ruskey JA, Krohn L, Laurent SB, Spiegelman D, Liong C, Fahn S, Waters C, Monchi O, Fon EA, Dauvilliers Y, Alcalay RN, Dupré N, Gan-Or Z (2019) Common and rare GCH1 variants are associated with Parkinson's disease. Neurobiol Aging 73:231.e1–231.e6. 10.1016/j.neurobiolaging.2018.09.008 [DOI] [PMC free article] [PubMed] [Google Scholar]
- Sallinen V, Sundvik M, Reenilä I, Peitsaro N, Khrustalyov D, Anichtchik O, Toleikyte G, Kaslin J, Panula P (2009) Hyperserotonergic phenotype after monoamine oxidase inhibition in larval zebrafish. J Neurochem 109:403–415. [DOI] [PubMed] [Google Scholar]
- Sarkar S, Dammer EB, Malovic E, Olsen AL, Raza SA, Gao T, Xiao H, Oliver DL, Duong D, Joers V, Seyfried N, Huang M, Kukar T, Tansey MG, Kanthasamy AG, Rangaraju S (2020) Molecular signatures of neuroinflammation induced by αsynuclein aggregates in microglial cells. Front Immunol 11:33. 10.3389/fimmu.2020.00033 [DOI] [PMC free article] [PubMed] [Google Scholar]
- Schneider SA, Alcalay RN (2017) Neuropathology of genetic synucleinopathies with parkinsonism: review of the literature. Mov Disord 32:1504–1523. 10.1002/mds.27193 [DOI] [PMC free article] [PubMed] [Google Scholar]
- Schrag A, Ben-Shlomo Y, Quinn NP (2000) Cross sectional prevalence survey of idiopathic Parkinson's disease and Parkinsonism in London. BMJ 321:21–22. 10.1136/bmj.321.7252.21 [DOI] [PMC free article] [PubMed] [Google Scholar]
- Shan Y, Fang C, Cheng C, Wang Y, Peng J, Fang W (2015) Immersion infection of germ-free zebrafish with Listeria monocytogenes induces transient expression of innate immune response genes. Front Microbiol 6:373. 10.3389/fmicb.2015.00373 [DOI] [PMC free article] [PubMed] [Google Scholar]
- Shimoji M, Hirayama K, Hyland K, Kapatos G (1999) GTP cyclohydrolase I gene expression in the brains of male and female hph-1 mice. J Neurochem 72:757–764. 10.1046/j.1471-4159.1999.0720757.x [DOI] [PubMed] [Google Scholar]
- Snow BJ, Nygaard TG, Takahashi H, Calne DB (1993) Positron emission tomographic studies of dopa-responsive dystonia and early-onset idiopathic parkinsonism. Ann Neurol 34:733–738. 10.1002/ana.410340518 [DOI] [PubMed] [Google Scholar]
- Stokholm MG, Iranzo A, Østergaard K, Serradell M, Otto M, Svendsen KB, Garrido A, Vilas D, Borghammer P, Santamaria J, Møller A, Gaig C, Brooks DJ, Tolosa E, Pavese N (2017) Assessment of neuroinflammation in patients with idiopathic rapid-eye-movement sleep behaviour disorder: a case-control study. Lancet. Neurol 16:789–796. 10.1016/S1474-4422(17)30173-4 [DOI] [PubMed] [Google Scholar]
- Su X, Maguire-Zeiss KA, Giuliano R, Prifti L, Venkatesh K, Federoff HJ (2008) Synuclein activates microglia in a model of Parkinson's disease. Neurobiol Aging 29:1690–1701. 10.1016/j.neurobiolaging.2007.04.006 [DOI] [PMC free article] [PubMed] [Google Scholar]
- Suzuki I, Tanaka H, Adachi Y, Yadomae T (1988) Rapid measurement of phagocytosis by macrophages. Chem Pharm Bull (Tokyo) 36:4871–4875. 10.1248/cpb.36.4871 [DOI] [PubMed] [Google Scholar]
- Tay TL, Ronneberger O, Ryu S, Nitschke R, Driever W (2011) Comprehensive catecholaminergic projectome analysis reveals single-neuron integration of zebrafish ascending and descending dopaminergic systems. Nat Commun 2:171. [DOI] [PMC free article] [PubMed] [Google Scholar]
- Thisse C, Thisse B (2008) High-resolution in situ hybridization to whole-mount zebrafish embryos. Nat Protoc 3:59–69. 10.1038/nprot.2007.514 [DOI] [PubMed] [Google Scholar]
- Turjanski N, Bhatia K, Burn DJ, Sawle GV, Marsden CD, Brooks DJ (1993) Comparison of striatal 18F-dopa uptake in adult-onset dystonia-parkinsonism, Parkinson's disease, and dopa-responsive dystonia. Neurology 43:1563–1563. 10.1212/wnl.43.8.1563 [DOI] [PubMed] [Google Scholar]
- van Soest JJ, Stockhammer OW, Ordas A, Bloemberg GV, Spaink HP, Meijer AH (2011) Comparison of static immersion and intravenous injection systems for exposure of zebrafish embryos to the natural pathogen Edwardsiella tarda. BMC Immunol 12:58. 10.1186/1471-2172-12-58 [DOI] [PMC free article] [PubMed] [Google Scholar]
- Verschuur CVM, Suwijn SR, Boel JA, Post B, Bloem BR, van Hilten JJ, van Laar T, Tissingh G, Munts AG, Deuschl G, Lang AE, Dijkgraaf MGW, de Haan RJ, de Bie RMA; LEAP Study Group (2019) Randomized delayed-start trial of levodopa in Parkinson's disease. N Engl J Med 380:315–324. 10.1056/NEJMoa1809983 [DOI] [PubMed] [Google Scholar]
- Webb J, Willette AA (2017) Aging modifies the effect of GCH1 RS11158026 on DAT uptake and Parkinson's disease clinical severity. Neurobiol Aging 50:39–46. 10.1016/j.neurobiolaging.2016.10.006 [DOI] [PMC free article] [PubMed] [Google Scholar]
- Wu DC, Jackson-Lewis V, Vila M, Tieu K, Teismann P, Vadseth C, Choi D-K, Ischiropoulos H, Przedborski S (2002) Blockade of microglial activation is neuroprotective in the 1-methyl-4-phenyl-1,2,3,6-tetrahydropyridine mouse model of Parkinson disease. J Neurosci 22:1763–1771. 10.1523/JNEUROSCI.22-05-01763.2002 [DOI] [PMC free article] [PubMed] [Google Scholar]
Associated Data
This section collects any data citations, data availability statements, or supplementary materials included in this article.
Supplementary Materials
Synteny map of the human GCH1 and zebrafish gch1 genes. Zebrafish gch1 retains conserved synteny with human GCH1, with preserved colocalization with the genes SAMD4A, WDHD1, and SOCS4. Download Figure 1-1, TIF file (3.1MB, tif) .
Additional metabolites measure by HPLC in 8-dpf gch1 genotypes. HPLC analysis of metabolites at 8dpf demonstrated gch1–/– have large reductions in 5-HIAA (p = 0.0226) and 3-MT (p < 0.0001) compared to WT (n = 3, two-way ANOVA, Dunnett's multiple comparison test, F(6,24) = 16.32). Download Figure 3-1, TIF file (100.7KB, tif) .
Neurotransmitter levels in adult gch1+/– brains. No perturbations were detected in DA or serotonin in adult brain samples from gch1+/– fish and their WT sibling controls. Noradrenaline showed a modest 12% reduction in gch1+/– versus WT (78.2 vs 88.7 pmol/mg, p = 0.0015, n = 5, two-way ANOVA, Dunnett's multiple comparison test, F(7,64) =1.814). Adrenaline was measured but not detected (n = 5, two-way ANOVA). No significant changes were observed in the DA breakdown products DOPAC, 5-HIAA, HVA, or 3-MT. Download Figure 3-2, TIF file (134.8KB, tif) .
MPP+ susceptibility in gch–/– larvae. Larvae from a gch1+/– incross were treated at 2 dpf with 3 mm MPP+ for 24 h. Quantification of th+ neurons revealed a decrease in neuron counts in MPP+-treated larvae of 25% (p < 0.0001, two-way anova, F(2,56) = 0.6355), however no effect of genotype on neuron counts (p = 0.7863); n = 15 per group. Download Figure 4-1, TIF file (111.1KB, tif) .
PCA. PCA of RNAseq data shows similar distribution of WT and gch1+/– samples on the first and second principal component, and distinct separation of the gch1–/– samples (green) from WT (blue) and gch1+/– samples (red). Download Figure 6-1, TIF file (146.8KB, tif) .
DE genes in gch1–/– versus WT. DE genes were defined as those meeting the following criteria: |log2FC| >1, FDR adj. p < 0.05. Genes are ranked by FC, from most upregulated to most downregulated. baseMean = mean of normalized counts of all samples. Download Figure 6-2, DOCX file (14.2KB, docx) .
DE genes in gch1–/– versus WT.c. DE genes were defined as those meeting the following criteria: |log2FC| >1, FDR adj. p < 0.05. Genes are ranked by FC, from most upregulated to most downregulated. baseMean = mean of normalized counts of all samples. Download Figure 6-3, DOCX file (104.5KB, docx) .