Abstract
Background
Patients with recurrent glioblastoma (GBM) are often treated with antiangiogenic agents, such as bevacizumab (BEV). Despite therapeutic promise, conventional MRI methods fail to help determine which patients may not benefit from this treatment.
Purpose
To use MR spectroscopic imaging (MRSI) with intermediate and short echo time to measure corrected myo-inositol (mI)normalized by contralateral creatine (hereafter, mI/c-Cr) in participants with recurrent GBM treated with BEV and to investigate whether such measurements can help predict survivorship before BEV initiation (baseline) and at 1 day, 4 weeks, and 8 weeks thereafter.
Materials and Methods
In this prospective longitudinal study (2016–2020), spectroscopic data on mI—a glial marker and osmoregulator within the brain—normalized by contralateral creatine in the intratumoral, contralateral, and peritumoral volumes of patients with recurrent GBM were evaluated. Area under the receiver operating characteristic curve (AUC) was calculated for all volumes at baseline and 1 day, 4 weeks, and 8 weeks after treatment to determine the ability of mI/c-Cr to help predict survivorship.
Results
Twenty-one participants (median age ± standard deviation, 62 years ± 12; 15 men) were evaluated. Lower mI/c-Cr in the tumor before and during BEV treatment was predictive of poor survivorship, with receiver operating characteristic analyses showing an AUC of 0.75 at baseline, 0.87 at 1 day after treatment, and 1 at 8 weeks after. A similar result was observed in contralateral normal-appearing tissue and the peritumoral volume, with shorter-term survivors having lower levels of mI/c-Cr. In the contralateral volume, a lower ratio of mI to creatine (hereafter, mI/Cr) predicted shorter-term survival at baseline and all other time points. Within the peritumoral volume, lower mI/c-Cr levels were predictive of shorter-term survival at baseline (AUC, 0.80), at 1 day after treatment (AUC, 0.93), and at 4 weeks after treatment (AUC, 0.68).
Conclusion
Lower levels of myo-inositol normalized by contralateral creatine within intratumoral, contralateral, and peritumoral volumes were predictive of poor survivorship and antiangiogenic treatment failure as early as before bevacizumab treatment. Adapting MR spectroscopic imaging alongside conventional MRI modalities conveys critical information regarding the biologic characteristics of tumors to help better treat individuals with recurrent glioblastoma.
Clinical trial registration no. NCT02843230
© RSNA, 2021
Summary
Lower levels of intratumoral and contralateral myo-inositol were predictive of antiangiogenic treatment failure and poor survivorship before and during bevacizumab therapy.
Key Results
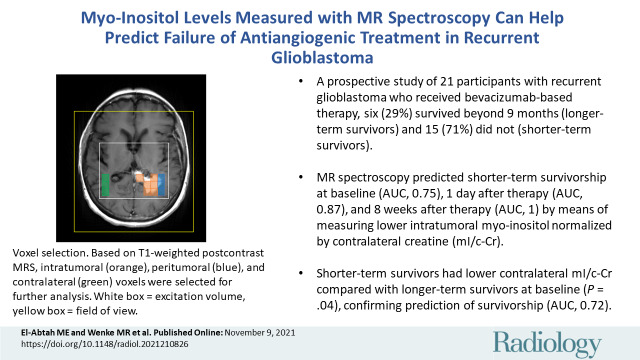
■ In a prospective study of 21 participants with recurrent glioblastoma who received bevacizumab-based therapy, six (29%) survived beyond 9 months (longer-term survivors) and 15 (71%) did not (shorter-term survivors).
■ MR spectroscopy helped predict shorter-term survivorship at baseline (area under the receiver operating characteristic curve [AUC], 0.75), at 1 day after therapy (AUC, 0.87), and at 8 weeks after therapy (AUC, 1) by means of measuring lower intratumoral myo-inositol normalized by contralateral creatine, or mI/c-Cr.
■ Shorter-term survivors had lower contralateral mI/c-Cr compared with longer-term survivors at baseline (P = .04), confirming prediction of survivorship (AUC, 0.72).
Introduction
Glioblastoma (GBM) is the most malignant type of primary central nervous system tumor and has no cure (1). Despite aggressive treatment, GBM recurrence is inevitable (1,2). Many patients with recurrence are treated with antiangiogenic agents such as bevacizumab (BEV), which has shown promise in prolonging progression-free survival and improving the quality of life for a subset of patients (3,4). The impact of BEV on overall survival of patients with recurrent GBM is still under debate (5,6).
Treatment with anti–vascular endothelial growth factor agents reduces enhancement on T1-weighted MRI scans, making it difficult to distinguish treatment response from pseudoresponse (7–9). Therefore, relying on T1-weighted contrast enhancement is not ideal, and there remains a need to investigate additional markers predictive of BEV response. MR spectroscopic imaging (MRSI) is a valuable tool to convey information regarding tumor microenvironment during antiangiogenic treatment, as it does not depend on hemodynamics. Our group has shown that changes in N-acetylaspartate, choline, and lactate measured with use of MRSI at an intermediate echo time (TE) of approximately 135 msec can help detect BEV treatment failure (10,11). Prior research has mainly focused on markers of membrane turnover, neuronal integrity, and hypoxia (10,12–14), with fewer studies investigating other metabolites.
Because BEV modulates blood-brain barrier permeability, it is likely that the osmotic environment surrounding the tumor is impacted. Myo-inositol (mI), a basic sugar and cellular osmoregulator in the brain that can be detected with use of short TE MRSI, has been shown to vary in concentration to adapt to changes in extracellular osmolality (15,16). Its concentration is altered in brain tumors: low-grade tumors have elevated mI levels due to increased density of astrocyte-derived cells (15,17), whereas high-grade tumors such as GBM have lower levels. It is believed that disruptions of the blood-brain barrier may cause disturbances of osmotic equilibrium, leading to lower mI concentrations (18–20). A study involving 39 patients with recurrent GBM found that higher mI levels in contralateral normal-appearing brain tissue before BEV treatment, as well as higher differences in mI concentrations between control and tumor tissue at 8 weeks after treatment, were predictive of longer survival (15). Notably, there were no differences in intratumoral mI between longer-term and shorter-term survivors (15). However, to our knowledge, no studies have determined whether a similar phenomenon is observed in the contralateral and intratumoral volumes after correction for glycine (Gly) contribution with use of short and intermediate TE MRSI.
The purpose of this study was to use intermediate and short TE spectroscopic data to measure corrected mI normalized by contralateral creatine (hereafter, mI/c-Cr) values in participants with recurrent GBM treated with BEV and to investigate whether such measurements can predict survivorship before BEV initiation and at 1 day, 4 weeks, and 8 weeks thereafter. We hypothesized that mI/c-Cr may be a marker that helps predict antiangiogenic treatment response and distinguish between shorter- and longer-term survivors.
Materials and Methods
Participant Recruitment
All participants were recruited between 2016 and 2020 in collaboration with their neuro-oncologist, and written informed consent was obtained as approved by the institutional review board. This study was registered at ClinicalTrials.gov (NCT02843230). All participants had histologically confirmed GBM, underwent resection followed by chemoradiation, and had evidence of possible tumor progression as determined by a multidisciplinary tumor board based on increasing tumor size at follow-up imaging and/or clinical decline. All participants were antiangiogenic therapy–naïve before enrollment. Participants were treated according to the Stupp protocol (21), with involved-field radiation therapy delivery consisting of 60 Gy over 30 fractions to the enhancing tumor, fluid-attenuated inversion-recovery hyperintensity regions, and a 1–2-cm margin around the tumor border. The treatment plan included BEV monotherapy or combination therapy with temozolomide (dosing regimen varied; participants either received 50 mg/m2 daily or 150–200 mg/m2 for 5–28 days), pembrolizumab (2 mg/kg every 3 weeks), or lomustine (90 mg/m2 every 6 weeks). Eligible participants were 18 years of age or older and had a baseline Karnofsky performance score of 50 or higher.
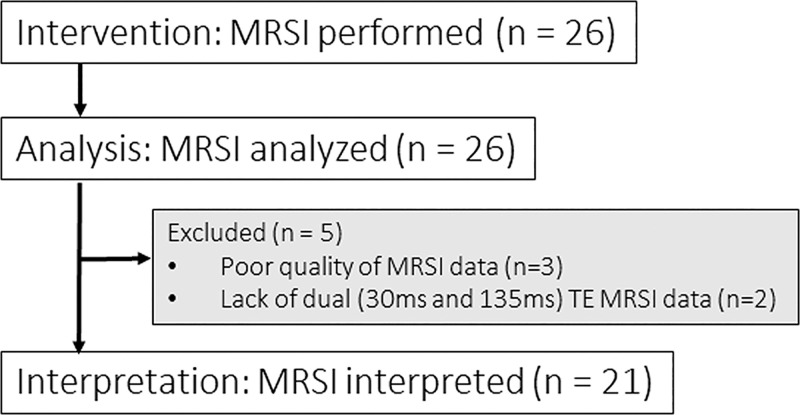
Among the 26 participants in the study, three were excluded due to poor quality MRSI data and two due to lack of short TE (30 msec) MRSI data. Our group previously reported N-acetylaspartate, lactate, choline, and creatine (Cr) measured with use of intermediate TE MRSI for all 26 participants in this study (11). The short TE analyses reported in this present study have not been previously analyzed. Participants underwent serial MRI/MRSI examination with the baseline scan performed within 1 month prior to treatment with BEV. Other time points included 1–2 days, 4 weeks, and 6–8 weeks after BEV treatment, which hereafter will be referenced as 1 day, 4 weeks, and 8 weeks, respectively. The final data set included 21 participants for serial data analysis (Fig 1). The number of participants at each time point were 21 at baseline, seven at 1 day, 16 at 4 weeks, and nine at 8 weeks.
Figure 1:
Patient consort chart. Twenty-six patients were initially assessed for eligibility, of whom three were excluded due to poor quality of MR spectroscopic imaging (MRSI) data. Among the remaining 23 patients, two were excluded due to lack of short and intermediate echo time (TE) data. In total, 21 participants’ MRSI data were analyzed at baseline.
Volume of Interest Selection
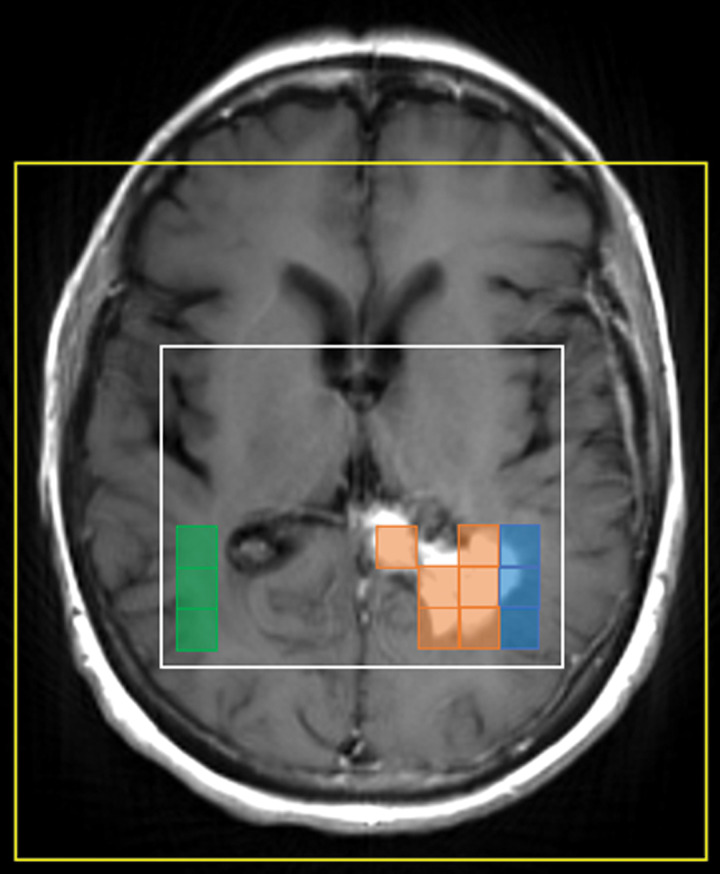
The MRSI data were overlaid on T1-weighted postcontrast images for spectral classification. Voxels were classified as contrast-enhancing tumor (intratumoral), nonenhancing peritumoral parenchyma (peritumoral), and normal white-matter tissue in the contralateral hemisphere to the tumor (contralateral) (Fig 2). Notably, voxels were labeled as intratumoral when more than 50% of the voxel showed enhancement. Voxel shifting was applied as needed to better overlay baseline scans with follow-up scans (10,11).
Figure 2:
MRSI voxel selection. Based on T1-weighted postcontrast MRI, intratumoral (orange), peritumoral (blue), and contralateral (green) voxels were selected for further analysis. The surrounding white box represents the excitation volume, and the yellow box denotes the field of view.
MRI/MRSI Acquisition
Participants underwent two-dimensional MRSI with a 1.5-T Signa HDx and HDxt MRI scanner (GE) or three-dimensional MRSI with a 3.0-T Magnetom Prisma or Magnetom Skyra scanner (Siemens). Participants were scanned with either GE or Siemens scanners throughout the study to minimize interscanner variability effects. The non–MR spectroscopy imaging parameters are described elsewhere (11).
On the Siemens scanners, three-dimensional MRSI data were obtained by means of localization by adiabatic selective refocusing, or LASER, MRSI using spiral k-space readout as described previously (22). Acquisition parameters included TE, 30 msec and 135 msec; repetition time, 1700 msec; resolution, 1 cm3; acquisition time, 2 × 7 minutes; acquisition matrix, 160 × 160 × 80 mm; field of view, 160 × 160 × 80 mm; and slab thickness, 40 mm. Water suppression was achieved with use of a water-suppression technique called WET (water suppression enhanced through T1 effects).
On the GE scanners, MRSI data were obtained by means of product point-resolved spectroscopy, or PRESS, with phase encoding. Acquisition parameters included TE, 30 msec and 135 msec; repetition time, 1500 msec; resolution, 1.44 cm3; acquisition time, 2 × 8 minutes; acquisition matrix, 180 × 180 mm; section thickness, 10 mm; and field of view, 220 mm. Water suppression was achieved with use of chemical shift selective methods, or CHESS.
MRSI Analysis
Spectroscopic data were processed using LCModel 6.3 software (23) to quantify mI and Cr. Before analyses, all spectra were visually inspected for quality by one author (E.M.R., with 18 years of experience in MRI and MR spectroscopy). Voxels with poor fitting, low signal-to-noise ratio, inadequate water suppression, and/or necrosis were excluded. Specifically, spectra with full width at half maximum greater than 15 Hz and signal-to-noise ratio less than 2 were excluded from the analyses. The signal-to-noise ratio is defined by LCModel as the highest peak divided by the standard deviation of the noise of the residual between the spectrum and the fit. Of note, LCModel has been shown to systematically underestimate the true signal-to-noise ratio calculated from a recent MRSI consensus article (24).
Gly Contribution to mI Signal at Short TE
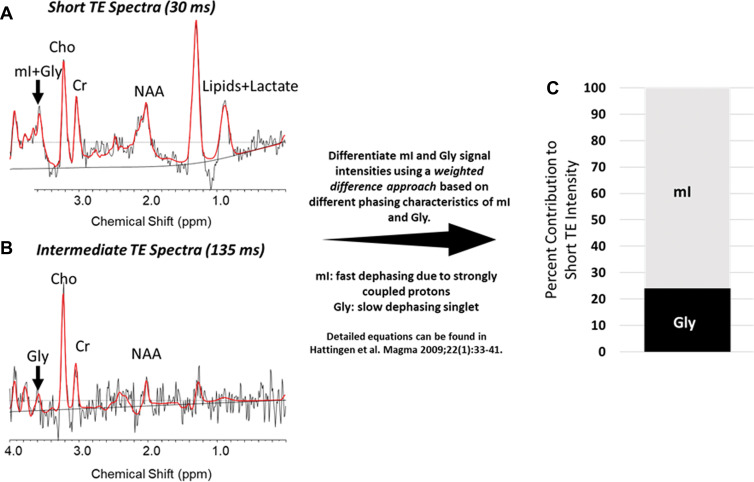
The mI and Gly signals both appear at 3.56 parts per million at short TE, making their separation difficult. To verify that our results were not driven by a large Gly contribution, we used short and intermediate echo data during the same scanning session to isolate mI and Gly contributions with use of a weighted difference approach, as described by Hattingen et al (Fig 3A, 3B) (25). The median contribution of Gly was approximately 20% of the short TE intensity in all volumes of interest (VOIs). We calculated adjusted values of mI/c-Cr (ie, without Gly contribution) and illustrate the spectra for a representative intratumoral voxel where mI and Gly contributions to the overall short TE intensity were 76% and 24%, respectively (Fig 3C). For each participant at each visit, we calculated the average corrected mI signal within each VOI. These were normalized by the contralateral Cr to generate separate values of Gly/c-Cr and mI/c-Cr.
Figure 3:
Differentiating between glycine (Gly) and myo-inositol (mI) signal intensities at short echo time (TE). (A, B) For a sample intratumoral voxel, we used multiecho MR spectroscopic imaging data and performed a weighted calculation to distinguish between mI and Gly contributions to short TE signal intensities. Graphs show these results, with peaks indicated for mI plus Gly (or Gly alone), choline (Cho), creatine (Cr), N-acetylaspartate (NAA), and lipids plus lactate (in A only). The real part of the frequency-domain data is plotted as a thin curve. The thick red curve is the LCModel fit to this data. Also plotted as a thin curve is the baseline. ppm = parts per million. (C) Bar graph shows the contribution of mI and Gly to the full signal. In this example, the true mI contribution is 76% of the signal.
Statistical Analyses
We investigated whether intratumoral, peritumoral, and contralateral mI/c-Cr can help distinguish between longer-term survivors (≥9 months) and shorter-term survivors (<9 months) at baseline. We chose 9-month overall survivorship for classification because few participants in our study sample survived to 1 year (11). Receiver operating characteristic curves for mI/c-Cr in each region were generated at every time point for survivorship. The Student t test was used if the underlying assumption of a normal distribution was satisfied using the Shapiro-Wilk test; if not, the Wilcoxon rank-sum exact test was used. All Wilcoxon rank-sum exact tests, two-tailed Student t tests, likelihood ratio tests, area under the receiver operating characteristic curves (AUCs), and 95% CIs were estimated using JMP Pro 15 (SAS Institute). The mI/c-Cr was considered effective in classifying outcome if the lower bound of the 95% CI of the AUC was greater than 0.50. All demographic categorial variables such as sex, race, isocitrate dehydrogenase 1 and O-6-methylguanine-DNA methyltransferase statuses, and treatment regimen underwent χ2 testing for significance. Demographic numeric variables, such as age and Karnofsky performance score, were assessed for significance by using the Mood median test. P < .05 was considered indicative of statistically significant difference.
Results
Participant Demographics
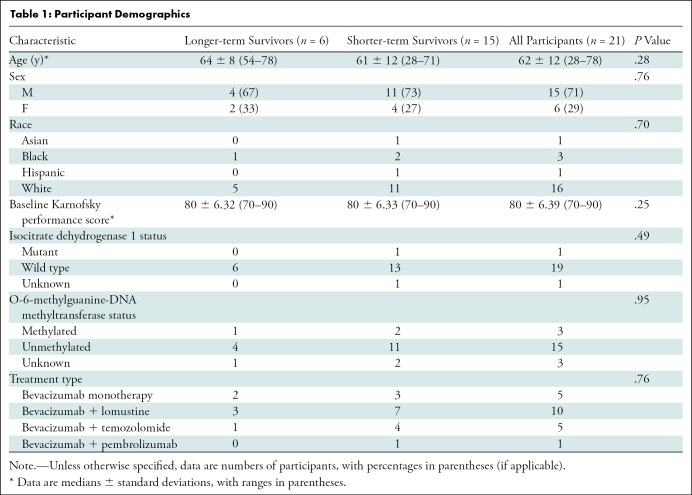
Twenty-one participants with recurrent GBM (median age ± standard deviation, 62 years ± 12; 15 men) were included in our study. One participant was Asian, three were Black, one was Hispanic, and 16 were White (Table 1). Our χ2 tests indicated no differences in sex (χ2[1] = 0.092; P = .76), race (χ2[3] = 1.43; P = .70), isocitrate dehydrognase 1 mutation status (χ2[2] = 1.43; P = .49), O-6-methylguanine-DNA methyltransferase status (χ2[2] = 0.092; P = .95), or treatment regimen (χ2[3] = 1.18; P = .76) between longer- and shorter-term survivors. Furthermore, we found no evidence of group differences with regards to age (median, 64 years and 61 years for longer- and shorter-term survivors, respectively; P = .28) or baseline Karnofsky performance score (median, 80 years for both longer- and shorter-term survivors; P = .25) (Table 1).
Table 1:
Participant Demographics
The mI/c-Cr Ratios at Baseline across VOIs
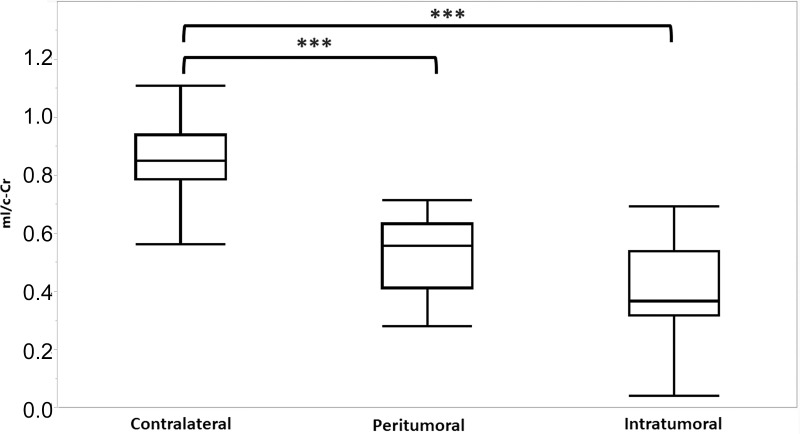
The mI/c-Cr ratios of all participants were compared across intratumoral, peritumoral, and contralateral VOIs at baseline (Fig 4). Intratumoral, peritumoral, and contralateral VOIs had an average mI/c-Cr ± standard deviation of 0.41 ± 0.21, 0.53 ± 0.17, and 0.87 ± 0.16, respectively. There were differences in mean mI/c-Cr between VOIs (P < .001, Wilcoxon rank-sum exact test). The post hoc Student t test revealed that intratumoral and peritumoral mI/c-Cr were each lower than contralateral mI/c-Cr (P < .001). Although mI/c-Cr levels were lower in the intratumoral volume compared with the peritumoral volume, this did not reach the threshold for significance after Bonferroni correction (uncorrected P = .04; Bonferroni-corrected P = .12).
Figure 4:
Myo-inositol normalized by contralateral creatine (mI/c-Cr) at baseline in intratumoral, peritumoral, and contralateral volumes of interest. Box plots indicate the 25th and 75th percentiles. The whiskers represent the maximum and minimum values, and the midlines indicate the median (50th percentile). Intratumoral voxels had the lowest median mI/c-Cr, whereas contralateral voxels had the highest mI/c-Cr values. *** = P < .001.
Contralateral mI/c-Cr as a Predictor of Survivorship
Based on the findings reported by Steidl et al (15) within the contralateral tissue at baseline, we investigated in our study sample whether shorter-term survivors had a lower ratio of contralateral mI to Cr levels (hereafter, mI/Cr) and whether that was predictive of antiangiogenic treatment failure. We confirmed the findings of Steidl et al: shorter-term survivors had significantly lower contralateral mI/c-Cr at baseline (mean, 0.85 and 0.98 for shorter- and longer-term survivors, respectively; P = .04) (Table 2). Furthermore, contralateral mI/c-Cr was predictive of survivorship at baseline, with an AUC of 0.72 (95% CI: 0.57, 0.87) (Table 2). Additionally, we did not observe any longitudinal differences in contralateral mI/Cr across the various treatment groups (Appendix E1 [online]).
Table 2:
Statistical Summary of Contralateral mI/Cr
We did not find any significant group differences at later time points. However, based on receiver operating characteristic analyses, contralateral mI/c-Cr was predictive of survivorship at 1 day (AUC, 0.83; 95% CI: 0.63, 1), 4 weeks (AUC, 0.69; 95% CI: 0.53, 0.87), and 8 weeks (AUC, 0.80; 95% CI: 0.63, 0.97). A summary of these statistical analyses is displayed in Table 2.
Intratumoral mI/c-Cr as a Predictor of Survivorship
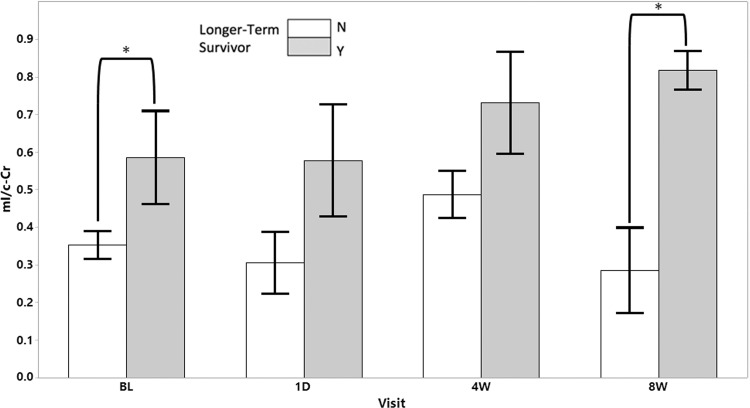
We investigated whether the previous finding—that shorter-term survivors have lower mI/c-Cr—was applicable to intratumoral mI/c-Cr at baseline. The mean mI/c-Cr was lower in shorter-term survivors compared with longer-term survivors (mean, 0.35 and 0.59 for shorter- and longer-term survivors, respectively; P = .02) (Fig 5). Intratumoral mI/c-Cr was predictive of survivorship at baseline, with an AUC of 0.75 (95% CI: 0.60, 0.89).
Figure 5:
Intratumoral myo-inositol normalized by contralateral creatine (mI/c-Cr) at baseline (BL) and follow-up scans stratified according to longer- (gray) and shorter-term survivorship (white). Longer-term survivors had statistically significantly higher mean intratumoral mI/c-Cr at baseline and the 8-week timepoint. Error bars represent standard error of the mean. * = P < .05. N = no, Y = yes.
Subsequent exploratory analyses showed that at the 8-week time point, a similar effect was present, with shorter-term survivors having lower mI/c-Cr (mean, 0.29 and 0.82 for shorter- and longer-term survivors, respectively; P = .006) (Fig 5). Intratumoral mI/c-Cr was predictive of survivorship at 1 day (AUC, 0.87; 95% CI: 0.68, 1) and 8 weeks (AUC, 1; 95% CI: 1, 1). This was not the case at the 4-week time point (AUC, 0.65; 95% CI: 0.49, 0.85). We did not observe any longitudinal differences in intratumoral mI/c-Cr across the various treatment groups (Appendix E1 [online]).
Survivorship Analyses
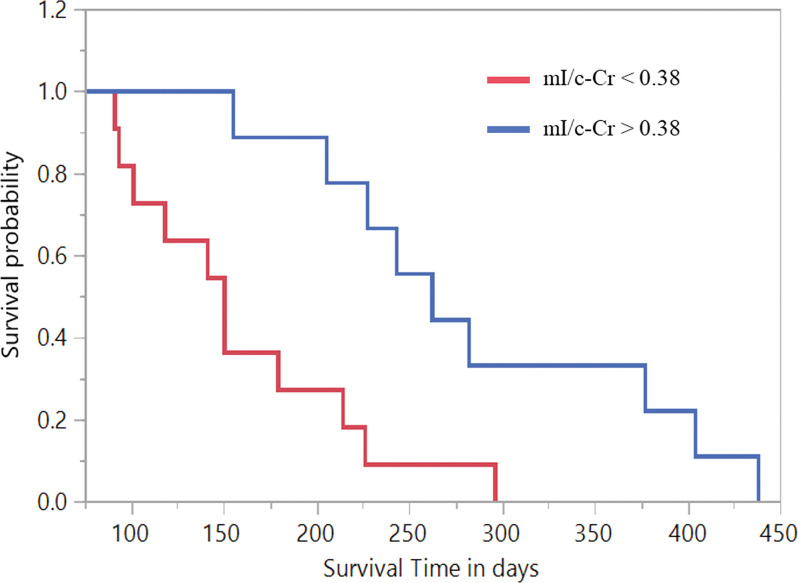
Contingency analyses at baseline revealed that an intratumoral mI/c-Cr value of 0.38 yielded the most robust AUC (0.75; 95% CI: 0.60, 0.89). After performing Kaplan-Meier survival analysis, we found that participants with a baseline intratumoral mI/c-Cr greater than 0.38 had a mean overall survivorship of 288 days, compared with 160 days for participants with decreased mI/c-Cr (Fig 6). The Wilcoxon rank-sum exact test revealed that there was a difference in survivorship between both groups (P < .001).
Figure 6:
Kaplan-Meier curves stratified according to increased and decreased intratumoral myo-inositol normalized by contralateral creatine (mI/c-Cr) for participants with intratumoral mI/c-Cr greater than 0.38 at baseline (mean survival time, 288 days) compared with those with mI/c-Cr less than 0.38 (mean survival time, 160 days). The Wilcoxon rank-sum exact test demonstrated evidence of difference in survival rates within the two groups (P < .001).
Discussion
Despite the use of bevacizumab (BEV) in treating patients with recurrent glioblastoma, its impact on overall survivorship is unclear. Therefore, there is an unmet clinical need to identify BEV nonresponders, as they may be candidates for other forms of salvage therapy. We used MR spectroscopic imaging to evaluate myo-inositol normalized by contralateral creatine (hereafter, mI/c-Cr) as a potential marker of survivorship and BEV response. We found that shorter-term survivors had lower mI/c-Cr compared with longer-term survivors in normal-appearing white matter contralateral to the tumor (P = .04), the intratumoral volume (P = .02), and the peritumoral volume (P = .04) as early as at baseline. This was predictive of shorter-term survivorship, with receiver operating characteristic analyses generating an area under the receiver operating characteristic curve of 0.72 in the contralateral volume, 0.75 in the intratumoral volume, and 0.80 in the peritumoral volume at baseline.
Although mI/c-Cr was lowest within the tumor VOI, intratumoral differences between longer- and shorter-term survivors may be partly explained by dysregulation of osmotic equilibrium (15,20). More aggressive tumors express higher levels of vascular endothelial growth factor to form new blood vessels (26). However, these vessels have abnormal functionality and morphologic characteristics, with variable permeability and irregular cellular structure (25,26). More infiltrative tumors are susceptible to vasogenic brain edema and increased intracranial pressure that result in further damage to the blood-brain barrier (26,27). Therefore, more aggressive infiltrative tumors have leakier blood-brain barriers, which results in a decreased ability for osmoregulation in the tumor microenvironment, and subsequently lower levels of mI. This may also explain our findings in the contralateral hemisphere, as autopsy studies have indicated elevated Ki-67 staining and vascular endothelial growth factor expression in astrocytes located outside of the tumor, as far away as the contralateral hemisphere (28,29). Therefore, more aggressively migrating tumors may have elevated vascular endothelial growth factor on the contralateral side, resulting in a more permeable blood-brain barrier and less need for mI production to maintain osmoregulation.
Another explanation could be mI contribution to the biosynthesis of phosphatidylinositol (18,30). This compound is broken down to form diacylglycerol and inositol 1,4,5-triphosphate. Diacylglycerol is essential for the activation of protein kinase C, which activates metalloproteases that function in enhancing the invasiveness of tumors (18). Considering this, our finding that shorter-term survivors have lower levels of mI/c-Cr may be due to increased conversion of mI to downstream targets such as phosphatidylinositol, leading to more aggressive tumor growth. Previous work in a human-derived xenograft mouse model of glioblastoma revealed that oral dosing with a protein kinase C inhibitor suppressed angiogenesis and had an antitumor effect by suppressing proliferation, supporting the viability of this hypothesis (31).
Our study is in line with a previous report (15); however, that report did not isolate the contribution of Gly to the short TE intensity at 3.56 parts per million, making it difficult to ascertain whether those results were mainly driven by mI as opposed to a combinatorial effect of mI and Gly. In our study, we used a weighted-differences approach to calculate the Gly contribution on a voxel-wise basis and generated corrected mI/c-Cr across all volumes. To detect Gly with higher reliability, future studies should consider using higher magnetic field strengths (7 T) with single spin-echo excitation schemes, which have been shown to be successful in decoupling the mI signal from the Gly singlet, allowing for the high fidelity quantification of the latter (32).
Our study had limitations. First, our study had a relatively small sample size; to validate whether mI/c-Cr can be a clinically useful marker, it is imperative to confirm these results in a larger data set.
Second, we acknowledge that there is considerable technical expertise required to implement the methods, to extract relevant data, and to analyze it such that it can be implemented within the clinic. Furthermore, acquiring intermediate and short TE MRSI data in a clinical setting may be difficult due to time and technical limitations. To overcome these issues, our group, in collaboration with several sites across the United States and Europe, is working on providing a turnkey package of advanced MRSI technology for end users for multisite and/or vendor trials and routine clinical use (Siemens, GE Healthcare, and Philips 3.0-T platforms) (33).
Third, given that MRSI data in our cohort were obtained from scanners with differing magnetic field strengths, the possibility for interscanner variability in the measurements of mI/c-Cr exist. However, for our study participants, there is no evidence of difference in mI/c-Cr across Siemens and GE scanners (Table E6 [online]). Furthermore, there is no evidence that scanner type was an important predictor of survivorship in our model (Table E7 [online]). This is in line with a previous report that showed when compared to 1.5-T, 3.0-T 1H MR spectroscopy improved signal-to-noise ratio but did not result in significant difference in metabolite ratios (34).
Fourth, when correcting for Gly contribution, MRSI data acquisition was performed using different platforms than those described by Hattingen et al (25) and were not validated by a phantom study. This underscores the need for multicenter trials to quantitatively validate these results through phantom studies and clinically acquired scans. To that end, our group is working on performing phantom studies across the different platforms to validate our methods. Nonetheless, we have shown that the adapted method for Gly correction was not driving our results and that lower levels of uncorrected mI across all VOIs still predict shorter-term survival (Tables E3–E5 [online]).
Fifth, all patients received involved-field radiation therapy to the enhancing tumor region and its surrounding border. In instances where the tumor was close to the midline, the contralateral hemisphere inevitably received low-dose radiation, which may theoretically impact its mI levels. To minimize the effects of radiation on mI levels, we selected contralateral voxels in regions that likely received little to no radiation, although further studies are required to validate the effect of radiotherapy on mI levels in the brain.
Sixth, because GBM is one of the most heterogeneous tumor types, the contribution of partial volume effects was likely. Partial volume effects are of little concern in contralateral voxels, which are homogeneous in nature and independent from the enhancing regions. Furthermore, our findings were comparable across voxel types. Despite these limitations, the MR spectroscopy marker mI/c-Cr helped predict 9-month overall survivorship.
Based on our results, myo-inositol normalized by contralateral creatine (mI/c-Cr) holds promise to be a marker that helps predict short-term survivors of antiangiogenic therapy. Our preliminary analyses suggest that patients with lower levels of mI/c-Cr are less likely to respond to bevacizumab and become longer-term survivors. Most important, mI/c-Cr in the tumor, periphery, and contralateral side can help predict nonresponders to antiangiogenic therapy before treatment initiation. Predicted shorter-term survivors may be suitable candidates for different salvage therapies. Furthermore, we have shown that there may be utility in incorporating both short and intermediate echo time MR spectroscopic imaging scan sequences within clinical MRI protocols to facilitate treatment of patients with recurrent glioblastoma.
Acknowledgments
Acknowledgments
We thank all participating Massachusetts General Hospital neuro-oncologists, Cancer Center and Radiology staff, and Quantitative Tumor Imaging staff for assisting in this study. We thank Wesley Shin, BA, for help with the data analysis and Ana Paula Candiota, PhD, for our fruitful discussion regarding the mI/Gly measurement. We also thank all patients and their families.
M.E.E. and M.R.W. contributed equally to this work.
Supported by National Institutes of Health grants R01CA190901 (E.M.R), R01CA129371 (T.T.B.), R21AG067562 and R21GM137227 (Y.F.Y), and K23CA169021 and S10RR023043 (E.R.G).
Disclosures of Conflicts of Interest: M.E.E. No relevant relationships. M.R.W. No relevant relationships. P.T. No relevant relationships. M.F. No relevant relationships. D.K. No relevant relationships. A.W. No relevant relationships. J.H. No relevant relationships. A.V. No relevant relationships. M.V. No relevant relationships. O.R. Support from GE Healthcare for travel expenses as a presenter. O.A. No relevant relationships. I.A.R. Clinical trial funding support from Astex Pharmaceuticals; payment for lectures from Merck; participation on a data safety monitoring board or advisory board for Forma Therapeutics, Boehringer Ingelheim, and Agios; educational co-chair for the Society for Neuro-Oncology; receipt of equipment or materials from Astex Pharmaceuticals. D.A.F. Research support from Conquer Cancer, the ASCO Foundation; shareholder in Eli Lilly. Y.F.Y. No relevant relationships. B.R. Stock or stock options in QMENTA, BlinkAI Technologies, and Subtle Medical (no payments received to date). T.T.B. National Institutes of Health (NIH) grant to institution; royalties from Wolters Kluwer as an author for UpToDate; consulting fees from Champions Biotechnology; NIH committee co-chair; honoraria from Oakstone; former member of the GenomiCare scientific advisory board; leadership roles with the American Academy of Neurology, Society for Neuro-Oncology, American Association for Cancer Research, and American Society of Hematology. R.G.G. No relevant relationships. J.D. Royalties from Wolters Kluwer as an author for UpToDate; consulting fees from Blue Earth Diagnostics and Unum Therapeutics. E.R.G. No relevant relationships. E.M.R. Grants from NIH and the National Science Foundation; advisory board member for BrainSpec.
Data sharing: Data generated or analyzed during the study are available from the corresponding author by request.
Abbreviations:
- AUC
- area under the receiver operating characteristic curve
- BEV
- bevacizumab
- Cr
- creatine
- GBM
- glioblastoma
- Gly
- glycine
- mI
- myo-inositol
- mI/c-Cr
- mI normalized by contralateral Cr
- MRSI
- MR spectroscopic imaging
- TE
- echo time
- VOI
- volume of interest
References
- 1. Hanif F , Muzaffar K , Perveen K , Malhi SM , Simjee ShU . Glioblastoma multiforme: a review of its epidemiology and pathogenesis through clinical presentation and treatment . Asian Pac J Cancer Prev 2017. ; 18 ( 1 ): 3 – 9 . [DOI] [PMC free article] [PubMed] [Google Scholar]
- 2. Hou LC , Veeravagu A , Hsu AR , Tse VC . Recurrent glioblastoma multiforme: a review of natural history and management options . Neurosurg Focus 2006. ; 20 ( 4 ): E5 . [DOI] [PubMed] [Google Scholar]
- 3. Friedman HS , Prados MD , Wen PY , et al . Bevacizumab alone and in combination with irinotecan in recurrent glioblastoma . J Clin Oncol 2009. ; 27 ( 28 ): 4733 – 4740 . [DOI] [PubMed] [Google Scholar]
- 4. Kreisl TN , Kim L , Moore K , et al . Phase II trial of single-agent bevacizumab followed by bevacizumab plus irinotecan at tumor progression in recurrent glioblastoma . J Clin Oncol 2009. ; 27 ( 5 ): 740 – 745 . [DOI] [PMC free article] [PubMed] [Google Scholar]
- 5. Hofmann S , Schmidt MA , Weissmann T , et al . Evidence for improved survival with bevacizumab treatment in recurrent high-grade gliomas: a retrospective study with (“pseudo-randomized”) treatment allocation by the health insurance provider . J Neurooncol 2020. ; 148 ( 2 ): 373 – 379 . [DOI] [PMC free article] [PubMed] [Google Scholar]
- 6. Gramatzki D , Roth P , Rushing EJ , et al . Bevacizumab may improve quality of life, but not overall survival in glioblastoma: an epidemiological study . Ann Oncol 2018. ; 29 ( 6 ): 1431 – 1436 . [DOI] [PubMed] [Google Scholar]
- 7. Hygino da Cruz LC Jr , Rodriguez I , Domingues RC , Gasparetto EL , Sorensen AG . Pseudoprogression and pseudoresponse: imaging challenges in the assessment of posttreatment glioma . AJNR Am J Neuroradiol 2011. ; 32 ( 11 ): 1978 – 1985 . [DOI] [PMC free article] [PubMed] [Google Scholar]
- 8. Jain RK . Normalization of tumor vasculature: an emerging concept in antiangiogenic therapy . Science 2005. ; 307 ( 5706 ): 58 – 62 . [DOI] [PubMed] [Google Scholar]
- 9. Arevalo OD , Soto C , Rabiei P , et al . Assessment of glioblastoma response in the era of bevacizumab: longstanding and emergent challenges in the imaging evaluation of pseudoresponse . Front Neurol 2019. ; 10 460 . [DOI] [PMC free article] [PubMed] [Google Scholar]
- 10. Ratai EM , Zhang Z , Snyder BS , et al . Magnetic resonance spectroscopy as an early indicator of response to anti-angiogenic therapy in patients with recurrent glioblastoma: RTOG 0625/ACRIN 6677 . Neuro Oncol 2013. ; 15 ( 7 ): 936 – 944 . [DOI] [PMC free article] [PubMed] [Google Scholar]
- 11. Talati P , El-Abtah M , Kim D , et al . MR spectroscopic imaging predicts early response to anti-angiogenic therapy in recurrent glioblastoma . Neurooncol Adv 2021. ; 3 ( 1 ): vdab060 . [DOI] [PMC free article] [PubMed] [Google Scholar]
- 12. Hattingen E , Bähr O , Rieger J , Blasel S , Steinbach J , Pilatus U . Phospholipid metabolites in recurrent glioblastoma: in vivo markers detect different tumor phenotypes before and under antiangiogenic therapy . PLoS One 2013. ; 8 ( 3 ): e56439 . [DOI] [PMC free article] [PubMed] [Google Scholar]
- 13. Nelson SJ , Li Y , Lupo JM , et al . Serial analysis of 3D H-1 MRSI for patients with newly diagnosed GBM treated with combination therapy that includes bevacizumab . J Neurooncol 2016. ; 130 ( 1 ): 171 – 179 . [DOI] [PMC free article] [PubMed] [Google Scholar]
- 14. Andronesi OC , Gagoski BA , Adalsteinsson E , Sorensen AG . Correlation chemical shift imaging with low-power adiabatic pulses and constant-density spiral trajectories . NMR Biomed 2012. ; 25 ( 2 ): 195 – 209 . [DOI] [PMC free article] [PubMed] [Google Scholar]
- 15. Steidl E , Pilatus U , Hattingen E , et al . Myoinositol as a biomarker in recurrent glioblastoma treated with bevacizumab: a 1H-magnetic resonance spectroscopy study . PLoS One 2016. ; 11 ( 12 ): e0168113 . [DOI] [PMC free article] [PubMed] [Google Scholar]
- 16. Restuccia T , Gómez-Ansón B , Guevara M , et al . Effects of dilutional hyponatremia on brain organic osmolytes and water content in patients with cirrhosis . Hepatology 2004. ; 39 ( 6 ): 1613 – 1622 . [DOI] [PubMed] [Google Scholar]
- 17. Hattingen E , Raab P , Franz K , Zanella FE , Lanfermann H , Pilatus U . Myo-inositol: a marker of reactive astrogliosis in glial tumors? NMR Biomed 2008. ; 21 ( 3 ): 233 – 241 . [DOI] [PubMed] [Google Scholar]
- 18. Castillo M , Smith JK , Kwock L . Correlation of myo-inositol levels and grading of cerebral astrocytomas . AJNR Am J Neuroradiol 2000. ; 21 ( 9 ): 1645 – 1649 . [PMC free article] [PubMed] [Google Scholar]
- 19. Candiota AP , Majós C , Julià-Sapé M , et al . Non-invasive grading of astrocytic tumours from the relative contents of myo-inositol and glycine measured by in vivo MRS . JBR-BTR 2011. ; 94 ( 6 ): 319 – 329 . [DOI] [PubMed] [Google Scholar]
- 20. Papadopoulos MC , Saadoun S , Binder DK , Manley GT , Krishna S , Verkman AS . Molecular mechanisms of brain tumor edema . Neuroscience 2004. ; 129 ( 4 ): 1011 – 1020 . [DOI] [PubMed] [Google Scholar]
- 21. Stupp R , Mason WP , van den Bent MJ , et al . Radiotherapy plus concomitant and adjuvant temozolomide for glioblastoma . N Engl J Med 2005. ; 352 ( 10 ): 987 – 996 . [DOI] [PubMed] [Google Scholar]
- 22. Andronesi OC , Gagoski BA , Sorensen AG . Neurologic 3D MR spectroscopic imaging with low-power adiabatic pulses and fast spiral acquisition . Radiology 2012. ; 262 ( 2 ): 647 – 661 . [DOI] [PMC free article] [PubMed] [Google Scholar]
- 23. Provencher SW . Automatic quantitation of localized in vivo 1H spectra with LCModel . NMR Biomed 2001. ; 14 ( 4 ): 260 – 264 . [DOI] [PubMed] [Google Scholar]
- 24. Kreis R , Boer V , Choi IY , et al . Terminology and concepts for the characterization of in vivo MR spectroscopy methods and MR spectra: background and experts’ consensus recommendations . NMR Biomed 2020. ; 34 ( 5 ): e4347 . [DOI] [PMC free article] [PubMed] [Google Scholar]
- 25. Hattingen E , Lanfermann H , Quick J , Franz K , Zanella FE , Pilatus U . 1H MR spectroscopic imaging with short and long echo time to discriminate glycine in glial tumours . MAGMA 2009. ; 22 ( 1 ): 33 – 41 . [DOI] [PubMed] [Google Scholar]
- 26. Dubois LG , Campanati L , Righy C , et al . Gliomas and the vascular fragility of the blood brain barrier . Front Cell Neurosci 2014. ; 8 418 . [DOI] [PMC free article] [PubMed] [Google Scholar]
- 27. Artzi M , Liberman G , Blumenthal DT , Aizenstein O , Bokstein F , Ben Bashat D . Differentiation between vasogenic edema and infiltrative tumor in patients with high-grade gliomas using texture patch-based analysis . J Magn Reson Imaging 2018. ; 48 ( 3 ): 729 – 736 . [DOI] [PubMed] [Google Scholar]
- 28. Nagashima G , Suzuki R , Hokaku H , et al . Graphic analysis of microscopic tumor cell infiltration, proliferative potential, and vascular endothelial growth factor expression in an autopsy brain with glioblastoma . Surg Neurol 1999. ; 51 ( 3 ): 292 – 299 . [DOI] [PubMed] [Google Scholar]
- 29. Crommentuijn MHW , Schetters STT , Dusoswa SA , Kruijssen LJW , Garcia-Vallejo JJ , van Kooyk Y . Immune involvement of the contralateral hemisphere in a glioblastoma mouse model . J Immunother Cancer 2020. ; 8 ( 1 ): e000323 . [DOI] [PMC free article] [PubMed] [Google Scholar]
- 30. Chhetri DR . Myo-inositol and its derivatives: their emerging role in the treatment of human diseases . Front Pharmacol 2019. ; 10 1172 . [DOI] [PMC free article] [PubMed] [Google Scholar]
- 31. Graff JR , McNulty AM , Hanna KR , et al . The protein kinase Cβ-selective inhibitor, Enzastaurin (LY317615.HCl), suppresses signaling through the AKT pathway, induces apoptosis, and suppresses growth of human colon cancer and glioblastoma xenografts . Cancer Res 2005. ; 65 ( 16 ): 7462 – 7469 . [DOI] [PubMed] [Google Scholar]
- 32. Gambarota G , Mekle R , Xin L , et al . In vivo measurement of glycine with short echo-time 1H MRS in human brain at 7 T . MAGMA 2009. ; 22 ( 1 ): 1 – 4 . [DOI] [PubMed] [Google Scholar]
- 33. Deelchand DK , Berrington A , Noeske R , et al . Across-vendor standardization of semi-LASER for single-voxel MRS at 3T . NMR Biomed 2021. ; 34 ( 5 ): e4218 . [DOI] [PMC free article] [PubMed] [Google Scholar]
- 34. Kim JH , Chang KH , Na DG , et al . Comparison of 1.5T and 3T 1H MR spectroscopy for human brain tumors . Korean J Radiol 2006. ; 7 ( 3 ): 156 – 161 . [DOI] [PMC free article] [PubMed] [Google Scholar]


