

Abstract
BACKGROUND AND PURPOSE:
Vestibular aqueduct measurements in the 45° oblique (Pöschl) plane provide a reliable depiction of the vestibular aqueduct; however, adoption among clinicians attempting to counsel patients has been limited due to the lack of correlation with audiologic measures. This study aimed to determine the correlation between midpoint vestibular aqueduct measurements in the Pöschl plane in patients with an enlarged vestibular aqueduct with repeat audiologic measures.
MATERIALS AND METHODS:
Two radiologists independently measured the midpoint vestibular aqueduct diameter in the Pöschl plane reformatted from CT images in 54 pediatric patients (77 ears; mean age at first audiogram, 5 years) with an enlarged vestibular aqueduct. Four hundred nineteen audiograms were reviewed, with a median of 6 audiograms per patient (range, 3–17; mean time between first and last audiograms, 97.4 months). The correlation between midpoint vestibular aqueduct size and repeat audiologic measures (pure tone average, speech-reception threshold, and word recognition score) using a linear mixed-effects model was determined.
RESULTS:
The mean midpoint vestibular aqueduct size was 1.78 mm (range, 0.81–3.46 mm). There was excellent interobserver reliability with intraclass correlation coefficients for the 2 readers measuring 0.92 (P < .001). Each millimeter increase in vestibular aqueduct size was associated with an increase of 10.5 dB (P = .006) in the pure tone average, an increase of 14.0 dB (P = .002) in the speech-reception threshold, and a decrease in the word recognition score by 10.5% (P = .05).
CONCLUSIONS:
Midpoint vestibular aqueduct measurements in the Pöschl plane are highly reproducible and demonstrate a significant correlation with audiologic data in this longitudinal study with repeat measures. These data may be helpful for clinicians who are counseling patients with an enlarged vestibular aqueduct using measurements obtained in the Pöschl plane.
An enlarged vestibular aqueduct (EVA) is the most common radiologically detected finding in children undergoing imaging for sensorineural hearing loss.1 Due to the sometimes progressive nature of the hearing loss, counseling of patients regarding their future hearing outcome is important, albeit challenging, due to the inconsistent pattern of hearing loss and overall unknown pathophysiology, in part because of the variable genetic background, association with cochlear malformations, and physical events that may predispose the patient to a sudden drop in hearing through trauma.2-9
Valvassori and Clemis,10 in 1978, reported that the vestibular aqueduct could be considered enlarged when its width at the midpoint measured >1.5 mm on polytomography. Advances in multidetector CT resulted in further development of the Cincinnati criteria based on axial CT images, which considered the vestibular aqueduct enlarged when the midpoint or opercular widths or both surpass 0.9 and 1.9 mm, respectively.11,12 To further elucidate the relationship between EVA size and auditory measures, Ascha et al13 investigated the relationship between the Cincinnati method of measurement for diagnosis of EVA and speech-related audiologic findings in a longitudinal retrospective study. They concluded that the degree of hearing loss as measured by the speech-reception threshold (SRT) and word recognition score (WRS) is likely influenced by the midpoint vestibular aqueduct (VA) width.
Due to the anatomic obliquity of the VA, the 45° oblique (Pöschl) plane has been proposed as a more reliable depiction of the VA in its entire length than the axial plane. It is thought to provide accurate and reliable measurements of VA size.14 On the basis of normative data, a midpoint VA size of 0.71 mm is considered the 97.5th percentile for size, and at our institution, a measurement of 0.8 mm is considered borderline to slightly enlarged.15 While the Cincinnati method of measurement has been correlated with audiologic findings, this has not yet been performed to a similar degree with the Pöschl plane midpoint VA measurement with repeat audiologic measures, limiting its adoption among clinicians attempting to counsel patients. This study aimed to determine to what extent EVAs measured in the Pöschl plane correlate with audiologic findings, namely pure tone average (PTA), WRS, and SRT, in a retrospective, longitudinal study.
MATERIALS AND METHODS
Study Population
This retrospective study received approval (IRB No: 2020P000295) through the Massachusetts Eye and Ear Institutional Review Board. The inclusion criteria were pediatric patients, 0–16 years of age, with either a unilateral or bilateral EVA determined by CT or MR imaging, either isolated or as part of a syndrome. These patients were identified through the Pediatric Hearing Loss Registry at Massachusetts Eye and Ear, a tool designed to keep track of patients with sensorineural hearing loss by etiology. One hundred four patients with EVA were located in the registry; 50 patients were excluded because they either had no available CT or <3 audiograms available. Fifty-four patients (77 ears) were included in the study.
Audiologic Data
Four hundred nineteen clinical audiograms from the 54 included patients were retrospectively reviewed from the electronic medical record. The measured values in the audiograms collected were PTA, SRT, and WRS. PTA is an average of hearing threshold levels typically at 500, 1000, 2000, 4000, and 8000 Hz and gives a quantitative description of the ear’s hearing ability. SRT indicates the lowest sound intensity in decibels at which a listener can repeat 50% of presented 2-syllable words. WRS reflects the percentage of monosyllabic words a subject correctly repeats at a suprathreshold intensity of a 25- or 50-word list.16 All patients included in the study had at least 3 audiograms. However, because values for SRT and WRS were not recorded as standard for all audiograms, occasionally fewer than 3 values of SRT and WRS were available for some patients. PTA values were available for 77 ears (54 patients), SRT values were available for 65 ears (48 patients), and WRS values were available for 67 ears (52 patients). Some audiograms used a score of “pass” for WRS. At our institution, this equates to a score in the range of 92% to 100%; thus, for these audiograms, a median score of 96% was used for quantitative evaluation.
Brookhauser et al17 offered definitions for 4 types of hearing loss: stable, purely progressive, fluctuating progressive, and fluctuating nonprogressive hearing loss. We considered progressive hearing changes as present if the difference between initial and final PTA threshold was at least 10 dB. If the variability between each time point measure of PTA did not surpass 10 dB and the difference between first and last audiogram PTA did not surpass 10 dB, the hearing was classified as stable. If the PTA measurements had <10 dB of variability between measurements and the measurements between the initial and last audiogram were >10 dB, the hearing change was classified as purely progressive. If the PTA measurements did show a variability of at least 10 dB between time points and measurements returned to within 10 dB of the initial PTA, the hearing change was classified as fluctuating nonprogressive. If the PTA measurements did show a variability of at least 10 dB between time points and the measurements between the initial and last audiogram were >10 dB, the hearing change was classified as fluctuating progressive.
Radiologic Data
A retrospective review of multidetector CT of the temporal bone of the 54 patients (77 ears) was performed. Three CTs were performed at outside institutions. At our institution, multidetector CT (Discovery 750 HD; GE Healthcare) of the temporal bone was performed with 120 kV(peak), 165 mA, section thickness of 0.6 mm, and a 0.2-mm overlap. Overall, the mean section thickness was 0.6 mm (range, 0.5–0.8 mm), the mean x-ray current was 153 mA, and the mean voltage was 120 kVp. The Pöschl plane (mean section thickness, 0.6 mm; range, 0.5-0.8 mm) was created by using the thinnest available data in bone windows on all included ears using an Advantage Workstation VolumeShare 5 (GE Healthcare).
The Pöschl plane images (example in Fig 1) were independently reviewed by 2 blinded radiologists who determined the midpoint VA size using the technique outlined in Juliano et al.15 The mean midpoint VA size was determined and compared with the audiologic findings.
FIG 1.
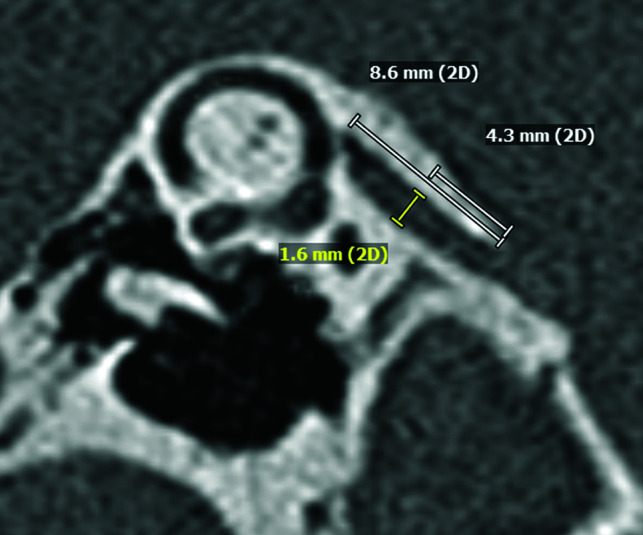
Measurement of the midpoint vestibular aqueduct size in the Pöschl plane. The length of the VA is determined, and the midpoint level is located. A measurement line perpendicular to the VA length is used to measure the midpoint VA size.
Statistical Analysis
To determine interobserver reliability between the 2 blinded readers, we calculated the intraclass correlation coefficient.18 Because longitudinal repeat measurements were available for each patient, we chose a linear mixed-effects model to evaluate the relationship between the VA size and the 3 outcomes: PTA, SRT, and WRS. This allowed us to account for changes in hearing with time and to allow group measurements of all patients. The midpoint VA size, the age at the first audiogram, and the time since the first audiogram were chosen as the fixed effects, and the random effects included the intercepts for each patient and by-patient random slopes across time. The mixed-effects model was fit using the R statistical programming language, Version 4.0.4 (http://www.r-project.org/) software packages lmerTest and lme4. Further subgroup analysis and comparisons were performed using the Student t test.
P values ≤ .05 were considered statistically significant.
RESULTS
Study Population
Fifty-four patients (25 males and 29 females) with a mean age at the first audiogram of 5 years met the inclusion criteria. Of the 54 patients, 25 patients had bilateral and the remaining 29 patients had unilateral EVAs. Due to missing audiogram data, 2 ears were excluded, resulting in a total of 77 ears included in this study. Thirty-four patients (50 ears) had radiographic evidence of an associated cochlear malformation, all incomplete partition-type 2 (IP-2) anomalies. One additional patient also showed radiologic findings of an IP-2 anomaly in the contralateral ear, which was not affected by the EVA and did not show a detectable anomaly of the inner ear on the side with the enlarged VA. Three patients (4 ears with EVA) had Pendred syndrome. Four patients (7 ears with an EVA) had a reported history of trauma.
Vestibular Aqueduct Size and Interobserver Reliability
The mean midpoint VA size of the 77 included ears was 1.78 ([SD. 0.57] mm; range, 0.81–3.46 mm). The intraclass correlation coefficient for these measurements between the 2 radiologists was 0.92 (95% CI, 0.84–0.95; P < .001), which indicated excellent interobserver reliability. Subgroup analysis of the mean (SD) of the VA size in ears/patients with and without IP-2 anomalies, Pendred syndrome, and trauma, with or without progressive hearing loss, is given in Tables 1–4.
Table 1:
Subgroup analysis of VA size by presence of inner ear anomaly
| EVA with IP-2 | EVA without IP-2 | |
|---|---|---|
| No. (ears) | 50 | 27 |
| Mean (mm) | 1.92 | 1.53 |
| SD (mm) | 0.58 | 0.48 |
| P = .004 | ||
Table 2:
Subgroup analysis of VA size by presence of hearing fluctuation
| Fluctuating | Nonfluctuating | |
|---|---|---|
| No. (ears) | 30 | 47 |
| Mean (mm) | 1.94 | 1.68 |
| SD (mm) | 0.64 | 0.51 |
| P = .04 | ||
Table 3:
Subgroup analysis of VA size by presence of hearing progression
| Progressive | Stable | |
|---|---|---|
| No. (ears) | 28 | 49 |
| Mean (mm) | 1.81 | 1.77 |
| SD (mm) | 0.5 | 0.62 |
| P = .73 | ||
Table 4:
Subgroup analysis of VA size by hearing subtypes
| All patients | Progressive |
Stable |
||
|---|---|---|---|---|
| Fluctuating | Nonfluctuating | Fluctuating | Nonfluctuating | |
| No. (ears) | 13 | 15 | 17 | 32 |
| Mean (mm) | 1.88 | 1.75 | 1.98 | 1.65 |
| SD (mm) | 0.61 | 0.4 | 0.67 | 0.56 |
| Subgroups | ||||
| IP-2 | ||||
| No. (ears) | 7 | 11 | 13 | 19 |
| Mean (mm) | 2.01 | 1.83 | 2.20 | 1.74 |
| SD (mm) | 0.62 | 0.36 | 0.60 | 0.62 |
| Pendred | ||||
| No. (ears) | 4 | 1 | N/A | N/A |
| Mean (mm) | 1.87 | 2.08 | N/A | N/A |
| SD (mm) | 0.35 | N/A | N/A | |
| Trauma | ||||
| No. (ears) | N/A | 3 | 2 | 2 |
| Mean (mm) | N/A | 2.15 | 2.08 | 1.43 |
| SD (mm) | N/A | 0.34 | 0.29 | 0.53 |
Note:—N/A indicates not applicable.
Audiologic Findings
We reviewed 419 clinical audiograms from these 54 patients. A median of 6 audiograms per patient (range, 3–17) were available. The mean time between the first and last audiograms was 97.4 (SD, 50.9) months. Because of the necessary language development required to participate in SRT and WRS, these tests were not performed in patients younger than 13 months of age and 2.5 years of age, respectively, in our study population.
Five hundred ninety-three PTA measurements were obtained for 54 patients (77 ears). A linear mixed-effects model indicates that for each millimeter increase in VA size, there was an increase of 10.5 dB (95% CI, 3.1–17.9 dB; P = .006) in the PTA (Fig 2). For every additional year of age at the first audiogram, the PTA decreased by 2.1 dB (95% CI, −3.1 to −1.2 dB; P < .001). Twelve ears were classified as having fluctuating progressive hearing loss, 13 ears were classified as having fluctuating nonprogressive hearing loss, 16 ears were purely progressive, and the remaining 36 ears were classified as having stable hearing. The VA size was significantly larger in patients with fluctuating hearing loss than in patients without fluctuating hearing loss (Tables 1–4, P = .04). There was no statistically significant difference in VA size in patients with progressive and nonprogressive or stable hearing loss (Tables 1–4, P = .73). Two of 4 patients (3 of 7 ears) with a reported history of trauma had progression of hearing loss. There was no statistically significant difference in VA size in ears with progression following trauma and ears without progression following trauma (Tables 1–4, P = .51).
FIG 2.

Linear mixed-effects model with the effect estimates of VA size on the PTA (slope of line; 95% confidence interval, shaded gray). For every millimeter increase in the midpoint VA size, there is a 10.5 dB increase in the PTA (95% CI, 3.1–17.9 dB; P = .006).
One hundred fifty-nine SRT scores were obtained for 48 patients (65 ears). The linear mixed-effects model indicated that for each millimeter increase in VA size, there was an increase of 14.0 dB (95% CI, 5.2−22.7 dB; P < .002) in the SRT (Fig 3). For every additional year of age at the first audiogram, the SRT decreased by 1.8 dB (95% CI, −2.9 to −0.63 dB; P = .002).
FIG 3.

Linear mixed-effects model with the effect estimates of the VA size on the SRT (slope of line; 95% confidence interval, shaded gray). For every millimeter increase in midpoint VA size, there is an increase of 14.0 dB in the SRT (95% CI, 5.2–22.7 dB; P = .002).
Four hundred fifty-nine WRS values were obtained for 52 patients (67 ears). The linear mixed-effects model indicates a decrease of 10.5% (95% CI, −21%−0%; P = .05) in the WRS for each millimeter increase in VA size (Fig 4). For every additional year of age at the first audiogram, the WRS increased by 3.1% (95% CI, 1.6%−4.6%; P < .001).
FIG 4.

Linear mixed-effects model with the effect estimates of VA size on the WRS (slope of line; 95% confidence interval, shaded gray). For every millimeter increase in midpoint VA size, there is a 10.5% decrease in the WRS (95% CI, −21%–0%; P = .05).
DISCUSSION
EVA is the most common radiologically detected abnormality in patients undergoing evaluation for sensorineural hearing loss.1 The hearing loss can be progressive in nature and can also be associated with a stepwise progression in hearing loss in association with head trauma.2-4 Counseling of patients with EVA has, therefore, been of great importance to clinicians, though it has been challenging due to the inconsistent pattern of hearing loss, unknown pathophysiology, and mixed genetic backgrounds.5-8 These challenges in prognostication have been highlighted in a recent meta-analysis that also emphasized the need for more robust low-bias data analysis in this complex population.19
Measurements of the VA were first conducted using polytomography, in which it was considered enlarged when the anterior-posterior diameter measured ≥1.5 mm at the midpoint.10 Since the introduction of multidetector CT, the detection of EVA has continued to improve. The Cincinnati criteria suggested that VA size could be considered enlarged when the midpoint and opercular widths in the axial plane measured > 0.9 and 1.9 mm, respectively.12 However, due to the inherent obliquity of the VA relative to the axial plane, the 45° oblique (Pöschl) plane has also been proposed as an alternative plane for measurement. By means of normative values, 0.71 mm was found to be the 97.5th percentile for size, and it has been suggested that 0.8 mm at the midpoint in the Pöschl plane could be considered borderline to slightly enlarged.15 The Pöschl plane has also been considered more reliable and reproducible than measurements obtained in the axial plane.14 While the low-bias study performed by Ascha et al13 correlated speech-related auditory measures, namely the SRT and WRS, with the size of the VA using the Cincinnati method of measurement in a retrospective study,19 this correlation was not yet performed to a similar degree with the Pöschl plane measurements using repeat audiologic measures, thus, in part, limiting its value to clinicians who are attempting to counsel patients regarding their anticipated hearing outcomes.
In our study, we retrospectively reviewed a series of pediatric patients with EVA who underwent repeat audiograms to determine the correlation between the midpoint VA size in the Pöschl plane and PTA, WRS, and SRT in a longitudinal repeated-measures study. The intraclass correlation coefficient score between 2 independent, blinded radiologists was 0.92, indicating excellent interobserver reliability of the Pöschl plane midpoint measurement of VA size, consistent with findings in previous literature.14 Because of the excellent interobserver reliability, the mean values of the midpoint VA size were thought to be representative.
We found a statistically significant correlation between the midpoint VA size and the degree of hearing loss as measured by PTA, SRT, and WRS. Each additional millimeter in midpoint VA size in the Pöschl plane resulted in an increase of 10.5 dB in PTA, an increase of 14.0 dB in SRT, and a decrease of 10.5% in the WRS in our longitudinal study. Our study supports prior studies by Antonelli et al20 and Ascha et al,13 which both found a correlation between VA size as measured in the axial plane and the SRT and speech-discrimination testing. Ascha et al reported a 17.5-dB increase in the SRT and a decrease of 21% in the WRS for every millimeter increase in the midpoint size of the VA by using the axial CT Cincinnati method of measurement.13 In addition, for each additional year of age at the first audiogram, our patient cohort demonstrated an increase of 2.1 dB in the PTA, a decrease of 1.8 dB in the SRT, and an increase of 3.1% in the WRS. This finding is concordant with that of Ascha et al, who previously reported a decrease of 3.1 dB in the SRT and an increase of 1.6% in the WRS with each additional year of age at the first audiogram.
Other studies assessing the correlation between VA size and auditory measures have reported contradicting results. Zalzal et al21 and Dahlen et al22 found no correlation between VA size measured in the axial CT plane and hearing loss, with hearing loss categorized as stable or progressive, and degrees of severity such as profound, severe, moderate, and mild. This finding could possibly be explained, in part, by a limited number of patients (15 children in Zalzal et al and 11 patients in Dahlen et al), limited available audiometric data, and the possibility that the categorization of the hearing loss and the correlation performed on it might be less elucidative than measuring the performance of the ear as continuous values, the latter of which might better reflect the performance of the ear in progressive hearing loss.
Hwang et al23 attempted a 2-fold investigation of VA size, testing the reliability of multiple types of VA measurements and correlating the VA measurements with PTA data. Hwang et al concluded that the Pöschl plane permits higher predictive accuracy for hearing loss than the conventional axial plane; however, they did not find a correlation with PTA. That study was limited in the number of audiograms available and did not assess repeat audiogram measures, SRTs, or WRSs; the latter 2 measures were subsequently used by Ascha et al13 to address perceptual and cognitive-linguistic factors. In our study, repeat audiogram measures were used in a linear mixed-effects model to determine a hearing loss trend and represented our attempt to incorporate the sometimes-progressive nature of the disease.24-26
Most interesting, only 4 of the 54 patients (7/77 ears) in our study had a reported history of trauma. Two of the 4 patients (3/7 ears) had a progressive hearing loss, defined as an increase of the PTA of ≥10 dB between their first and last audiogram, in line with past studies that have reported varying incidences of hearing loss precipitated by trauma in patients with EVA ranging from 3% to 80%.3,4,20,22,25,27-38 These data corroborate the variable link between traumatic events and progression of hearing loss in patients with EVA. Although our subgroup of patients with trauma is relatively small, there was no statistically significant difference in the size of the VA in those with trauma and progressive hearing loss and those without progressive hearing loss. In our subgroup analysis of patient hearing trends, only those who were classified as having fluctuating hearing changes demonstrated a significantly larger VA size. Most interesting, all 3 patients with Pendred syndrome (5 included ears) had progressive hearing loss.
Our data are supportive of the prior study by Ascha et al13 and may be helpful for clinicians who are counseling patients regarding their anticipated hearing loss outcomes using measurements obtained in the highly reproducible Pöschl plane.
Limitations
The results reported should be considered in light of some limitations. The effect estimates in the linear mixed-effect models are based on a retrospective observational study. Therefore, they are subject to biases that may have influenced our model estimates. Limited sample size and missing values in the obtained audiologic repeated measures in this study could play a role in the significance of the statistics. However, considering the retrospective nature of this study and this relatively rare condition, it is somewhat difficult to generate a large sample size at a single institution. Future studies could consider using multicenter data to increase the sample size.
A potential confounder could be the presence of a cochlear malformation, though the exact effect remains unknown because of the incompletely understood pathophysiology of the abnormality.2 The EVA is often seen clinically in the setting of underlying cochlear malformations and might even be considered as a marker of a more extensive inner ear deformity.39 However, the degree to which hearing loss is related to the underlying EVA or the underlying cochlear malformation is challenging to separate. Antonelli et al20 demonstrated no significant correlation in the score or degree of cochlear modiolar deficiency and the severity of hearing loss in patients with EVA; however, EVA morphology and opercular size as measured in the axial plane did correlate with the severity of hearing loss. In an extensive review of human temporal bone specimens, Makary et al40 also found patients with scala communis anomalies of the cochlea with normal hearing, suggesting the complicated nature of correlating cochlear anomalies with degree of hearing loss. Nevertheless, the role of the accompanying presence of a cochlear malformation on the overall hearing outcome of these patients remains unclear; thus, for our study and in keeping with the prior study by Ascha et al,13 we included all patients with EVAs regardless of the presence of an associated cochlear malformation. Our subgroup analysis of the 50 ears in 34 patients with IP-2 anomalies demonstrated a significant difference in the size of the EVA between patients with IP-2 and those without a cochlear malformation. Thus, a conclusion from our patient population regarding the role of the IP-2 malformation versus the EVA size in the longitudinal audiometric measures was not possible. In addition, it is possible that subtle cochlear malformations may be underappreciated radiographically.
In our study, MR imaging may have been helpful to assess subtle cochlear malformations; however, only 5 patients included in this study had MR imaging studies.41,42 More research would be helpful to understand the relationship and degree of hearing loss when faced with an EVA as the sole underlying radiographic pathology (as excluded with advances in MR imaging techniques) and in the setting of known genetic abnormalities. Furthermore, we recognize that by including only pediatric patients, there is potential for bias because an EVA can occasionally be below the clinical discovery threshold or cause symptoms at a later stage of life. Further study including adult patients may be helpful to account for these patients who present later in life.
In addition, because few patients in our study had a history of trauma, the data are limited in their applicability to patients with known traumatic events and an EVA, though the incidence of hearing loss in association with traumatic events is widely variable in the literature, ranging from 3% to 80%.3,4,20,22,25,27-38 The relatively few patients with a history of trauma may reflect the counseling practices by our pediatric otolaryngologists. Similarly, because we had only 3 patients with a genetic diagnosis of Pendred syndrome, the data are also limited in their applicability to patients with genetic syndromes. Although it is interesting that all 3 patients (5 included ears) with Pendred syndrome demonstrated progressive hearing loss, further study or meta-analysis of the data with larger patient populations with genetic diagnoses would be helpful to assess a correlation among longitudinal audiologic outcomes in these patients.
CONCLUSIONS
Our longitudinal, repeated-measures study in patients with an EVA shows that midpoint VA measurements obtained in the Pöschl plane are highly reproducible and have a significant correlation with audiologic findings. For each millimeter increase in midpoint VA size in the Pöschl plane, there was an associated increase of 10.5 dB in PTA, an increase of 14.0 dB in SRT, and a decrease of 10.5% in WRS. These data may be helpful for clinicians who are counseling patients with EVAs regarding their hearing outcomes using measurements obtained in the highly reproducible Pöschl plane.
ABBREVIATIONS:
- EVA
enlarged vestibular aqueduct
- IP-2
incomplete partition-type 2
- PTA
pure tone average
- SRT
speech-reception threshold
- WRS
word recognition score
- VA
vestibular aqueduct
Footnotes
L.A. Mankarious and K.L. Reinshagen are co-senior authors.
This work was conducted with support from Harvard Catalyst/The Harvard Clinical and Translational Science Center (National Center for Advancing Translational Sciences, National Institutes of Health Award UL 1TR002541) and financial contributions from Harvard University and its affiliated academic healthcare centers.
The content is solely the responsibility of the authors and does not necessarily represent the official views of Harvard Catalyst, Harvard University and its affiliated academic healthcare centers, or the National Institutes of Health.
Disclosures: Mary E. Cunnane—UNRELATED: Consultancy: Akouos, Comments: I am retained as a consultant on volumetric measurements of tumors for which the company is developing a therapy. I have not yet done any work for them and have received no payment. Hugh D. Curtin—RELATED: Royalties: Elsevier royalties from previously published Head and Neck Imaging.
References
- 1.Mafong DD, Shin EJ, Lalwani AK. Use of laboratory evaluation and radiologic imaging in the diagnostic evaluation of children with sensorineural hearing loss. Laryngoscope 2002;112:1–7 10.1097/00005537-200201000-00001 [DOI] [PubMed] [Google Scholar]
- 2.Merchant SN. Genetically determined and other developmental defects. In: Merchant SN, Nadol JB, eds. Schuknecht’s Pathology of the Ear. 3rd ed. People’s Medical Publishing; 2010; 275–77 [Google Scholar]
- 3.Levenson MJ, Parisier SC, Jacobs M, et al. The large vestibular aqueduct syndrome in children: a review of 12 cases and the description of a new clinical entity. Arch Otolaryngol Head Neck Surg 1989;115:54–58 10.1001/archotol.1989.01860250056026 [DOI] [PubMed] [Google Scholar]
- 4.Jackler RK, De La Cruz A. The large vestibular aqueduct syndrome. Laryngoscope 1989;99:1238–42; discussion 1242–43 10.1288/00005537-198912000-00006 [DOI] [PubMed] [Google Scholar]
- 5.Pryor SP, Madeo AC, Reynolds JC, et al. SLC26A4/PDS genotype-phenotype correlation in hearing loss with enlargement of the vestibular aqueduct (EVA): evidence that Pendred syndrome and non-syndromic EVA are distinct clinical and genetic entities. J Med Genet 2005;42:159–65 10.1136/jmg.2004.024208 [DOI] [PMC free article] [PubMed] [Google Scholar]
- 6.Madden C, Halsted M, Meinzen-Derr J, et al. The influence of mutations in the SLC26A4 gene on the temporal bone in a population with enlarged vestibular aqueduct. Arch Otolaryngol Head Neck Surg 2007;133:162–68 10.1001/archotol.133.2.162 [DOI] [PubMed] [Google Scholar]
- 7.Birkenhäger R, Zimmer AJ, Maier W, et al. Evidence of a novel gene for the LAV-syndrome [in German]. Laryngorhinootologie 2007;86:102–06 10.1055/s-2006-944746 [DOI] [PubMed] [Google Scholar]
- 8.Zhao FF, Lan L, Wang DY, et al. Correlation analysis of genotypes, auditory function, and vestibular size in Chinese children with enlarged vestibular aqueduct syndrome. Acta Otolaryngol 2013;133:1242–49 10.3109/00016489.2013.822555 [DOI] [PubMed] [Google Scholar]
- 9.Griffith AJ, Arts A, Downs C, et al. Familial large vestibular aqueduct syndrome. Laryngoscope 1996;106:960–65 10.1097/00005537-199608000-00009 [DOI] [PubMed] [Google Scholar]
- 10.Valvassori GE, Clemis JD. The large vestibular aqueduct syndrome. Laryngoscope 1978;88:723–28 10.1002/lary.1978.88.5.723 [DOI] [PubMed] [Google Scholar]
- 11.Boston M, Halsted M, Meinzen-Derr J, et al. The large vestibular aqueduct: a new definition based on audiologic and computed tomography correlation. Otolaryngol Head Neck Surg 2007;136:972–77 10.1016/j.otohns.2006.12.011 [DOI] [PubMed] [Google Scholar]
- 12.Vijayasekaran S, Halsted MJ, Boston M, et al. When is the vestibular aqueduct enlarged? A statistical analysis of the normative distribution of vestibular aqueduct size. AJNR Am J Neuroradiol 2007. 28:1133–38 10.3174/ajnr.A0495 [DOI] [PMC free article] [PubMed] [Google Scholar]
- 13.Ascha MS, Manzoor N, Gupta A, et al. Vestibular aqueduct midpoint width and hearing loss in patients with an enlarged vestibular aqueduct. JAMA Otolaryngol Head Neck Surg 2017;143:601–08 10.1001/jamaoto.2016.4522 [DOI] [PMC free article] [PubMed] [Google Scholar]
- 14.Ozgen B, Cunnane ME, Caruso PA, et al. Comparison of 45 degrees oblique reformats with axial reformats in CT evaluation of the vestibular aqueduct. AJNR Am J Neuroradiol 2008;29:30–34 10.3174/ajnr.A0735 [DOI] [PMC free article] [PubMed] [Google Scholar]
- 15.Juliano AF, Ting EY, Mingkwansook V, et al. Vestibular aqueduct measurements in the 45° oblique (Pöschl) plane. AJNR Am J Neuroradiol 2016;37:1331–37 10.3174/ajnr.A4735 [DOI] [PMC free article] [PubMed] [Google Scholar]
- 16.Baiduc RR, Poling GL, Hong O, et al. Clinical measures of auditory function: the cochlea and beyond. Dis Mon 2013;59:147–56 10.1016/j.disamonth.2013.01.005 [DOI] [PMC free article] [PubMed] [Google Scholar]
- 17.Brookhouser PE, Worthington DW, Kelly WJ. Fluctuating and/or progressive sensorineural hearing loss in children. Laryngoscope 1994;104:958–64 10.1288/00005537-199408000-00009 [DOI] [PubMed] [Google Scholar]
- 18.Koo TK, Li MY. A guideline of selecting and reporting intraclass correlation coefficients for reliability research. J Chiropr Med 2016;15:155–63 10.1016/j.jcm.2016.02.012 [DOI] [PMC free article] [PubMed] [Google Scholar]
- 19.Saeed HS, Kenth J, Black G, et al. Hearing loss in enlarged vestibular aqueduct: a prognostic factor systematic review of the literature. Otol Neurotol 2021;42:99–107 10.1097/MAO.0000000000002843 [DOI] [PubMed] [Google Scholar]
- 20.Antonelli PJ, Nall AV, Lemmerling MM, et al. Hearing loss with cochlear modiolar defects and large vestibular aqueducts. Am J Otol 1998;19:306–12 [PubMed] [Google Scholar]
- 21.Zalzal GH, Tomaski SM, Vezina LG, et al. Enlarged vestibular aqueduct and sensorineural hearing loss in childhood. Arch Otolaryngol Head Neck Surg 1995;121:23–28 10.1001/archotol.1995.01890010011003 [DOI] [PubMed] [Google Scholar]
- 22.Dahlen RT, Harnsberger HR, Gray SD, et al. Overlapping thin-section fast spin-echo MR of the large vestibular aqueduct syndrome. AJNR Am J Neuroradiol 1997;18:67–75 [PMC free article] [PubMed] [Google Scholar]
- 23.Hwang M, Marovich R, Shin SS, et al. Optimizing CT for the evaluation of vestibular aqueduct enlargement: Inter-rater reproducibility and predictive value of reformatted CT measurements. J Otol 2015;10:13–17 10.1016/j.joto.2015.07.004 [DOI] [PMC free article] [PubMed] [Google Scholar]
- 24.Govaerts PJ, Casselman J, Daemers K, et al. Audiological findings in large vestibular aqueduct syndrome. Int J Pediatr Otorhinolaryngol 1999;51:157–64 10.1016/S0165-5876(99)00268-2 [DOI] [PubMed] [Google Scholar]
- 25.Gopen Q, Zhou G, Whittemore K, et al. Enlarged vestibular aqueduct: review of controversial aspects. Laryngoscope 2011;121:1971–78 10.1002/lary.22083 [DOI] [PubMed] [Google Scholar]
- 26.Lai CC, Shiao AS. Chronological changes of hearing in pediatric patients with large vestibular aqueduct syndrome. Laryngoscope 2004;114:832–38 10.1097/00005537-200405000-00008 [DOI] [PubMed] [Google Scholar]
- 27.Arcand P, Desrosiers M, Dubé J, et al. The large vestibular aqueduct syndrome and sensorineural hearing loss in the pediatric population. J Otolaryngol 1991;20:247–50 [PubMed] [Google Scholar]
- 28.Madden C, Halsted M, Benton C, et al. Enlarged vestibular aqueduct syndrome in the pediatric population. Otol Neurotol 2003;24:625–32 10.1097/00129492-200307000-00016 [DOI] [PubMed] [Google Scholar]
- 29.Berrettini S, Forli F, Bogazzi F, et al. Large vestibular aqueduct syndrome: audiological, radiological, clinical, and genetic features. Am J Otolaryngol 2005;26:363–71 10.1016/j.amjoto.2005.02.013 [DOI] [PubMed] [Google Scholar]
- 30.Okumura T, Takahashi H, Honjo I, et al. Sensorineural hearing loss in patients with large vestibular aqueduct. Laryngoscope 1995;105:289–93; discussion 293–34 10.1288/00005537-199503000-00012 [DOI] [PubMed] [Google Scholar]
- 31.Harker LA, Vanderheiden S, Veazey D, et al. Multichannel cochlear implantation in children with large vestibular aqueduct syndrome. Ann Otol Rhinol Laryngol Suppl 1999;177:39–43 10.1177/00034894991080s409 [DOI] [PubMed] [Google Scholar]
- 32.Lin CY, Lin SL, Kao CC, et al. The remediation of hearing deterioration in children with large vestibular aqueduct syndrome. Auris Nasus Larynx 2005;32:99–105 Jun 10.1016/j.anl.2004.11.001 [DOI] [PubMed] [Google Scholar]
- 33.Colvin IB, Beale T, Harrop-Griffiths K. Long-term follow-up of hearing loss in children and young adults with enlarged vestibular aqueducts: relationship to radiologic findings and Pendred syndrome diagnosis. Laryngoscope 2006;116:2027–36 10.1097/01.mlg.0000240908.88759.fe [DOI] [PubMed] [Google Scholar]
- 34.Steinbach S, Brockmeier SJ, Kiefer J. The large vestibular aqueduct–case report and review of the literature. Acta Otolaryngol 2006;126:788–95 10.1080/00016480500527276 [DOI] [PubMed] [Google Scholar]
- 35.Grimmer JF, Hedlund G, Park A. Steroid treatment of hearing loss in enlarged vestibular aqueduct anomaly. Int J Pediatr Otorhinolaryngol 2008;72:1711–15 10.1016/j.ijporl.2008.08.009 [DOI] [PubMed] [Google Scholar]
- 36.Atkin JS, Grimmer JF, Hedlund G, et al. Cochlear abnormalities associated with enlarged vestibular aqueduct anomaly. Int J Pediatr Otorhinolaryngol 2009;73:1682–85 10.1016/j.ijporl.2009.08.028 [DOI] [PubMed] [Google Scholar]
- 37.Ma X, Yang Y, Xia M, et al. Computed tomography findings in large vestibular aqueduct syndrome. Acta Otolaryngol 2009;129:700–08 10.1080/00016480802412813 [DOI] [PubMed] [Google Scholar]
- 38.Mamikoğlu B, Bentz B, Wiet RJ. Large vestibular aqueduct syndrome presenting with mixed hearing loss and an intact mobile ossicular chain. Otorhinolaryngol Nova 2000;10:204–06 10.1159/000054818 [DOI] [Google Scholar]
- 39.Irving RM, Jackler RK. Large vestibular aqueduct syndrome. Current Opinion in Otolaryngology & Head and Neck Surgery 1997;5:267–71 10.1097/00020840-199710000-00001 [DOI] [Google Scholar]
- 40.Makary C, Shin J, Caruso P, et al. A histological study of scala communis with radiological implications. Audiol Neurotol 2010;15:383–93 10.1159/000307345 [DOI] [PMC free article] [PubMed] [Google Scholar]
- 41.Reinshagen KL, Curtin HD, Quesnel AM, et al. Measurement for detection of incomplete partition type II anomalies on MR imaging. AJNR Am J Neuroradiol 2017;38:2003–07 10.3174/ajnr.A5335 [DOI] [PMC free article] [PubMed] [Google Scholar]
- 42.Hirai S, Cureoglu S, Schachern PA, et al. Large vestibular aqueduct syndrome: a human temporal bone study. Laryngoscope 2006;116:2007–11 10.1097/01.mlg.0000237673.94781.0a [DOI] [PubMed] [Google Scholar]