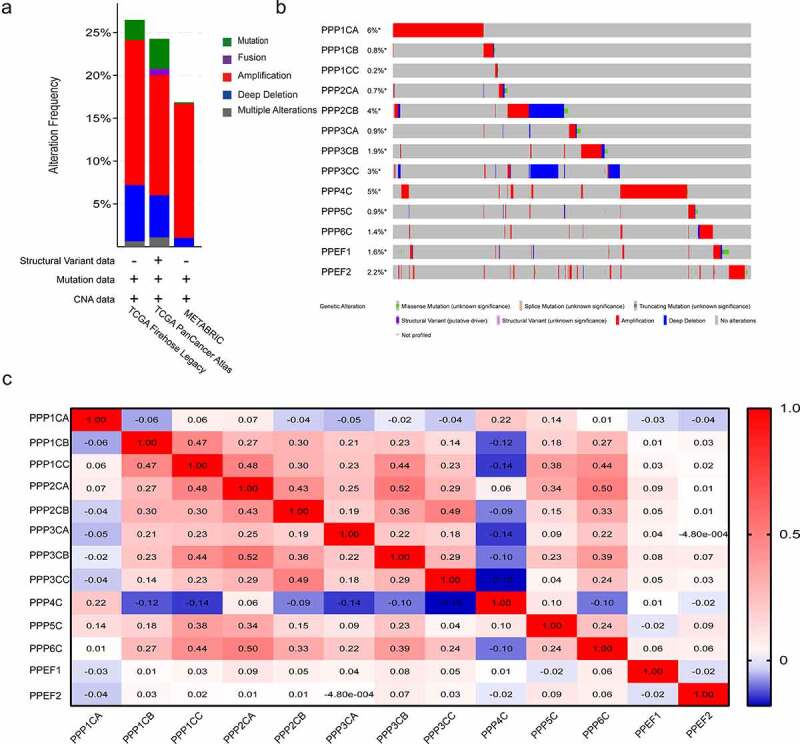
Figure 2.

Gene alterations and coexpression analysis of the PPPCs family in breast cancer. (a-b) Genetic and transcriptional alterations of the PPPCs family in the METABRIC dataset, TCGA (PanCancer Atlas dataset) and TCGA (Firehose Legacy, 2015 dataset) analyzed using the cBioPortal database. (c) Genetic coexpression of the PPPCs family in breast cancer using the GEPIA database. Darker colors indicated stronger associations. Linear dependence was measured using Pearson’s correlation coefficient. P-value <0.05 was set as the thresholds.
