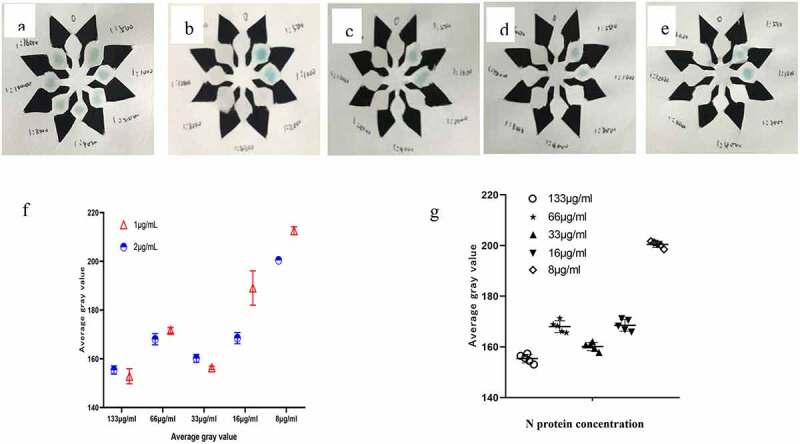
Figure 4.

(a–e) The color development result when the N protein concentration is 133 μg/ml, 66 μg/ml, 33 μg/ml, 16 μg/ml, 8 μg/ml. f Comparison of average gray value at different N protein concentration(t = 1.069, P = 0.3163).g When the concentration is 1 μg/ml, the average gray value of N protein at different concentrations(F = 441.4, P < 0.001).
