

ABSTRACT
Long noncoding RNA muskelin 1 antisense RNA (MKLN1-AS) acted as an oncogenic regulator in hepatocellular carcinoma (HCC). This study was performed to investigate the functional mechanism of MKLN1-AS. MKLN1-AS, microRNA-22-3p (miR-22-3p) and ETS Proto-Oncogene 1 (ETS1) levels were examined using reverse transcription-quantitative polymerase-chain reaction. Protein expression was detected by Western blot. The target relation was analyzed by dual-luciferase reporter assay, RNA immunoprecipitation assay and RNA pull-down assay. Cell proliferation ability was determined through cell counting kit-8 assay, colony formation assay and ethylenediurea assay. Angiogenesis was examined by tube formation assay. Cell migration and invasion were assessed via transwell assay. In vivo research was conducted by xenograft tumor model in nude mice. MKLN1-AS was upregulated in HCC tissues and cells. ETS1 promoted the ETS1 expression by binding to the 582–596 sites. Silence of MKLN1-AS suppressed cell growth, angiogenesis, migration, and invasion. MKLN1-AS interacted with miR-22-3p in HCC cells. The function of MKLN1-AS downregulation was relieved by miR-22-3p inhibition in HCC cells. ETS1 was validated as a target of miR-22-3p, and MKLN1-AS upregulated the ETS1 expression by sponging miR-22-3p. Overexpression of miR-22-3p retarded HCC progression by downregulating the level of ETS1. Tumor growth in vivo was also enhanced by MKLN1-AS through the regulation of miR-22-3p/ETS1 axis. These data demonstrated that ETS1-mediated MKLN1-AS contributed to the malignant phenotypes of HCC cells via depending on the miR-22-3p/ETS1 regulatory axis.
KEYWORDS: MKLN1-AS, miR-22-3p, ETS1, hepatocellular carcinoma
Introduction
Hepatocellular carcinoma (HCC) is the most common subtype of primary liver cancers with late diagnosis and poor prognosis [1]. HCC has been considered as an aggressive malignant tumor and the mortality rate remains high in HCC patients [2]. A number of biological molecules are implicated in oncogenesis and progression of HCC, and molecular targeted therapy is useful for early diagnosis [3].
Long noncoding RNAs (lncRNAs) are essential regulators in physiologic processes of HCC [4]. Muskelin 1 antisense RNA (MKLN1-AS) has been reported as a novel prognostic target for HCC [5,6]. Guo et al. stated that MKLN1-AS contributed to carcinogenesis and development of HCC cells and in vivo [7]. LncRNAs can affect gene expression by functioning as natural sponges of microRNAs (miRNAs) in cancer regulation, including HCC [8]. However, how MKLN1-AS affects the HCC progression is not clear.
ETS Proto-Oncogene 1 (ETS1) is a transcription factor with vital involvement in tumor development [9]. ETS1 has exerted the carcinogenic roles in different kinds of cancers, such as prostate cancer, ovarian cancer, and breast cancer [10–12]. In addition, miR-139-5p and miR-129-5p impeded the malignant behaviors of HCC cells by downregulating the expression of ETS1 [13,14]. LncRNA microRNA 4435–2HG (MIR4435-2HG) facilitated proliferation and metastasis by inhibiting miR-22-3p to trigger the upregulation of tyrosine 3-monooxygenase/tryptophan 5-monooxygenase activation protein zeta (YWHAZ) in HCC cells [15], and metastasis-associated lung adenocarcinoma transcript 1 (MALAT1) promoted HCC progression through the regulation of inhibitors of apoptosis (IAPs) via targeting miR-22-3p [16]. The association of MKLN1-AS with oncogenic ETS1 and anti-tumor miR-22-3p remains to be explored.
Herein, MKLN1-AS was hypothesized to act as a sponge of miR-22-3p and ETS1 was assumed to serve as a target of miR-22-3p. The aim of this study was to explore MKLN1-AS/miR-22-3p/ETS1 signal axis in the development of HCC.
Materials and methods
Human specimens
HCC tissues (n = 66) and normal controls (NC, n = 66) were acquired from HCC patients during surgical resection at Shengli oilfield central hospital. Blood samples were collected from HCC patients (n = 23) and NC subjects (n = 30), followed by centrifugation at 4°C to obtain the supernatant serum. All specimens were saved at −80°C. These participants have signed the informed consent files. ETS1 protein level was identified through Immunohistochemistry (IHC) detection [17]. This study was approved by the Ethics Committee of Shengli oilfield central hospital, and the procedures strictly followed the Declaration of Helsinki.
Cell lines
Liver epithelial cell-line THLE-2 and HCC cell lines (HuH7, Hep3B, MHCC97-H, LM3) were commercially bought from BioVector NTCC Inc. (Beijing, China). Cell lines were incubated with Roswell Park Memorial Institute-1640 (RPMI-1640; KeyGen, Nanjing, China) containing 10% new-born bovine serum and 1% penicillin-streptomycin. Cells growth was performed in a 5% CO2 incubator at 37°C.
Cell transfection
Small interfering RNA (siRNA) negative control (si-NC), siRNA-ETS1 (si-ETS1), pEXP-RB-Mam vector (vector), pEXP-RB-Mam-ETS1 vector (ETS1), short hairpin RNA (shRNA) negative control vector (sh-NC), shRNA-MKLN1-AS lentivirus vector (sh-MKLN1-AS#1, sh-MKLN1-AS#2, sh-MKLN1-AS#3) were purchased from RIBOBIO (Guangzhou, China). MiRNA mimic negative control (miR-NC), miR-22-3p mimic (miR-22-3p), miRNA inhibitor negative control (anti-NC), miR-22-3p inhibitor (anti-miR-22-3p) were gained from Genepharma (Shanghai, China). Lipofectamine™ 3000 Kit (Invitrogen, Carlsbad, CA, USA) was adopted for transfection in HuH7 and LM3 cells, following the supplied instruction book.
Reverse transcription-quantitative polymerase chain reaction (RT-qPCR) assay
RNA was extracted by Trizol total RNA extractor (KeyGen) according to the manufacturer’s direction. The First Strand cDNA Synthesis Kit and SYBR Green Realtime PCR Master Mix (KeyGen) were exploited for reverse transcription and quantitative analysis. The relative expression was calculated through the 2−∆∆Ct method [18]. LncRNA and mRNA levels were standardized to β-actin, and miRNA level was corrected by U6. In addition, nuclear and cytoplastic RNAs were isolated using PARIS™ Kit (Invitrogen) followed by the localization examination of MKLN1-AS through RT-qPCR. The cytoplastic glyceraldehyde-phosphate dehydrogenase (GAPDH) and nuclear U6 served as the internal controls. The primer sequences were displayed in Table 1.
Table 1.
Primer sequences used for RT-qPCR
| Name | Primer sequences (5ʹ-3ʹ) |
|---|---|
| MKLN1-AS | Forward: GTGTTTCTCTCTGAAAGCAGCG Reverse: TTCAAAAGTGACCAAAGCCAGG |
| miR-22-3p | Forward: GCCGAGAAGCTGCCAGTTGA Reverse: CTCGTATCCAGTGCAGGGTC |
| ETS1 | Forward: TGAGGTAGCTTAGAGATGTAGCG |
| Reverse: ATGTGCCAGCATCAGCTACT | |
| β-actin | Forward: GGATTCCTATGTGGGCGACGA Reverse: GCGTACAGGGATAGCACAGC |
| GAPDH | Forward: AATGGGCAGCCGTTAGGAAA |
| Reverse: GCGCCCAATACGACCAAATC | |
| U6 | Forward: ATTGGAACGATACAGAGAAGATT Reverse: GGAACGCTTCACGAATTTG |
RNA immunoprecipitation (RIP) assay
Imprint® RNA Immunoprecipitation Kit (Sigma, St. Louis, MO, USA) was used for RIP detection as per the user’s manual. For MKLN1-AS and ETS1, cells were incubated with antibody-Protein A magnetic beads (anti-immunoglobulin G, anti-IgG; anti-ETS1) and MKLN1-AS expression was analyzed by RT-qPCR. For MKLN1-AS and miR-22-3p, MKLN1-AS and miR-22-3p levels were determined via RT-qPCR after cell incubation with magnetic beads of anti-IgG or anti-Argonaute-2 (anti-Ago2) group.
Dual-luciferase reporter assay
The binding prediction was performed by Jaspar (http://jaspar.genereg.net/search?advanced=true), lncBase (http://carolina.imis.athena-innovation.gr/diana_tools/web/index.php?r=lncbasev2/index-predicted) and starbase (http://starbase.sysu.edu.cn). Dual-luciferase reporter assay was performed for binding analysis [19]. The sequence of MKLN1-AS (582–596) was cloned into the pmirGLO vector (Promega, Madison, WI, USA) to generate the pmirGLO-WT vector, and the mutant vector pmirGLO-MUT was used as the control group. HuH7 and LM3 cells were co-transfected with vector or ETS1 and pmirGLO, pmirGLO-WT or pmirGLO-MUT for 48 h, then luciferase level detection was conducted using Dual-luciferase Reporter Kit (Promega). Besides, the luciferase vectors for MKLN1-AS-WT and ETS1-3ʹUTR-WT containing miR-22-3p binding sites were constructed. MKLN1-AS-MUT and ETS1-3ʹUTR-MUT was used as the mutant controls. The vector was co-transfected with miR-NC or miR-22-3p, followed by the analysis of luciferase level.
Cell Counting Kit-8 (CCK-8) assay
5 × 10³/well HuH7 and LM3 cells were cultured for 24 h, followed by different transfection for increasing times (24 h, 48 h, 72 h). 10 μL/well CCK-8 solution (KeyGen) was pipetted into cells for 4 h, then optical density at a wavelength of 450 nm was measured under a microplate reader.
Colony formation assay
12-well plates were seeded with 500/well HuH7 and LM3 cells. The white colonies were observed after cell culture for two weeks, then colonies were stained with crystal violet (Sigma). Cell colony number was counted through Image J software (NIH, Bethesda, MD, USA).
EDU assay
Cell proliferation was analyzed via EdU assay by kFluor555 Click-iT EDU Kit (KeyGen) [20]. 4 × 10⁴ cells were plated in the 96-well plates overnight and cell transfection was performed for 48 h, followed by cell labeling with EDU working solution. After fixation and infiltration, cells were detected with 100 μL Click-iT EDU mixture. Meanwhile, cell nucleus was stained with Diamidine phenylindole (DAPI; KeyGen). The positive stained cells (EDU+DAPI) were counted by a fluorescence microscope (Olympus, Tokyo, Japan).
Tube formation assay
The angiogenetic ability was assessed through the capillary-like network formation of human umbilical vein endothelial cells (HUVECs). The 96-well plates were coated with 60 μL/well Matrigel (BD Bioscience, San Diego, CA, USA), then co-cultured with HuH7 or LM3 cells and HUVECs (BioVector NTCC Inc.). 48 h later, capillary-like branches were counted by a computer-assisted microscope.
Transwell assay
24-well transwell chamber (Corning Inc., Corning, NY, USA) was used for transwell assay [21]. 4 × 10⁵ cells were inoculated into the upper chamber for migration detection, and the equal number of cells were seeded into the upper chamber coated with matrigel (Corning Inc). The bottom chamber was added with 600 μL cell medium, followed by incubation at 37°C for 24 h. The migrated and invaded cells from the upper chamber into the lower chamber were stained with 0.1% crystal violet (Sigma). Cell pictures were taken by an inverted microscope (Olympus) with 100 × magnification, and cells in three fields of view were counted.
Western blot
The total proteins were purified by Radioimmunoprecipitation assay lysis buffer (KeyGen), and the examination of protein concentration was conducted through BCA Protein Assay Kit (KeyGen). Protein analysis with 50 μg proteins/sample was measured as previously stated [22]. The used antibodies were bought from Abcam (Cambridge, UK), including anti-ETS1 (ab220361, 1:1000), anti-proliferating cell nuclear antigen (anti-PCNA; ab18197, 1:1000), anti-cleaved-caspase 3 (ab2302, 1;1000), anti-E-cadherin (ab40772, 1:1000), anti-N-cadherin (ab18203, 1:1000), anti-β-actin (ab213262, 1:1000) Goat Anti-Rabbit IgG H&L secondary antibody (ab205718, 1:5000). The protein level was normalized by β-actin. The gray level of protein band was analyzed via ImageJ software (NIH).
RNA pull-down assay
Biotin-coupled mimics (Bio-miR-22-3p, Bio-NC) were bought from RIBOBIO, followed by transfection in HuH7 and LM3 cells for 48 h. After cell incubation with streptavidin magnetic beads (Thermo Fisher Scientific, Waltham, MA, USA) overnight, then RNA samples on the beads were purified. MKLN1-AS expression was detected through RT-qPCR.
Tumor xenograft assay
2 × 10⁶ HuH7 cells with sh-NC or sh-MKLN1-AS#1 transfection in 200 μL 1 × PBS (Sigma) were injected into the flank of BALB/c male nude mice (Vital River Laboratory Animal Technology Co., Ltd., Beijing, China). There were six mice in each group. Tumor size was measured every 5 days, then tumor volume (length × width2/2) was calculated and growth curve was plotted. After 35 days, tumor tissues were dissected from the sacrificed mice and tumor weight was determined by an electronic scale. RNA and protein levels in tissues were quantified through RT-qPCR and Western blot. Additionally, ki67 and ETS1 protein expression levels in tumor tissues were detected by IHC analysis. All protocols in animal assay were authorized by the Animal Ethical Committee of Shengli oilfield central hospital.
Statistical analysis
Three independent repetitions of experiments were conducted with three parallels. The relation analysis was conducted through Pearson’s correlation coefficient in human samples. Log-rank test was adopted to analyze the patient survival. Data were shown as the mean ± standard deviation (SD) and analyzed via SPSS 22.0 (SPSS Inc., Chicago, IL, USA). Student’s t-test and analysis of variance (ANOVA) followed by Tukey’s test were employed to assess statistical difference. P < 0.05 suggested that difference was significant.
Results
MKLN1-AS was highly expressed in HCC samples and cells
Dysregulated circRNAs usually regulate the malignant progression of HCC via targeting miRNA/mRNA axis. The objective of this study was to explore how MKLN1-AS exerted the oncogenic role in HCC. MKLN1-AS was assumed to mediate EST1 expression by binding to miR-22-3p. Firstly, MKLN1-AS expression quantification was performed by RT-qPCR. GSE101728 dataset revealed that the level of MKLN1-AS was much higher in HCC tissues than that in normal tissues (Figure 1a). TCGA data also indicated that MKLN1-AS was upregulated in 374 HCC samples relative to 50 normal samples (Figure 1b), and the prognosis was poor in HCC patients with high expression of MKLN1-AS (Figure 1c). Also, we have detected the aberrant upregulation of MKLN1-AS in 66 HCC tissues (Figure 1d) and 23 HCC serum samples (Figure 1e) compared with the normal controls. Meanwhile, the MKLN1-AS expression was significantly elevated in HCC cell lines (HuH7, Hep3B, MHCC97-H, LM3) contrasted to THLE-2 cells line (figure 1f). The survival rate was reduced in MKLN1-AS high group (n = 33) compared to MKLN1-AS low group (n = 33) of HCC patients (Figure 1g). Thus, MKLN1-AS was abnormally upregulated in HCC and it was associated with poor prognosis of patients.
Figure 1.
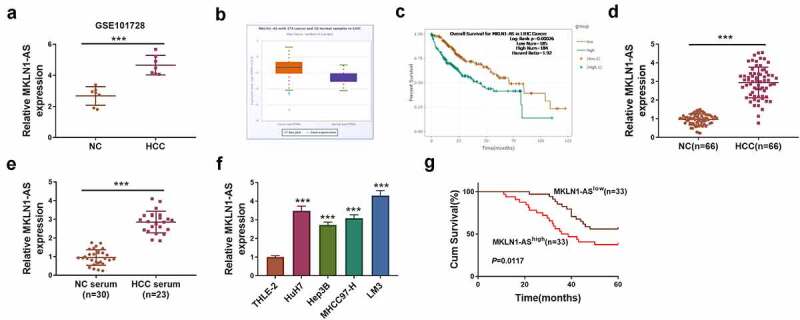
MKLN1-AS was highly expressed in HCC samples and cells. (a-b) GSE101728 dataset (a) and TCGA (b) indicated the high expression of MKLN1-AS in HCC samples. (c) MKLN1-AS was related to the poor prognosis. (d-f) MKLN1-AS expression quantification was conducted by RT-qPCR in 66 HCC tissues (d), 23 serum samples (e) and 4 HCC cell lines (f). (g) The survival rate was analyzed by log-rank test in 66 HCC patients. ***P < 0.001.
ETS1 regulated the level of MKLN1-AS in HCC cells
Jaspar indicated that the promoter region of MKLN1-AS (site 1: 1976–1990, site 2: 1351–1365, site 3: 582–596, site 4: 145–149) contained the ETS1 binding sites (Figure 2a). RT-qPCR demonstrated that si-ETS1 and ETS1 transfection could effectively inhibit and promote the expression of ETS1 in HuH7 and LM3 cells, respectively (Figure 2b). Subsequently, we found that knockdown of ETS1 reduced the level of MKLN1-AS but overexpression of ETS1 increased the expression of MKLN1-AS (Figure 2c). To explore the binding region of ETS1 in MKLN1-AS promoter sequence, we have performed RIP assay to determine the potential interaction of ETS1 with four sites of MKLN1-AS. As shown in Figure 2d, ETS1 was identified to combine with the site 3 (582–596) of MKLN1-AS promoter. Dual-luciferase reporter assay exhibited that ETS1 overexpression promoted the luciferase level of pmirGLO-WT group (containing the 582–596 sites of MKLN1-AS) rather than pmirGLO and pmirGLO-MUT groups in HuH7 and LM3 cells (Figure 2e-f). These results validated that ETS1 could regulate the MKLN1-AS expression by binding to the site 3 (582–596) of MKLN1-AS promoter.
Figure 2.

ETS1 regulated the level of MKLN1-AS in HCC cells. (a) Jaspar predicted the binding sites between ETS1 and MKLN1-AS. (b) RT-qPCR was used to evaluate the efficiencies of si-NC or ETS1 transfection in HuH7 and LM3 cells. (c) The effect of ETS1 on the MKLN1-AS level was determined using RT-qPCR. (d-f) RIP assay (d) and dual-luciferase reporter assay (e-f) were applied to explore the binding region of ETS1 and MKLN1-AS. ***P < 0.001.
MKLN1-AS downregulation impeded the malignant progression in HCC cells
The transfection efficiencies of shRNA vectors targeting MKLN1-AS were assessed by RT-qPCR. The results indicated that the sh-MKLN1-AS#1-mediated expression knockdown of MKLN1-AS was the most significant (Figure 3a). Then, CCK-8 assay suggested that cell proliferation was repressed in sh-MKLN1-AS#1 group relative to sh-NC group (Figure 3b). Also, the silence of MKLN1-AS reduced the colony number (Figure 3c) and EDU positive cell percentage (Figure 3d). In addition, tube formation assay showed that angiogenesis of HUVECs was inhibited by siRNA MKLN1-AS (Figure 3e). The results of transwell assay exhibited that cell migration (figure 3f) and invasion (Figure 3g) were suppressed with the downregulation of MKLN1-AS. The protein markers related to cell behaviors were examined by Western blot. MKLN1-AS knockdown has induced the downregulation of PCNA and N-cadherin but the upregulation of cleaved-caspase 3 and E-cadherin in HuH7 and LM3 cells (Figure 3h). Taken together, silencing MKLN1-AS suppressed the malignant phenotypes of HCC cells.
Figure 3.

MKLN1-AS downregulation impeded the malignant progression in HCC cells. (a) The knockdown effects of sh-MKLN1-AS#1, sh-MKLN1-AS#2, sh-MKLN1-AS#3 on the MKLN1-AS level were assessed by RT-qPCR. (b-d) The detection of cell proliferation was performed through CCK-8 (b), colony formation assay (c) and EDU assay (d) in HuH7 and LM3 cells transfected with sh-NC or sh-MKLN1-AS#1. (e) The examination of angiogenesis was performed by tube formation assay. (f-g) The determination of cell migration (f) and invasion (g) was performed by transwell assay. (h) The protein analysis of PCNA, cleaved-caspase 3, E-cadherin and N-cadherin was performed using Western blot. *P < 0.05, **P < 0.01, ***P < 0.001.
MKLN1-AS targeted miR-22-3p in HCC cells
RT-qPCR was used to determine the localization of MKLN1-AS in HCC cells. As depicted in Figure 4a, MKLN1-AS was mainly localized in the cytoplasm of HuH7 and LM3 cells. The binding sites between MKLN1-AS and miR-22-3p were predicted by lncBase (Figure 4b). Then, dual-luciferase reporter assay was conducted to analyze the interaction between miR-22-3p and MKLN1-AS. The miR-22-3p expression has been increased by 10-fold changes after transfection of miR-22-3p, relative to transfection of miR-NC (Figure 4c). There was an inhibitory effect of miR-22-3p overexpression on the luciferase level of MKLN1-AS-WT group, while no difference was found in that of MKLN1-AS-MUT group in HuH7 and LM3 cells (Figure 4d). RIP assay showed that MKLN1-AS and miR-22-3p were enriched in anti-Ago2 group compared to anti-IgG group (Figure 4e). Moreover, MKLN1-AS could be pulled down by Bio-miR-22-3p compared with Bio-NC group (figure 4f). The level of miR-22-3p was markedly downregulated in HCC tissues contrasted to NC tissues (Figure 4g), and MKLN1-AS was negatively correlated to miR-22-3p (r = −0.6396, p < 0.001) in 66 HCC tissues (Figure 4h). The low expression of miR-22-3p was also detected in HCC cell lines by comparison with THLE-2 cell line (Figure 4i). These results demonstrated that MKLN1-AS was a miR-22-3p sponge.
Figure 4.
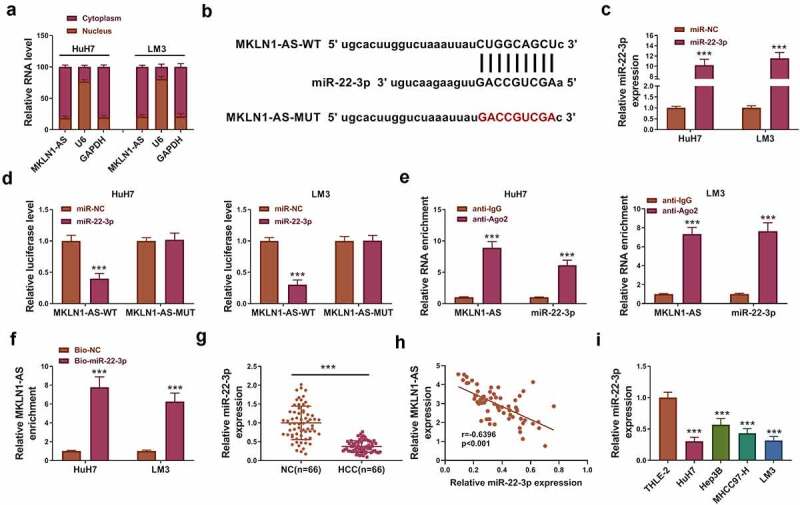
MKLN1-AS targeted miR-22-3p in HCC cells. (a) MKLN1-AS, U6 and GAPDH levels were examined by RT-qPCR in cytoplasmic and nuclear fractions. (b) The site analysis between MKLN1-AS and miR-22-3p was performed by lncBase. (c) The level of miR-22-3p was analyzed by RT-qPCR in miR-NC or miR-22-3p transfected HuH7 and LM3 cells. (d-f) Dual-luciferase reporter assay (d), RIP assay (e) and RNA pull-down assay (f) were conducted to analyze the interaction between miR-22-3p and MKLN1-AS. (g) RT-qPCR was used for expression detection of miR-22-3p in 66 HCC samples. (h) Pearson’s correlation coefficient was conducted for linear analysis between MKLN1-AS and miR-22-3p in HCC tissues. (i) The expression of miR-22-3p was measured by RT-qPCR in HCC cells. ***P < 0.001.
Inhibition of miR-22-3p attenuated the function of MKLN1-AS knockdown in HCC cells
MKLN1-AS/miR-22-3p axis was explored in HuH7 and LM3 cells after transfection with sh-NC+anti-NC, sh-MKLN1-AS#1+ anti-NC and sh-MKLN1-AS#1+ anti-miR-22-3p. The miR-22-3p upregulation caused by sh-MKLN1-AS#1 was eliminated by anti-miR-22-3p, showing that anti-miR-22-3p transfection resulted in the successful expression inhibition of miR-22-3p (Figure 5a). With the downregulation of miR-22-3p level, the inhibitory effects of sh-MKLN1-AS#1 on cell proliferation (Figure 5b-d) and angiogenesis (Figure 5e) were relieved in part. Also, miR-22-3p inhibitor partly abolished the sh-MKLN1-AS#1-induced suppression of cell migration and invasion in HuH7 and LM3 cells (figure 5f-g). The expression changes of PCNA, cleaved-caspase 3, E-cadherin and N-cadherin induced by knockdown of MKLN1-AS were counterbalanced after miR-22-3p expression reduction (Figure 5h). All in all, MLLN1-AS regulated the HCC progression via sponging miR-22-3p.
Figure 5.
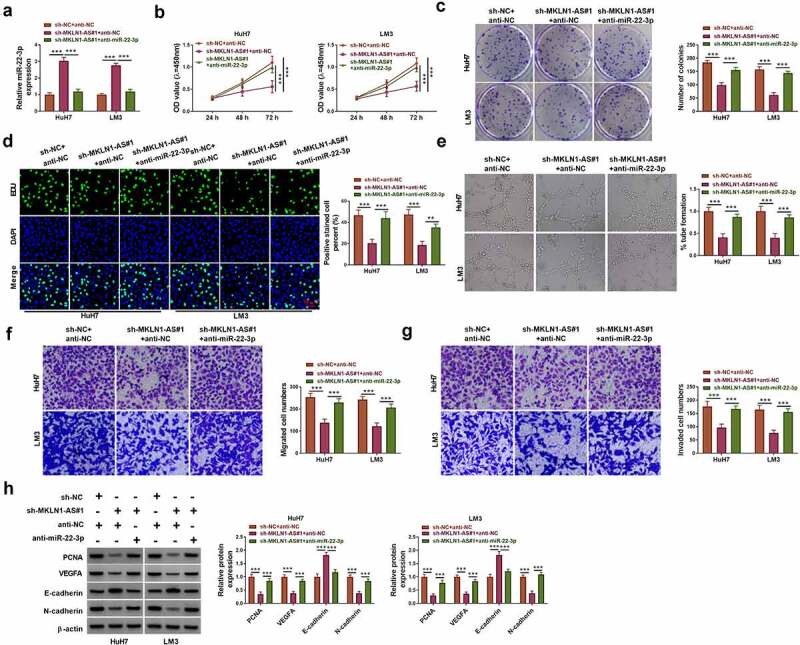
Inhibition of miR-22-3p attenuated the function of MKLN1-AS knockdown in HCC cells. HuH7 and LM3 cells were transfected with sh-NC+anti-NC, sh-MKLN1-AS#1+ anti-NC or sh-MKLN1-AS#1+ anti-miR-22-3p. (a) RT-qPCR was applied to determine the miR-22-3p level. (b-d) CCK-8 assay (b), colony formation assay (c) and EDU assay (d) were applied to detect cell proliferation. (e) Tube formation assay was used to analyze the angiogenetic ability. (f-g) Transwell assay was used to examine cell migration (f) and invasion (g). (h) Western blot was used to measure the protein levels of PCNA, cleaved-caspase 3, E-cadherin and N-cadherin. **P < 0.01, ***P < 0.001.
MKLN1-AS affected the expression of ETS1 through the sponge effect on miR-22-3p
The miR-22-3p binding sites were predicted in the ETS1-3ʹUTR sequence by starbase (Figure 6a). The luciferase level of ETS1-3ʹUTR-WT plasmid was inhibited by miR-22-3p overexpression, while no change of luciferase level was observed in ETS1-3ʹUTR-MUT plasmid (Figure 6b). Thus, miR-22-3p interacted with the ETS1-3ʹUTR in HuH7 and LM3 cells. ETS1 protein level was directly repressed following overexpression of miR-22-3p (Figure 6c). Additionally, sh-MKLN1-AS#1 induced the downregulation of ETS1 protein expression but this effect was lightened by anti-miR-22-3p (Figure 6d). IHC assay and RT-qPCR exhibited that ETS1 protein and mRNA levels were higher in HCC samples than these in NC samples (Supplementary Fig S1A-B). The Western blot result also affirmed that ETS1 was highly expressed in HCC cells (HuH7, Hep3B, MHCC97-H, LM3) by contrast with THLE-2 cells (Supplementary Fig S1C). MKLN1-AS regulated the level of ETS1 by depending on the miR-22-3p sponging mechanism.
Figure 6.
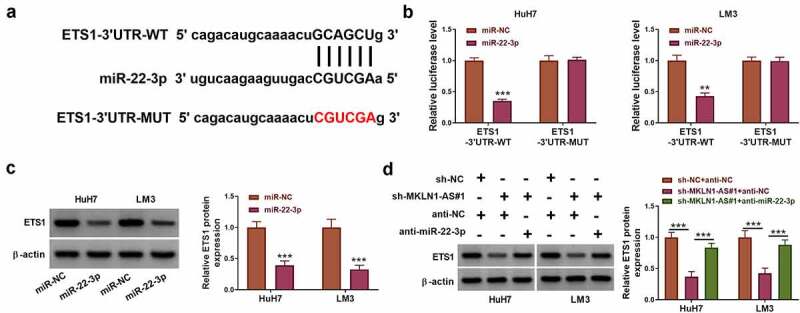
MKLN1-AS affected the expression of ETS1 through the sponge effect on miR-22-3p. (a) Starbase showed the binding sites between ETS1 3ʹUTR and miR-22-3p. (b) The interaction between miR-22-3p and ETS1 3ʹUTR was analyzed using dual-luciferase reporter assay. (c) ETS1 protein expression was determined using Western blot after miR-NC or miR-22-3p transfection. (d) ETS1 expression detection was performed by Western blot in sh-NC+anti-NC, sh-MKLN1-AS#1+ anti-NC and sh-MKLN1-AS#1+ anti-miR-22-3p groups. **P < 0.01, ***P < 0.001.
ETS1 overexpression abrogated the anti-tumor function of miR-22-3p in HCC cells
ETS1 protein expression was elevated in miR-22-3p+ETS1 group relative to miR-22-3p+vector group, which demonstrated that transfection efficiency of ETS1 was significant (Figure 7a). Cell proliferation by CCK-8 assay (Figure 7b), colony formation assay (Figure 7c) and EDU assay (Figure 7d) showed that ETS1 transfection counteracted the miR-22-3p-induced proliferation inhibition in HuH7 and LM3 cells. The miR-22-3p mimic suppressed tube formation ability (Figure 7e), cell migration and invasion (figure 7f-g), whereas these effects were mitigated by the introduction of ETS1. Transfection of miR-22-3p regulated the protein levels related to cell proliferation, apoptosis and migration through the direct downregulation of ETS1 in HuH7 and LM3 cells (Figure 7h). The above evidence manifested that miR-22-3p functioned as a tumor inhibitor by repressing the level of ETS1 in HCC cells.
Figure 7.
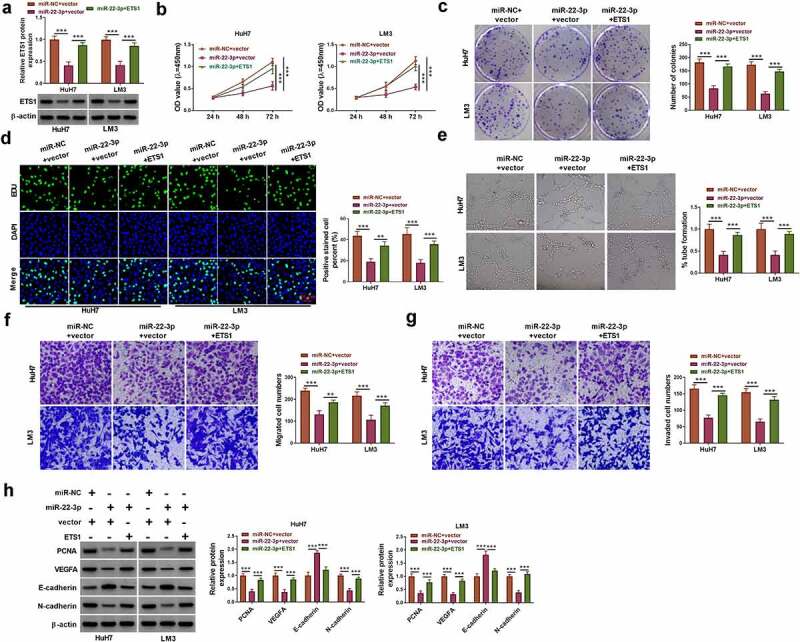
ETS1 overexpression abrogated the anti-tumor function of miR-22-3p in HCC cells. Transfection of miR-NC+vector, miR-22-3p+vector and miR-22-3p+ETS1 was conducted in HuH7 and LM3 cells. (a) The protein expression of ETS1 was determined via Western blot. (b-d) Cell proliferation was evaluated via CCK-8 assay (b), colony formation assay (c) and EDU assay (d). (e) Angiogenesis was assessed via tube formation assay. (f-g) Cell migration (f) and invasion (g) were examined via transwell assay. (h) PCNA, cleaved-caspase 3, E-cadherin and N-cadherin protein levels were analyzed using Western blot. **P < 0.01, ***P < 0.001.
MKLN1-AS promoted tumor growth via mediating the miR-22-3p/ETS1 axis in HCC xenograft model
Tumor volume and weight of sh-MKLN1-AS#1 group were reduced in mice, compared to sh-NC group (Figure 8a-b). MKLN1-AS knockdown has triggered the downregulation of MKLN1-AS and upregulation of miR-22-3p in tumor tissues (Figure 8c). Western blot revealed that ETS1, PCNA and N-cadherin protein levels were decreased but cleaved-caspase 3 and E-cadherin protein levels were enhanced by silence of MKLN1-AS (Figure 8d). In addition, IHC analysis showed that ki-67 and ETS1 protein expression levels were downregulated in sh-MKLN1-AS#1 group by comparison to sh-NC group (Figure 8e). MKLN1-AS contributed to tumorigenesis of HCC by targeting the miR-22-3p/ETS1 axis in mice.
Figure 8.
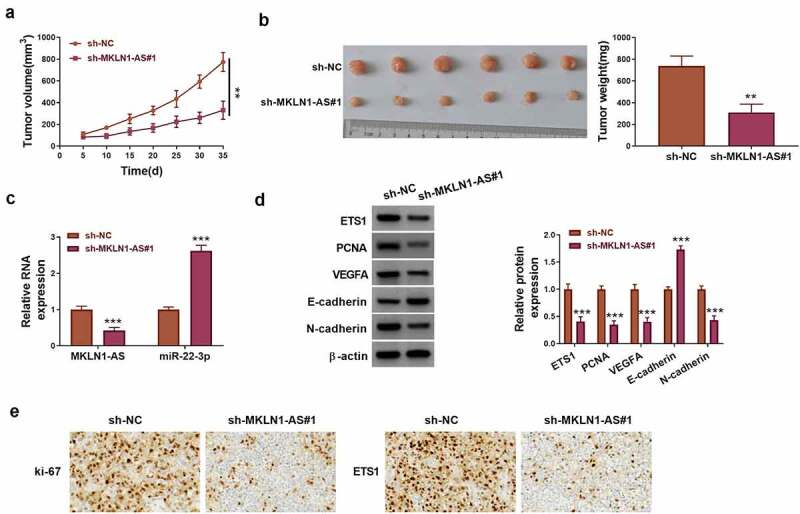
MKLN1-AS promoted tumor growth via mediating the miR-22-3p/ETS1 axis in HCC xenograft model. (a) Tumor volume was measured every 5 days in sh-MKNL1-AS#1 and sh-NC xenograft models. (b) Tumors were photographed and weighed after 35 days. (c) MKLN1-AS and miR-22-3p levels were quantified using RT-qPCR. (d) ETS1 and protein markers related to cell behaviors were detected using Western blot. (e) The protein detection for ki-67 and ETS1 was performed using IHC assay. **P < 0.01, ***P < 0.001.
Discussion
A large amount of lncRNAs have been involved in the biological processes of HCC. For instance, W42 upregulation enhanced cell invasion and suppressed cell apoptosis in HCC [23]. Small nucleolar RNA host gene 16 (SNHG16) promoted proliferation and sorafenib resistance in HCC cells [24]. Metallothionein 1 J, pseudogene (MT1JP) and Long intergenic non-protein coding RNA 1093 (LINC01093) functioned as tumor repressors in the development of HCC [25,26]. The online dataset indicated that MKLN1-AS was aberrantly upregulated in HCC samples. The previous studies also reported that MKLN1-AS contributed to tumor progression in HCC [5–7]. We have detected the expression of MKLN1-AS in our collected tissues and cultured cells, and the results suggested that MKLN1-AS level was significantly enhanced in HCC. In addition, MKLN1-AS might be used as prognostic marker for HCC patients. The cellular experiments in vitro demonstrated that silencing MKLN1-AS restrained proliferation, angiogenesis, migration, and invasion in HuH7 and LM3 cells. These findings validated that MKLN1-AS acted as an oncogenic regulator in HCC.
Transcription factors are pivotal players in the occurrence and progression of human cancers through various mechanisms, including chromosomal translocations, point mutations, and interaction with lncRNAs [27,28]. Herein, Jaspar software exhibited that there were four binding sites between ETS1 and MKLN1-AS. Then, our RIP and dual-luciferase reporter assays manifested that ETS1 combined with the site 4 (582–596) of MKLN1-AS. ETS1 could evoke the positive regulation of MKLN1-AS level in HCC cells.
LncRNAs can inhibit miRNAs binding to the downstream targets, therapy regulating in the regulation of functional genes in tumor regulation [29]. For example, Small Nucleolar RNA Host Gene 3 (SNHG3) enhanced tumorigenesis through upregulating the level of LIM homeobox transcription factor 1-beta (LMX1B) by sponging miR-485-5p in glioma [30] and ARAP1 antisense RNA 1 (ARAP1-AS1) accelerated the malignant development via targeting miR-4735-3p to elevate the pleomorphic adenoma gene like-2 (PLAGL2) expression in ovarian carcinoma [31]. In this study, MKLN1-AS could bind to miR-22-3p to act as a molecular sponge in HCC cells. Furthermore, all these regulatory effects of MKLN1-AS on HCC cellular behaviors were reverted by reducing the miR-22-3p level. Moreover, we affirmed that miR-22-3p directly targeted ETS1 and MKLN1-AS was involved in the expression regulation of ETS1 via sponging miR-22-3p. Yang et al. attested that miR-22-3p reduced cell survival in lung cancer by targeting mesenchymal-epithelial transition factor (MET) [32] and Lv et al. stated that miR-22-3p prevented cell apoptosis in cervical squamous carcinoma via targeting encoding human 4E-BP3 (eIF4EBP3) [33]. Our data showed that overexpression of ETS1 abated the miR-22-3p-mediated suppression of HCC cell development. Hence, miR-22-3p induced the anti-tumor response in HCC via the downregulation of ETS1.
In addition, MKLN1-AS knockdown repressed tumor growth and migration in mice through inducing miR-22-3p upregulation and ETS1 downregulation. MKLN1-AS facilitated tumorigenesis through modulating the miR-22-3p/ETS1 axis in vivo. ETS1 acted as a transcription factor to mediate the MKLN1-AS expression, then affecting the miR-22-3p/ETS1 axis to participate in HCC progression. The issued publications in ‘Bioengineered’ have indicated that lncRNA/miRNA/mRNA axis is implicated in the development of HCC [34,35]. However, no research of MKLN1-AS was reported in ‘Bioengineered’. Our study provided a novel signal network associated with MKLN1-AS in HCC.
Conclusion
In conclusion, ETS1-mediated MKLN1-AS could promote the development of HCC through absorbing miR-22-3p to evoke ETS1 upregulation (Graphical Abstract). This study elucidated a novel regulatory mechanism in HCC pathogenesis. MKLN1-AS has the potential to function as a molecular biomarker in HCC.
Supplementary Material
Funding Statement
The author(s) reported there is no funding associated with the work featured in this article.
Supplementary material
Supplemental data for this article can be accessed here.
Disclosure statement
No potential conflict of interest was reported by the author(s).
References
- [1].Pinto Marques H, Gomes Da Silva S, De Martin E, et al. Emerging biomarkers in HCC patients: current status. Int J Surg. 2020;82S:70–76. [DOI] [PubMed] [Google Scholar]
- [2].Guo M, Li N, Zheng J, et al. Epigenetic regulation of hepatocellular carcinoma progression through the mTOR signaling pathway. Can J Gastroenterol Hepatol. 2021;2021:5596712. [DOI] [PMC free article] [PubMed] [Google Scholar]
- [3].Couri T, Pillai A.. Goals and targets for personalized therapy for HCC. Hepatol Int. 2019;13(2):125–137. [DOI] [PubMed] [Google Scholar]
- [4].Unfried JP, Sangro P, Prats-Mari L, et al. The landscape of lncRNAs in hepatocellular carcinoma: a translational perspective. Cancers (Basel). 2021;13(11). DOI: 10.3390/cancers13112651. [DOI] [PMC free article] [PubMed] [Google Scholar]
- [5].Deng X, Bi Q, Chen S, et al. Identification of a five-autophagy-related-lncRNA signature as a novel prognostic biomarker for hepatocellular carcinoma. Front Mol Biosci. 2020;7:611626. [DOI] [PMC free article] [PubMed] [Google Scholar]
- [6].Zhao X, Bai Z, Li C, et al. Identification of a novel eight-lncRNA prognostic signature for HBV-HCC and analysis of their functions based on coexpression and ceRNA networks. Biomed Res Int. 2020;2020:8765461. [DOI] [PMC free article] [PubMed] [Google Scholar]
- [7].Guo C, Zhou S, Yi W, et al. Long non-coding RNA muskelin 1 antisense RNA (MKLN1-AS) is a potential diagnostic and prognostic biomarker and therapeutic target for hepatocellular carcinoma. Exp Mol Pathol. 2021;120:104638. [DOI] [PubMed] [Google Scholar]
- [8].Li D, Zhang J, Li J. Role of miRNA sponges in hepatocellular carcinoma. Clin Chim Acta. 2020;500:10–19. [DOI] [PubMed] [Google Scholar]
- [9].Dittmer J. The role of the transcription factor Ets1 in carcinoma. Semin Cancer Biol. 2015;35:20–38. [DOI] [PubMed] [Google Scholar]
- [10].Rodgers JJ, McClure R, Epis MR, et al. ETS1 induces transforming growth factor beta signaling and promotes epithelial-to-mesenchymal transition in prostate cancer cells. J Cell Biochem. 2019;120(1):848–860. [DOI] [PubMed] [Google Scholar]
- [11].Tomar S, Plotnik JP, Haley J, et al. ETS1 induction by the microenvironment promotes ovarian cancer metastasis through focal adhesion kinase. Cancer Lett. 2018;414:190–204. [DOI] [PubMed] [Google Scholar]
- [12].Kim GC, Kwon HK, Lee CG, et al. Upregulation of Ets1 expression by NFATc2 and NFKB1/RELA promotes breast cancer cell invasiveness. Oncogenesis. 2018;7(11):91. [DOI] [PMC free article] [PubMed] [Google Scholar]
- [13].Hua S, Lei L, Deng L, et al. miR-139-5p inhibits aerobic glycolysis, cell proliferation, migration, and invasion in hepatocellular carcinoma via a reciprocal regulatory interaction with ETS1. Oncogene. 2018;37(12):1624–1636. [DOI] [PubMed] [Google Scholar]
- [14].Ma N, Chen F, Shen SL, et al. MicroRNA-129-5p inhibits hepatocellular carcinoma cell metastasis and invasion via targeting ETS1. Biochem Biophys Res Commun. 2015;461(4):618–623. [DOI] [PubMed] [Google Scholar]
- [15].Shen X, Ding Y, Lu F, et al. Long noncoding RNA MIR4435-2HG promotes hepatocellular carcinoma proliferation and metastasis through the miR-22-3p/YWHAZ axis. Am J Transl Res. 2020;12(10):6381–6394. [PMC free article] [PubMed] [Google Scholar]
- [16].Chen F, Zhong Z, Tan HY, et al. Suppression of lncRNA MALAT1 by betulinic acid inhibits hepatocellular carcinoma progression by targeting IAPs via miR-22-3p. Clin Transl Med. 2020;10(6):e190. [DOI] [PMC free article] [PubMed] [Google Scholar]
- [17].Chen C, Huang Z, Mo X, et al. The circular RNA 001971/miR-29c-3p axis modulates colorectal cancer growth, metastasis, and angiogenesis through VEGFA. J Exp Clin Cancer Res. 2020;39(1):91. [DOI] [PMC free article] [PubMed] [Google Scholar] [Retracted]
- [18].Livak KJ, Schmittgen TD. Analysis of relative gene expression data using real-time quantitative PCR and the 2(-Delta Delta C(T)) Method. Methods. 2001;25(4):402–408. [DOI] [PubMed] [Google Scholar]
- [19].Liu Y, Yang C, Zhao Y, et al. Overexpressed methyltransferase-like 1 (METTL1) increased chemosensitivity of colon cancer cells to cisplatin by regulating miR-149-3p/S100A4/p53 axis.Aging (Albany NY). 2019;11(24):12328–12344. [DOI] [PMC free article] [PubMed] [Google Scholar]
- [20].Wu F, Wang F, Yang Q, et al. Upregulation of miRNA-23a-3p rescues high glucose-induced cell apoptosis and proliferation inhibition in cardiomyocytes. Vitro Cell Dev Biol Anim. 2020;56(10):866–877. [DOI] [PMC free article] [PubMed] [Google Scholar]
- [21].Zhang W, Mao S, Shi D, et al. MicroRNA-153 decreases tryptophan catabolism and inhibits angiogenesis in bladder cancer by targeting indoleamine 2,3-dioxygenase 1. Front Oncol. 2019;9:619. [DOI] [PMC free article] [PubMed] [Google Scholar]
- [22].Sun J, Xin K, Leng C, et al. Down-regulation of SNHG16 alleviates the acute lung injury in sepsis rats through miR-128-3p/HMGB3 axis. BMC Pulm Med. 2021;21(1):191. [DOI] [PMC free article] [PubMed] [Google Scholar]
- [23].Lei GL, Niu Y, Cheng SJ, et al. Upregulation of long noncoding RNA W42 promotes tumor development by binding with DBN1 in hepatocellular carcinoma. World J Gastroenterol. 2021;27(20):2586–2602. [DOI] [PMC free article] [PubMed] [Google Scholar]
- [24].Guo Z, Zhang J, Fan L, et al. Long noncoding RNA (lncRNA) small nucleolar RNA host gene 16 (SNHG16) predicts poor prognosis and sorafenib resistance in hepatocellular carcinoma. Med Sci Monit. 2019;25:2079–2086. [DOI] [PMC free article] [PubMed] [Google Scholar]
- [25].Mo W, Dai Y, Chen J, et al. Long noncoding RNA (lncRNA) MT1JP suppresses hepatocellular carcinoma (HCC) in vitro. Cancer Manag Res. 2020;12:7949–7960. [DOI] [PMC free article] [PubMed] [Google Scholar]
- [26].He J, Zuo Q, Hu B, et al. A novel, liver-specific long noncoding RNA LINC01093 suppresses HCC progression by interaction with IGF2BP1 to facilitate decay of GLI1 mRNA. Cancer Lett. 2019;450:98–109. [DOI] [PubMed] [Google Scholar]
- [27].Bushweller JH. Targeting transcription factors in cancer - from undruggable to reality. Nat Rev Cancer. 2019;19(11):611–624. [DOI] [PMC free article] [PubMed] [Google Scholar]
- [28].Jiang M, Cheng Y, Wang D, et al. Transcriptional network modulated by the prognostic signature transcription factors and their long noncoding RNA partners in primary prostate cancer. EBioMedicine. 2021;63:103150. [DOI] [PMC free article] [PubMed] [Google Scholar]
- [29].Thomson DW, Dinger ME. Endogenous microRNA sponges: evidence and controversy. Nat Rev Genet. 2016;17(5):272–283. [DOI] [PubMed] [Google Scholar]
- [30].Guo X, Zheng J, Yu MJ, et al. Long noncoding RNA SNHG3 promotes glioma tumorigenesis by sponging miR-485-5p to upregulate LMX1B expression. Kaohsiung J Med Sci. 2021. DOI: 10.1002/kjm2.12411. [DOI] [PubMed] [Google Scholar]
- [31].Li C, Dong B, Xu X, et al. LncRNA ARAP1-AS1 aggravates the malignant phenotypes of ovarian cancer cells through sponging miR-4735-3p to enhance PLAGL2 expression. Cytotechnology. 2021;73(3):363–372. [DOI] [PMC free article] [PubMed] [Google Scholar]
- [32].Yang X, Su W, Li Y, et al. MiR-22-3p suppresses cell growth via MET/STAT3 signaling in lung cancer. Am J Transl Res. 2021;13(3):1221–1232. [PMC free article] [PubMed] [Google Scholar]
- [33].Lv KT, Liu Z, Feng J, et al. MiR-22-3p regulates cell proliferation and inhibits cell apoptosis through targeting the eIF4EBP3 gene in human cervical squamous carcinoma cells. Int J Med Sci. 2018;15(2):142–152. [DOI] [PMC free article] [PubMed] [Google Scholar]
- [34].Song W, Wenhui Z, Ruiqiang Y, et al. Long noncoding RNA PP7080 promotes hepatocellular carcinoma development by sponging mir-601 and targeting SIRT1. Bioengineered. 2021;12(1):1599–1610. [DOI] [PMC free article] [PubMed] [Google Scholar]
- [35].Zheng S, Guo Y, Dai L, et al. Long intergenic noncoding RNA01134 accelerates hepatocellular carcinoma progression by sponging microRNA-4784 and downregulating structure specific recognition protein 1. Bioengineered. 2020;11(1):1016–1026. [DOI] [PMC free article] [PubMed] [Google Scholar]
Associated Data
This section collects any data citations, data availability statements, or supplementary materials included in this article.