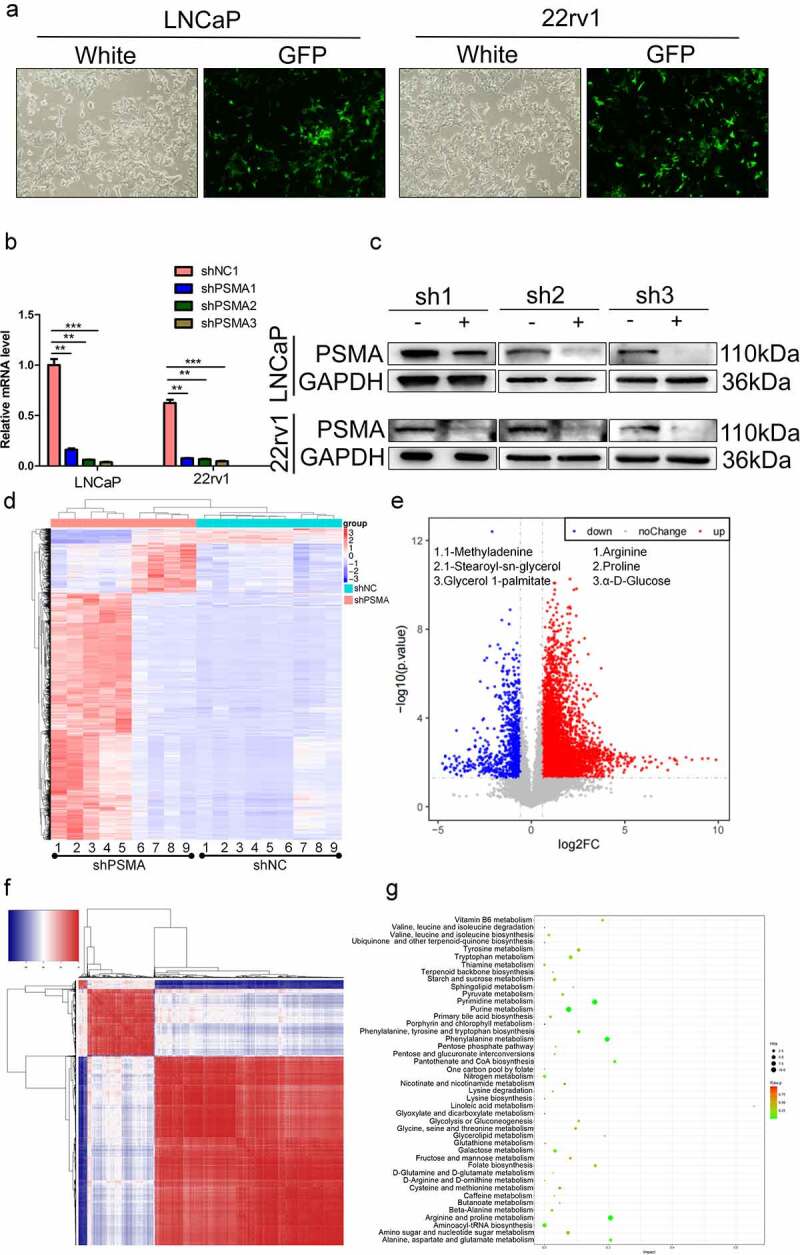
Figure 2.

PSMA knockdown affected PCa metabolism. A. The efficiency of virus infection was detected by green fluorescence. B. The efficiency of PSMA knockdown was assessed by RT-qPCR. C. The efficiency of PSMA knockdown was detected by Western blotting. D. Heatmap of differentially altered metabolites. E. Volcano map showing the altered metabolites after PSMA knockdown in LNCaP cells. F. Heatmap showing the correlation of differentially altered metabolites in LNCaP cells. Each row and column represented a metabolite. The red color indicates a positive correlation, the blue color indicates a negative correlation, and the color shade indicates the magnitude of the correlation. G. Bubble diagram of the enrichment of KEGG pathways related to the differentially altered metabolites in LNCaP cells. (*P < 0.05, **P < 0.01, ***P < 0.001).
