

Abstract
Background:
A low-cryogen, compact 3T (C3T) MRI scanner with high-performance gradients capable of simultaneously achieving 80 mT/m gradient amplitude and 700 T/m/s slew rate has been in use to study research patients since March 2016 but has not been implemented in the clinical practice.
Purpose:
To compare head MRI examinations obtained with the C3T system and a conventional whole-body 3T (WB3T) scanner in seven parameters across five commonly used brain imaging sequences.
Study type:
Prospective.
Subjects:
30 patients with a clinically indicated head MRI.
Sequence:
3T; T1 FLAIR, T1 MP-RAGE, 3D T2 FLAIR, T2 FSE, and DWI.
Assessment:
All patients tolerated the scans well. Three board-certified neuroradiologists scored the comparative quality of C3T and WB3T images in blinded fashion using a five-point Likert scale in terms of: signal-to-noise ratio (SNR), lesion conspicuity, motion artifact, gray/white matter contrast, cerebellar folia, susceptibility artifact, and overall quality.
Statistical test:
Left-sided, right-sided, and two-sided Wilcoxon signed rank test; Fisher’s method. A p value < 0.05 was considered statistically significant.
Results:
The C3T system performed better than the WB3T in virtually all comparisons, except for motion artifacts for the T1 FLAIR and T1 MP-RAGE sequences, where the WB3T system was deemed better. When combining all sequences together, the C3T system outperformed the WB3T system in all image quality parameters evaluated, except for motion artifact (p= 0.13).
Data Conclusion:
The C3T scanner provided better overall image quality for all sequences, and performed better in all individual categories, except for motion artifact on the T1 FLAIR and T1 MP-RAGE.
Keywords: MRI, Brain, 3 Tesla
Introduction
MRI at 3T was first approved by the U.S. Food and Drug Administration (FDA) in 2000 and has since become the accepted reference standard for neurologic imaging of the brain (1). However, despite improvements over the past two decades, adoption of 3T MRI systems can be limited by cost and installation constraints (2): a conventional whole-body 3T (WB3T) scanner typically weighs between 5,000 and 9,000 kg and uses 1,000 to 2,000 liters of liquid helium (requiring special cryogen venting) (3).
To address these limitations, a low cryogen, compact 3T (C3T) MRI scanner with high-performance gradients was developed and built specifically for imaging of the brain and extremities. The C3T scanner is not 510(k) cleared by the FDA, but has been in continuous service since March 2016, scanning research patients under Institutional Review Board (IRB) approved studies as a non-significant risk research device. Technical details of the scanner have been previously described (3–6). The C3T magnet is superconducting and constructed using standard NbTi wire. It is conduction cooled to a temperature of 4 K and the cryogenic system requires only 12 liters of liquid helium in a gas-charged sealed system. The low quantity of cryogen eliminates the need for external venting from the scan room in case of a magnet quench, which greatly simplifies siting. The magnet has excellent B0 field homogeneity over a 26-cm diameter spherical volume (7), to match the linear region of a head-sized gradient coil. It has a 42 cm inner-diameter gradient coil, which is reduced to 37 cm inner-diameter after installation of a transmit-receive birdcage coil. Compared to the typical WB3T gradient performance of 50 mT/m gradient amplitude and 200 T/m/s slew rate, the C3T achieves simultaneous 80 mT/m and 700 T/m/s, with a standard 1 megavolt-ampere (MVA) gradient driver per axis. Even with these high-performance gradient specifications, peripheral nerve stimulation (PNS) with the C3T has a higher threshold compared to whole-body gradient coils due to the smaller radius of the gradient coil (4). As such, PNS is rarely observed on the C3T, and can also be easily managed with simple sequence modifications if it does become manifest (8). The resulting 37 cm patient bore can accommodate a variety of existing head coils ranging from 8 to 32-channels, including compatibility with new adaptive image receive (AIR) coil arrays (9). The scanner weighs only 2,000 kg and can fit in a freight elevator for delivery/installation. Images of the C3T scanner and a diagram of its internal components are provided elsewhere (3).
In a preliminary work, we reported findings of superior image quality with the C3T system compared to a WB3T system when evaluating a sagittal T2 weighted 3D FLAIR sequence in 16 human volunteers (10), and also in 9 clinical patients undergoing a head MR examination (11). The aim of this study was to further evaluate and characterize the high-performance C3T MRI system against a conventional WB3T MRI scanner with an additional cohort of 21 clinical patients undergoing routine clinical imaging of the brain, specifically comparing image quality from these systems for five commonly used brain MRI pulse sequences (T1 FLAIR, T1 MP-RAGE, 3D T2 FLAIR, T2 FSE, and DWI).
Methods
Under an IRB-approved protocol, a total of 30 clinical patients (21 men and 9 women, median age at scanning 68.9 years, Q1: 60.9; Q3: 75.0) undergoing a clinically-indicated head MR examination provided written informed consent to be scanned both on a standard WB3T MR system (GE Discovery MR750, GE Healthcare, Waukesha, WI) and the C3T scanner, using identical 8-channel receiver head coils (In-vivo, Cleveland, Ohio) for both examinations to eliminate confounding effects of RF coil performance on the differences in gradient performance and scanner configuration. The scan order was randomized, with 50% of our patients undergoing C3T scanning before WB3T, and 50% in the opposite order. Patients were imaged consecutively with a median of 37-minute break (first quartile: 35 minutes; third quartile: 46 minutes) between imaging sessions on the two scanners.
Parameters used for the five evaluated pulse sequences are summarized in Table 1. The C3T used real-time gradient pre-emphasis (12) and frequency shifting to compensate additional concomitant fields. The 3D T2 FLAIR and T1 MP-RAGE sequences used a self-calibrating data-driven parallel imaging (ARC) (13) acceleration factor of R = 2. Diffusion weighted imaging consisted of a conventional EPI-based technique and did not utilize reduced field-of-view or segmented approach.
Table 1.
Pulse Sequence Parameters. Changes in parameters on the C3T scanner were the result of the difference in gradient performance, in which the echo spacing could be reduced because of the superior gradient performance.
| Sequence | T1 FLAIR | T1 MP-RAGE | 3D T2 FLAIR | T2 FSE fatsat | DWI | |||||
|---|---|---|---|---|---|---|---|---|---|---|
| Scanner | C3T | WB3T | C3T | WB3T | C3T | WB3T | C3T | WB3T | C3T | WB3T |
| Image matrix (freq × phase × partition) | 384×256 (5 mm) | 384×256 (5 mm) | 256×256×156 (1.2 mm) | 256×256×156 (1.2 mm) | 512×512×152 (1.2 mm) | 512×512×152 (1.2 mm) | 320×320 (4 mm) | 256×256 (4 mm) | 128×256 (4 mm) | 128×256 (4 mm) |
| TR | 2950 ms | 2950 ms | 6.07 ms | 7.33 ms | 7600 ms | 7600 ms | 4782 ms | 5160 ms | 10,000 ms | 10,000 ms |
| TE | 9.064 ms | 10.86 ms | 2.5 ms | 3.01 ms | 91.3 ms | 93.2 ms | 100.6 ms | 96 ms | 44.4 ms | 60.4 ms |
| TI | 890 ms | 890 ms | 900 ms | 900 ms | 2060 ms | 2025 ms | - | - | - | - |
| Flip angle | 111 | 111 | 8 | 8 | 90 | 90 | 111 | 111 | 90 | 90 |
| NEX | 1 | 1 | 1 | 1 | 1 | 1 | 2 | 2 | 1 | 1 |
| ETL echo train | 5 | 5 | 1 | 1 | 200 | 200 | 12 | 12 | 1 | 1 |
| FOV | 240 mm | 240 mm | 24×24×18.7 cm | 24×24×18.7 cm | 24×24×18.2 cm | 24×24×18.2 cm | 22×22 cm | 22×22 cm | 22×22 cm | 22×22 cm |
| Bandwidth | 122.07 Hz/px | 122.07 Hz/px | - | - | - | - | - | - | - | - |
| Acquisition time | 2:42 | 2:42 | 5:12 | 5:14 | 6:46 | 6:46 | 2:33 | 2:32 | 1:02 | 1:02 |
The imaging studies were independently reviewed in blinded fashion by three board-certified neuroradiologists (NGC, PMC, and JH) with, respectively, 22, 3, and 32 years of clinical experience. A fourth physician (EC) loaded completely de-annotated C3T and WB3T images in a paired fashion on a clinical PACS workstation (Visage Client 7.1.15, Build 3108, Visage Imaging), and these were graded independently by the neuroradiologists using a five-point Likert scale, with grading steps including strong preference for images on the left, preference for image on the left, no preference, preference for the image on the right, and strong preference for the image on the right. After scoring was completed, this grading scheme was later converted on a one-to-one basis to an alternative numerical Likert scale from 1 to 5 for statistical analysis, with 1 indicating strong preference for the WB3T system, 2 indicating preference for the WB3T system, 3 representing no system preference, 4 indicating preference for the C3T system, and 5 indicating strong preference for the C3T system. Patient order was randomized. For each patient, images from each sequence were presented with C3T and WB3T randomly oriented in right-left position on the viewing station; scores were reported independently without consensus or discussion of imaging differences. For each specific sequence for each patient, the following independent attributes were evaluated: signal-to-noise ratio (SNR), lesion conspicuity, motion artifact, gray/white matter contrast, susceptibility artifacts, cerebellar folia conspicuity, and overall exam quality.
Statistical Analysis
Statistical analysis was performed using both a one-sided and two-sided Wilcoxon signed rank tests. The null hypothesis of the left-sided test was that the C3T performed equally to or better than the standard WB3T MR system; the right-sided test used the reverse of this hypothesis; whereas the two-sided null hypothesis was that the two systems performed equally.
We also combined all p-values for each parameter assessed across all sequences using Fisher’s method followed by Bonferroni’s correction. A p value <0.05 was considered statistically significant.
Inter-readers agreement was established by first calculating the agreement for each combination of sequence and parameter for each patient between couples of readers (JH-NGC, JH-PMC, and NGC-PMC). In each comparison, we assigned a binary value of 1 or 0, with 1 indicating that readers assigned the same value on the Likert scale, and 0 indicating that scores were different. In this way, we generated 3 binary values for each combination of sequence/parameter for each patient. These 3 values were subsequently averaged to provide us 1,043 agreements, representing each one of them the inter-reader agreement for each patient for all combinations of sequences and parameters.
To better illustrate our methodology, we report one example, chosen arbitrarily. In terms of overall quality in T2 FSE in the patient 1, the three readers assigned the values [4;3;3]. The pairwise comparisons gave us the following binary values [0;0;1]. Hence, the final agreement for this combination of sequence/parameter in the patient 1 was 0.33.
Overall inter-reader agreement was then calculated by averaging all the 1,043 scores, whereas sequence and/or parameter-specific agreement was calculated in the same way, restricting for the sequence/parameter of interest.
Results
The patients tolerated imaging well on both the C3T and WB3T scanners. There were no reports of imaging related PNS on either scanner, consistent with previously reported results (4, 8).
Overall, we report an inter-reader agreement of 80%; detailed agreements broken down by sequence and parameters are reported in Table 2. Sequence and parameter-specific agreement ranged from 40% (SNR in T2 FSE) to 96% (both overall quality in DWI and susceptibility artifact in T1 MP-RAGE). Importantly, among the lowest agreements, both lesion conspicuity in DWI (agreement of 56%) and susceptibility artifact in T2 FSE (agreement of 60%) had all their discrepancies between readers within 1 point in the 5-point Likert scale. Whereas in terms of SNR in T2 FSE (the lowest agreement, 40%), differences among readers ranged between 1 and 2 point in the ordinal Likert scale, when evaluating the same image.
Table 2.
Inter-reader agreement, broken down by sequences and parameters.
| Sequence | |||||||
|---|---|---|---|---|---|---|---|
| T1 FLAIR | T1 MP-RAGE | 3D T2 FLAIR | T2 FSE | DWI | Total | ||
| Parameters | SNR | 77% | 87% | 96% | 40% | 93% | 79% |
| Lesion conspicuity | 87% | 74% | 77% | 93% | 56% | 77% | |
| Motion artifact | 76% | 81% | 87% | 80% | 93% | 83% | |
| G/w matter contrast | 69% | 74% | 87% | 69% | 98% | 79% | |
| Cerebellar folia | 72% | 68% | 66% | 90% | 71% | 73% | |
| Susceptibility artifact | 89% | 96% | 84% | 60% | 81% | 82% | |
| Overall quality | 90% | 74% | 86% | 92% | 96% | 87% | |
| Total | 80% | 79% | 83% | 75% | 84% | 80% | |
Table 3 shows tabulated results for left-tail, two-sided, and right-tail Wilcoxon-signed rank statistics for all evaluated parameters across the five imaging sequences in the whole cohort. The numerous right-sided significant p-values and the absence of left-sided significant p-values indicate that the C3T scan performed better than the WB3T system for most image quality parameters in the 3D T2 FLAIR, T2 FSE, and DWI sequences. With T1 FLAIR and T1 MP-RAGE, C3T outperformed WB3T in most of the parameters assessed, except for motion artifacts, where it was deemed inferior.
Table 3.
Summary of two-sided as well as left- and right-tailed Wilcoxon Signed-Rank statistics for all evaluated parameters across all imaging sequences.
| Sequence | Parameter | Left-tail | Two-sided | Right-tail |
|---|---|---|---|---|
| T1 FLAIR | SNR | p= 1.000 | p= 0.004* | p= 0.002* |
| Lesion Conspicuity | p= 1.000 | p< 0.001* | p< 0.001* | |
| Motion Artifact | p= 0.009* | p= 0.017* | p= 0.99 | |
| Gray/White Contrast | p= 1.000 | p< 0.001* | p< 0.001* | |
| Cerebellar Folia | p= 0.96 | p= 0.09 | p= 0.04* | |
| Susceptibility Artifact | p= 0.99 | p= 0.053 | p= 0.03* | |
| Overall Quality | p= 1.000 | p< 0.001* | p< 0.001* | |
| T1 MP-RAGE | SNR | p= 0.92 | p= 0.16 | p= 0.08 |
| Lesion Conspicuity | p= 1.000 | p< 0.001* | p< 0.001* | |
| Motion Artifact | p= 0.02* | p= 0.04* | p= 0.99 | |
| Gray/White Contrast | p= 1.000 | p< 0.001* | p< 0.001* | |
| Cerebellar Folia | p= 1.000 | p< 0.001* | p< 0.001* | |
| Susceptibility Artifact | p= 0.97 | p= 0.17 | p= 0.09 | |
| Overall Quality | p= 1.000 | p< 0.001* | p< 0.001* | |
| 3D T2 FLAIR | SNR | p= 1.000 | p< 0.001* | p< 0.001* |
| Lesion Conspicuity | p= 1.000 | p< 0.001* | p< 0.001* | |
| Motion Artifact | p= 0.83 | p= 0.44 | p= 0.22 | |
| Gray/White Contrast | p= 1.000 | p< 0.001* | p< 0.001* | |
| Cerebellar Folia | p= 1.000 | p= 0.004* | p= 0.002* | |
| Susceptibility Artifact | p= 1.000 | p= 0.015* | p= 0.007* | |
| Overall Quality | p= 1.000 | p< 0.001* | p< 0.001* | |
| T2 FSE Fat Sat | SNR | p= 1.000 | p< 0.001* | p< 0.001* |
| Lesion Conspicuity | p= 1.000 | p< 0.001* | p< 0.001* | |
| Motion Artifact | p= 1.000 | p= 0.007* | p= 0.004* | |
| Gray/White Contrast | p= 0.85 | p< 0.001* | p< 0.001* | |
| Cerebellar Folia | p= 1.000 | p< 0.001* | p< 0.001* | |
| Susceptibility Artifact | p= 1.000 | p< 0.001* | p< 0.001* | |
| Overall Quality | p= 1.000 | p< 0.001* | p< 0.001* | |
| DWI | SNR | p= 1.000 | p< 0.001* | p< 0.001* |
| Lesion Conspicuity | p= 1.000 | p< 0.001* | p< 0.001* | |
| Motion Artifact | p= 0.61 | p= 1.000 | p= 0.61 | |
| Gray/White Contrast | p= 1.000 | p< 0.001* | p< 0.001* | |
| Cerebellar Folia | p= 1.000 | p< 0.001* | p< 0.001* | |
| Susceptibility Artifact | p= 1.000 | p< 0.001* | p< 0.001* | |
| Overall Quality | p= 1.000 | p< 0.001* | p< 0.001* |
Statistically significant (p < 0.05).
Among our 30 patients, 14/30 (47%) had at least two reviewers considering the WB3T better than C3T in terms of motion artifacts in T1 FLAIR and/or T1 MP-RAGE. Among these, there was no difference in terms of which scan was performed first (50% WB3T first and 50% C3T first), but they had a higher BMI, in the obesity range (BMI = 32.1; Q1: 24.6; Q3: 35.2), compared to those who did not have a reported WB3T preference (BMI = 27.4; Q1: 24.6; Q3: 30.7). This difference was not significant (Right-sided Wilcoxon rank sum test, p= 0.06).
In terms of overall quality, the C3T scan significantly outperformed the WB3T system in all the sequences. In only 25 out of 210 evaluations, and 9 out of 30 patients, was overall quality deemed better on WB3T system, and this was primarily in cases where motion artifact compromised C3T images, or patient was placed low in the coil.
Table 4 reports combined p-values for each parameter across all the sequences. No left-sided significant p-values were observed; whereas most of the parameters showed a right-sided significance, indicating that C3T scanner was never inferior to the WB3T system and outperformed it in 6 out of the 7 parameters assessed. Null hypothesis of difference in motion artifact (p= 0.13) was not rejected.
Table 4.
Combined p-values for each parameter assessed across all sequences.
| Parameter | Left-tail | Two-sided | Right-tail |
|---|---|---|---|
| SNR | p= 1.000 | p< 0.001* | p< 0.001* |
| Lesion Conspicuity | p= 1.000 | p< 0.001* | p< 0.001* |
| Motion Artifact | p= 0.17 | p= 0.004* | p= 0.13 |
| Gray/White Contrast | p= 1.000 | p< 0.001* | p< 0.001* |
| Cerebellar Folia | p= 1.000 | p< 0.001* | p< 0.001* |
| Susceptibility Artifact | p= 1.000 | p< 0.001* | p< 0.001* |
| Overall Quality | p= 1.000 | p< 0.001* | p< 0.001* |
Statistically significant (p< 0.01). The level of significance was adjusted according to Bonferroni correction.
Figures 1–5 illustrate examples of imaging comparisons between the two systems for each of the evaluated pulse sequences. Note the hyperintense arterial signal on the MP-RAGE images due to the shorter RF transmit coil resulting in reduced saturation of inflowing blood signal.
Figure 1:
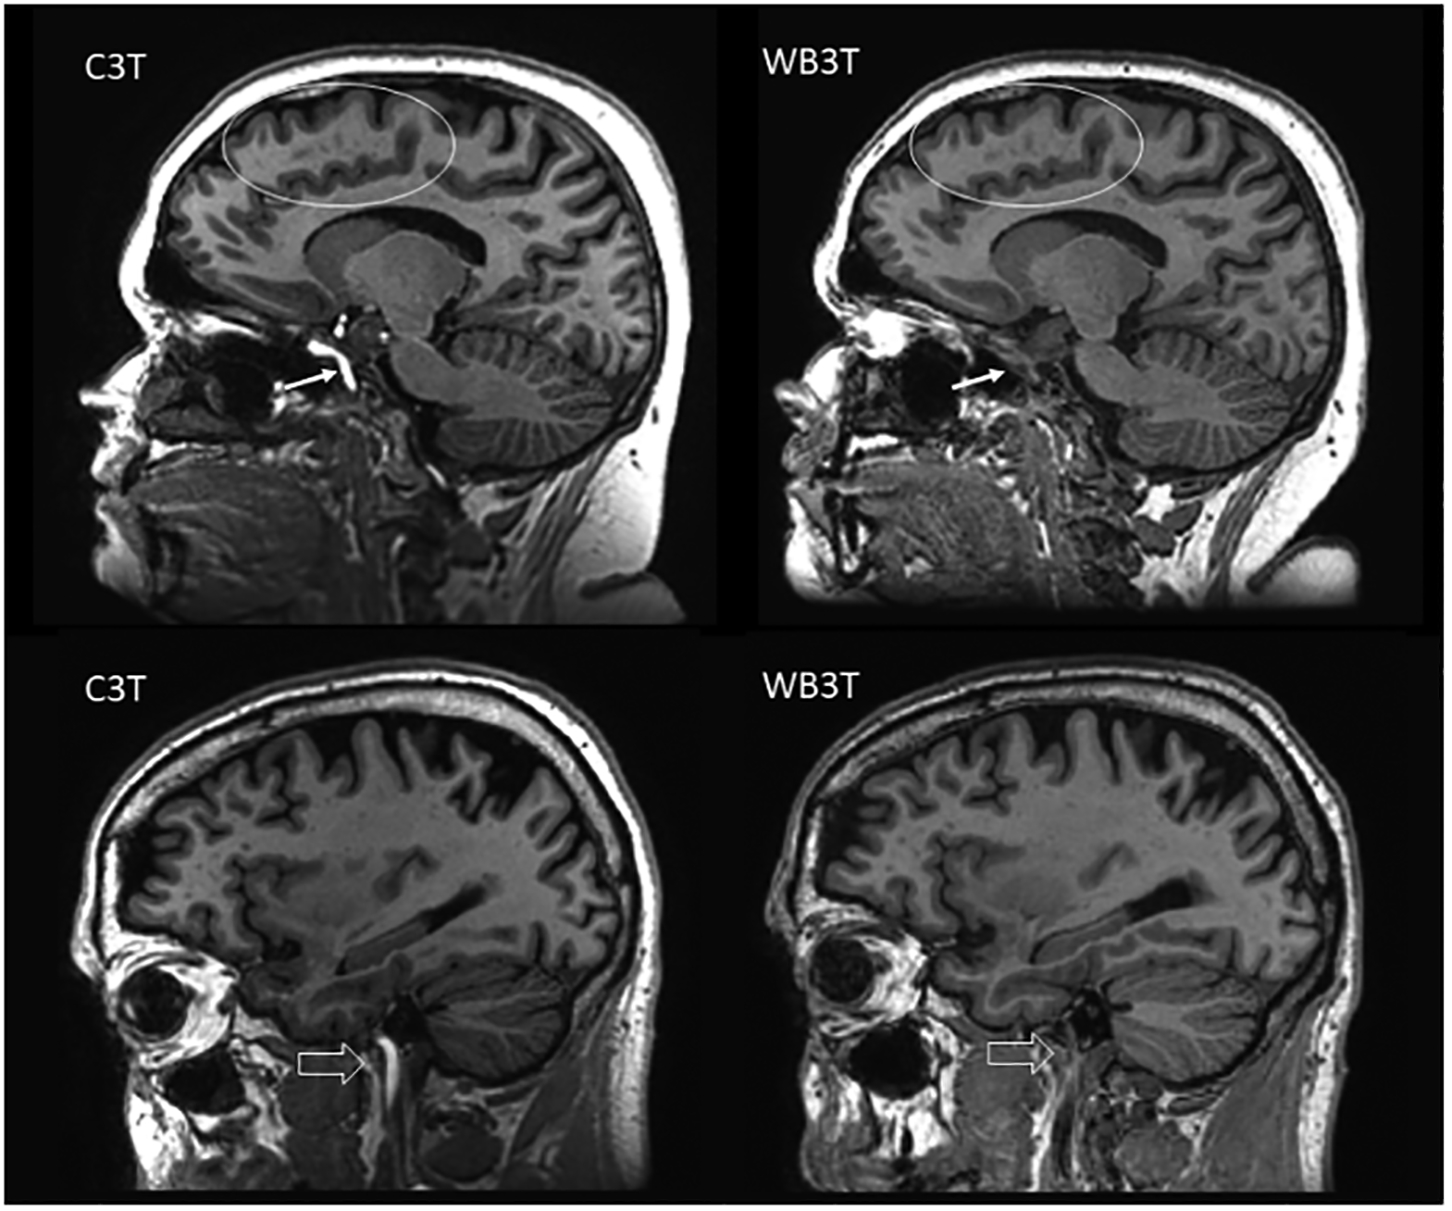
Sagittal T1 MP-RAGE image comparison. The C3T system demonstrates better SNR, lesion conspicuity (ovals), gray/white matter contrast, and overall quality. The C3T images also demonstrate bright intra-arterial signal (arrow, block arrow), primarily a result of the smaller dimensions of the C3T’s RF field which is essentially limited to superior of the clavicle and does not result in as much saturation of incoming oxygenated blood at the level of the neck and skull base as on the WB3T.
Figure 1–5. Comparison images between the C3T and WB3T scanner in a patient with chronic small vessel ischemic changes.
Figure 5:

Sagittal T1 FLAIR image comparison for C3T and WB3T. The C3T images have slightly better SNR than the corresponding WB3T images. Gray-white matter contrast and lesion conspicuity was deemed similar in these examples, and again supports non-inferiority of the C3T images compared to WB3T.
Discussion
The results of this study show that the C3T scanner provided equal or better image quality than a WB3T scanner for commonly performed brain pulse sequences evaluated across a 30-patient study cohort. C3T outperformed WB3T in all the evaluated sequences (T1 FLAIR, T1 MP-RAGE, 3D T2 FLAIR, T2 FSE, and DWI), but showed inferiority in terms of motion artifacts in T1 FLAIR and T1 MP-RAGE. We speculate that the superiority of WB3T in these sequences should not be attributed to subjects being scanned first with WB3T and then C3T and being tired of lying still in the same position for a prolonged time. This is because among the patients whose motion artifacts were graded better in WB3T, 50% performed WB3T before C3T and 50% vice versa. A possible explanation may lie in the diverse BMIs of the subjects, as evidenced by the fact that BMI was higher in those who were graded better in WB3T, even though it was not significant (p= 0.06). On the other hand, this does not explain why we did not prove consistency of motion artifacts performance among all sequences: the two systems were equal in 3D T2 FLAIR and DWI, and C3T outperformed WB3T in T2 FSE.
Inter-reader agreement showed major differences when breaking down by sequence/parameter. In T2 FSE, in terms of SNR, not only the agreement was the lowest reported (40%), but the scores reported by the readers were often a combination of [2;3;4] and [2;4;4], indicating that the readers were in disagreement as to which scanner was outperforming the other. This pattern was not consistent in other situations with low agreement (e.g. susceptibility artifact in T2 FSE and lesion conspicuity in DWI), where disagreements were always within 1 point in the Likert scale. The SNR in T2 FSE may have been influenced by differences in resolution, with C3T obtained at 320×320 and 256×256 (Table 1), whereas in all the other sequences, resolution was the same in both systems. This could also be the reason why lesion conspicuity in T2 FSE had one of the highest agreements reported (93%).
The high slew-rate gradient system on the C3T scanner allows for an echo spacing reduction of 25% or more (14) compared to the WB3T system for FSE, and up to 40–50% reduction with EPI. Over a long echo train length, as used in 3D FSE, this reduction yields an overall readout duration change from 960 ms to 747 ms, allowing for the acquisition of higher spatial frequencies with reduced T2 signal decay. This effectively results in greater SNR, less image blur and sharper effective resolution on the C3T compared to the WB3T, even for acquisitions with identical image acquisition matrix size.
The reduction in echo spacing tends to sharpen the images. Both the C3T and the WB3T use the same, standard reconstruction algorithm and filters (i.e., windows), in particular a radial Fermi (also known as an elliptical) filter. However, another difference that can affect image appearance is the differing orders (i.e., degrees) of gradient non-linearity correction. In the case of the whole-body system for a head-sized object, only third and fifth order terms have a strong effect, whereas the reconstruction on the compact 3T requires contributions all orders from 2–10 (15).
A notable difference in acquisition parameters between the two systems resulting from high gradient slew-rate was the echo time (TE) for the DWI pulse sequence, which was 44.4 ms on the C3T versus 60.4 ms on the WB3T. This is a direct result of the high-performance gradients on the C3T scanner which can produce the necessary gradients for a b=1,000 s/mm2 diffusion weighting and subsequent echo planar readout much more rapidly than possible on the WB3T scanner. The shorter TE for DWI is desired (16) and results in a substantial increase in SNR on the C3T DWI images and inherently reduced noise on subsequently derived apparent diffusion coefficient maps. Additional noticeable advantages for C3T DWI include reduction in the amount of susceptibility change (e.g. decreased conspicuity of normal iron containing brain structures such as the globus pallidus and red nucleus) and increased image sharpness. These findings are consistent with previously reported results (14).
The TE time for T1 MP-RAGE imaging is typically selected as the shortest possible and, as shown in Table 1, was shorter with the C3T scanner (2.5 ms) compared to the WB3T scanner (3.0 ms). Differences in the selected TE can give rise to differences in the appearance of water, fat, and the interfaces between them. Since water and fat have a relative chemical shift of 3.4 ppm, at 3.0 T they will be in-phase approximately every 2.3 ms. A TE difference of 0.50 ms corresponds to an approximately 80° phase shift difference between water and fat on the C3T versus WB3T, with water and fat being much closer to a desirable in-phase location. This also results in an effective SNR increase with the C3T T1 MP-RAGE because of reduced T2* signal decay.
Limitations
Our study has a limitation that should be addressed. Due to the fact that the C3T is a relatively new device, there are currently no studies concerning its ability to have a higher sensitivity and/or specificity regarding neurological conditions. Indeed, this study only investigated its general performance compared to a standard whole-body system.
Conclusion
Compared to a WB3T scanner, the C3T MRI scanner with high-performance gradients provided improved image quality for all the commonly used clinical brain MR imaging sequences used in this study (T1 FLAIR, T1 MP-RAGE, 3D T2 FLAIR, T2 FSE, and DWI), but was inferior in terms of motion artifacts in T1 FLAIR and T1 MP-RAGE. When combining all sequences together, the C3T showed superiority in most of the parameters, but no clear preference for either systems was observed in terms of motion artifact. The results of this study, combined with the ease of siting the C3T scanner and the associated cost reduction, may facilitate greater utilization of neurologic imaging at 3T magnetic field strength if this technology becomes adopted for dedicated head-only MRI scanners.
Figure 2:

Sagittal 3D T2 FLAIR image comparison between the C3T and WB3T scanner in a patient with chronic small vessel ischemic changes (arrows). The C3T system demonstrates better SNR, lesion conspicuity, and overall quality.
Figure 3:

Axial 3D FSE T2 image comparison between C3T and WB3T. Benefits of the high gradient slew-rate available with the C3T system over the conventional WB3T system include the ability to acquire images with reduced echo spacing resulting in improved SNR and increased image resolution on the C3T scanner. This allows acquisition of higher resolution images with less T2 signal decay from later echoes, with similar acquisition time.
Figure 4:

Diffusion weighted imaging comparison between C3T and WB3T. The C3T images depict increased SNR, increased sharpness, and decreased susceptibility effects. The gray-white differentiation of the paramedian occipital lobes is superior on the C3T images (block arrow), and the optic radiation is more sharply delineated with C3T (white arrows). There are fewer susceptibility effects and geometric distortion with C3T (*). The decreased susceptibility also results in less dark signal “blooming” of the globus pallidum (black arrow).
Grant support:
This work was supported in part by NIH grant U01 EB024450-01.
References
- 1.Alvarez-Linera J 3T MRI: advances in brain imaging. Eur J Radiol. 2008;67(3):415–26. [DOI] [PubMed] [Google Scholar]
- 2.Marques JP, Simonis FFJ, Webb AG. Low-field MRI: An MR physics perspective. J Magn Reson Imaging. 2019;49(6):1528–42. [DOI] [PMC free article] [PubMed] [Google Scholar]
- 3.Foo TKF, Laskaris E, Vermilyea M, Xu M, Thompson P, Conte G, et al. Lightweight, compact, and high-performance 3T MR system for imaging the brain and extremities. Magn Reson Med. 2018;80(5):2232–45. [DOI] [PMC free article] [PubMed] [Google Scholar]
- 4.Lee SK, Mathieu JB, Graziani D, Piel J, Budesheim E, Fiveland E, et al. Peripheral nerve stimulation characteristics of an asymmetric head-only gradient coil compatible with a high-channel-count receiver array. Magn Reson Med. 2016;76(6):1939–50. [DOI] [PMC free article] [PubMed] [Google Scholar]
- 5.Mathieu JB, Lee SK, Graziani D, Lin J, Budesheim E, Piel J. Development of a dedicated asymmetric head-only gradient coil for high-performence brain imaging with a high PNS threshold [Poster presentation]. ISMRM Annual Meeting; Toronto: 2015, May 30-June 05. [Google Scholar]
- 6.Weavers PT, Shu Y, Tao S, Huston J 3rd, Lee SK, Graziani D, et al. Technical Note: Compact three-tesla magnetic resonance imager with high-performance gradients passes ACR image quality and acoustic noise tests. Med Phys. 2016;43(3):1259–64. [DOI] [PMC free article] [PubMed] [Google Scholar]
- 7.Shu Y, Tao S, Xu M, Laskaris E, Foo TK, Weavers PT, et al. Evaluation of the B0 field unifromity on a compact 3T scanner with high performance gradients. American Association of Physicists in Medicine; Denver (CO), USA: 2017, July 30 - August 3. [Google Scholar]
- 8.In MH, Shu Y, Trzasko JD, Yarach U, Kang D, Gray EM, et al. Reducing PNS with minimal performance penalties via simple pulse sequence modifications on a high-performance compact 3T scanner. Phys Med Biol. 2020;65(15):15NT02. [DOI] [PMC free article] [PubMed] [Google Scholar]
- 9.Cogswell PM, Trzasko JD, Gray EM, Campeau NG, Rossman PJ, Kang D, et al. Application of Adaptive Image Receive Coil Technology for Whole-Brain Imaging. AJR Am J Roentgenol. 2021;216(2):552–9. [DOI] [PMC free article] [PubMed] [Google Scholar]
- 10.Weavers PT, Campeau NG, Shu Y, Tao S, Trzasko J, Gray E, et al. Improved T2-weighted 3D FLAIR from a compact, lightweight 3T scanner with high performance gradients [Poster presentation]. ISMRM Annual Meeting; Honolulu, Hawaii: 2017, April 22–27. [Google Scholar]
- 11.Campeau NG, Shu Y, Trzasko J, Gray E, Foo TK, Bernstein MA, et al. Improved brain MR imaging from a compact, lightweight 3T scanner with high performance gradient [Poster presentation]. ISMRM; 2018; Paris, France: 2018, June 16–21. [DOI] [PMC free article] [PubMed] [Google Scholar]
- 12.Tao S, Weavers PT, Trzasko JD, Shu Y, Huston J 3rd, Lee SK, et al. Gradient pre-emphasis to counteract first-order concomitant fields on asymmetric MRI gradient systems. Magn Reson Med. 2017;77(6):2250–62. [DOI] [PMC free article] [PubMed] [Google Scholar]
- 13.Brau AC, Beatty PJ, Skare S, Bammer R. Comparison of reconstruction accuracy and efficiency among autocalibrating data-driven parallel imaging methods. Magn Reson Med. 2008;59(2):382–95. [DOI] [PMC free article] [PubMed] [Google Scholar]
- 14.Tan ET, Lee SK, Weavers PT, Graziani D, Piel JE, Shu Y, et al. High slew-rate head-only gradient for improving distortion in echo planar imaging: Preliminary experience. J Magn Reson Imaging. 2016;44(3):653–64. [DOI] [PMC free article] [PubMed] [Google Scholar]
- 15.Tao S, Trzasko JD, Gunter JL, Weavers PT, Shu Y, Huston J, et al. Gradient nonlinearity calibration and correction for a compact, asymmetric magnetic resonance imaging gradient system. Phys Med Biol. 2017;62(2):N18–N31. [DOI] [PMC free article] [PubMed] [Google Scholar]
- 16.Celik A Effect of imaging parameters on the accuracy of apparent diffusion coefficient and optimization strategies. Diagn Interv Radiol. 2016;22(1):101–7. [DOI] [PMC free article] [PubMed] [Google Scholar]