
Figure 4.
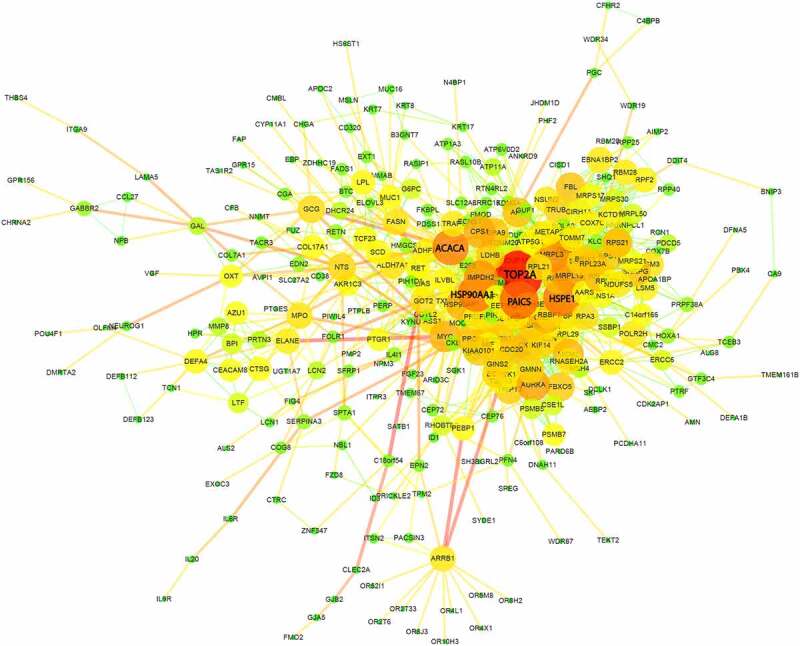
Protein-protein interaction (PPI) network analysis of DEGs between sepsis-induced ARDS and control samples. Each node represents a gene each edge represents an interaction pair. The size and color of each node shows the importance of the gene in the network