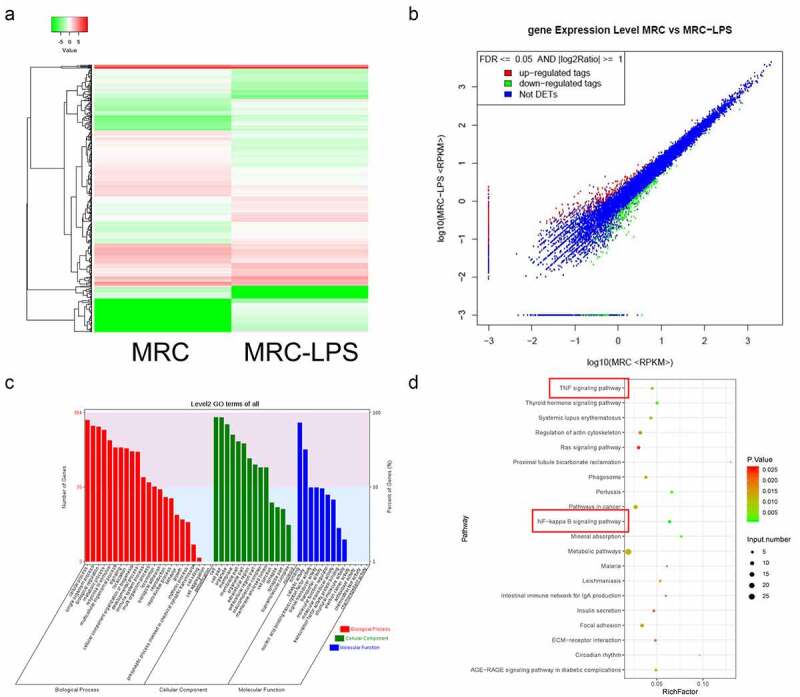
Figure 5.

The expression profile and function annotation of distinct mRNAs in LPS-induced and non-induced MRC-5 cells. (a) Based on sequencing results, hierarchical clustering analysis showed the differential mRNAs between MRC-5-NC and MRC-5-LPS groups. (b) Scatterplots of the differential mRNAs in LPS-induced and non-induced MRC-5 cells. Red, green, and blue dots indicate the upregulated, downregulated, and unchanged mRNA, respectively. (c) The GO analysis of the differential mRNAs. (d) Top 20 KEGG pathways were enriched by the differential mRNAs
