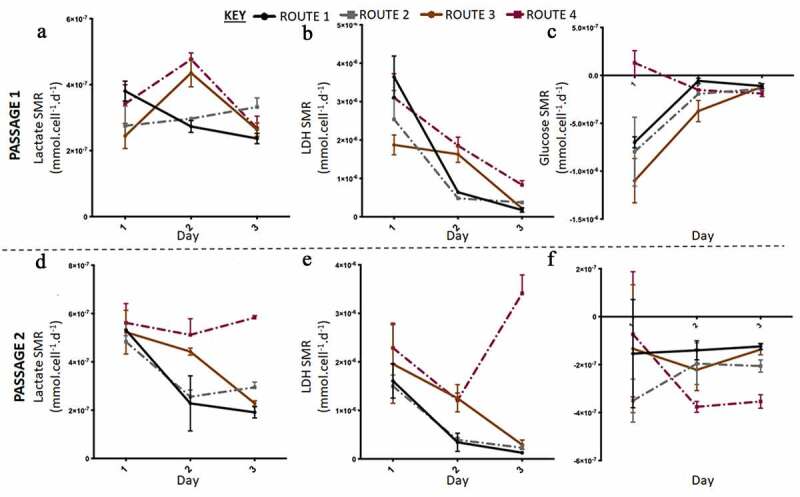
Figure 5.

Lactate and lactate dehydrogenase (LDH) specific metabolic rate (SMR) data with higher resolution metabolite sampling was carried out in the second run in Experiment B: the effect of feeding regimes. Lactate SMR increased from passage 1 (a) to passage 2 (c), at passage 2 lactate SMR decreased for all routes except route 3. LDH SMR was highest for route 3 at passage 1 (b) and passage 2 (e), generally LDH SMR decreased for all routes except route 3 at passage 2. Glucose SMR of consumption was highest at day one passage 1 for all conditions, except route 3, passage 1 (C) and passage 2 (f). Error bars indicate standard deviation, n = 3.
