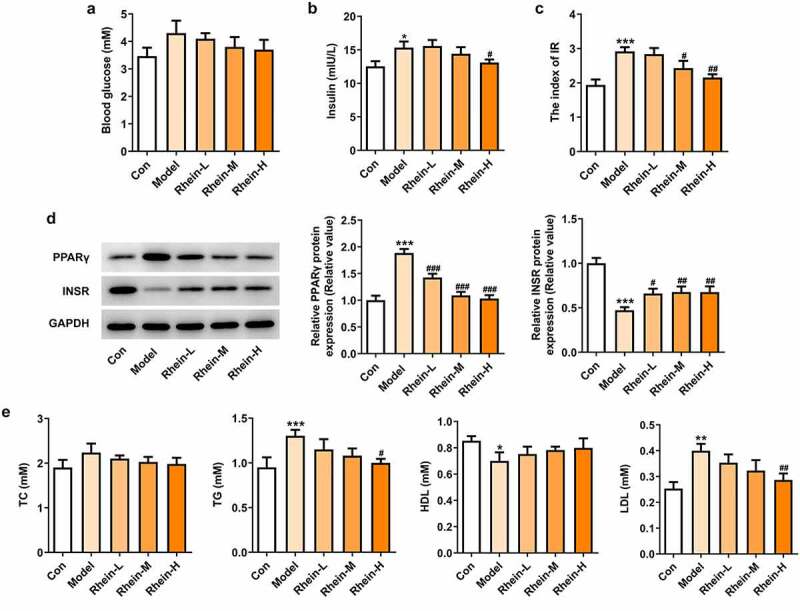
Figure 2.

Effects of rhein on IR and blood lipid levels. The rats of different groups were fed by the following administration, respectively, for six weeks, respectively: normal chow, high-fat diet (HFD) (D12492, 60% kcal%, Research Diets, USA), high-fat diet +Rhein-L (lose dose), high-fat diet (60% kcal%) + Rhein-M (medium dose), high-fat diet (60% kcal%) +Rhein-H (high dose). (a) The blood glucose. (b) Insulin levels. (c) Insulin resistance levels. (d) Western blotting analysis of PPARγ and INSR. n = 6 rats/group. HFD, high-fat diet-fed rats. (e) The blood lipid levels. *p < 0.05, **p < 0.01, ***p < 0.001 versus control. #p < 0.05, ##p < 0.01, ###p < 0.001 versus HFD
