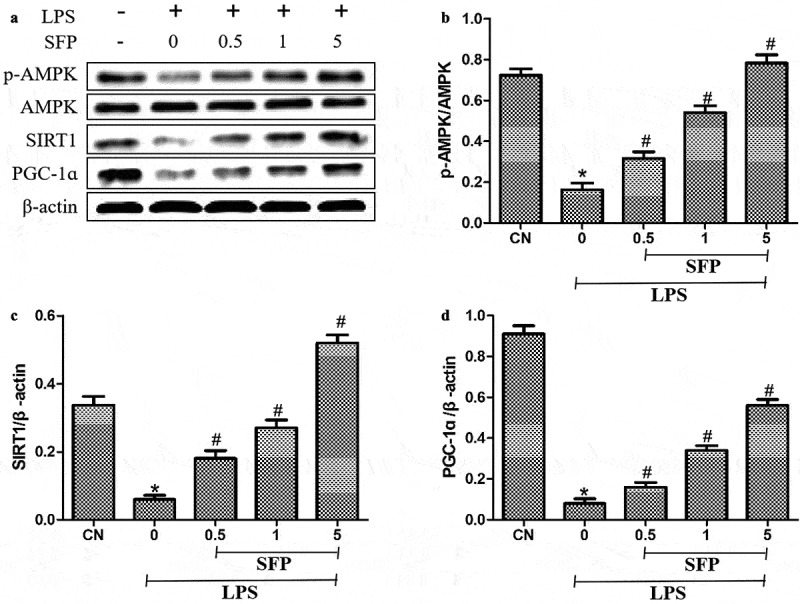
Figure 6.

Effects of sulforaphane (SFP) on levels of p-AMPK, SIRT1, and PGC-1ɑ in LPS-treated Caco-2 cells. Cells were exposed for 24 h to LPS (1 μg/mL) and different concentrations of sulforaphane (0.5–5 μM). (a) Representative Western blot. (b-d) Quantitation of Western blots against p-AMPK, SIRT1 and PGC-1ɑ. Values are mean ± SD (n = 3). Difference between two groups was performed by an independent-samples t-test, *P < 0.05 vs. control group (CN); #P < 0.05 vs. LPS group. The difference between different concentrations of sulforaphane was performed using one-way analysis of variance
