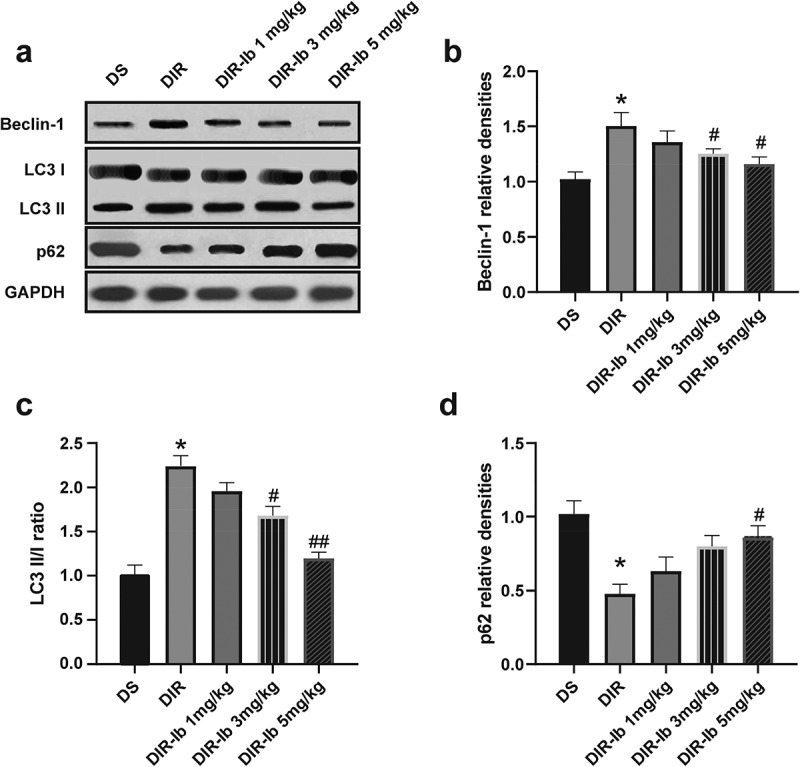
Figure 6.

Effects of Ibrutinib on the autophagy in I/R injured diabetic mice. (a) Representative western blot image of beclin-1, LC3I, LC3II, and p62. Quantification of (b) becilin-1, (c) LC3II/I, and (d) p62 expression. Data are presented as mean SD, n = 6/group. *P < 0.05 vs. the DS group and #P < 0.05 vs. the DIR group
