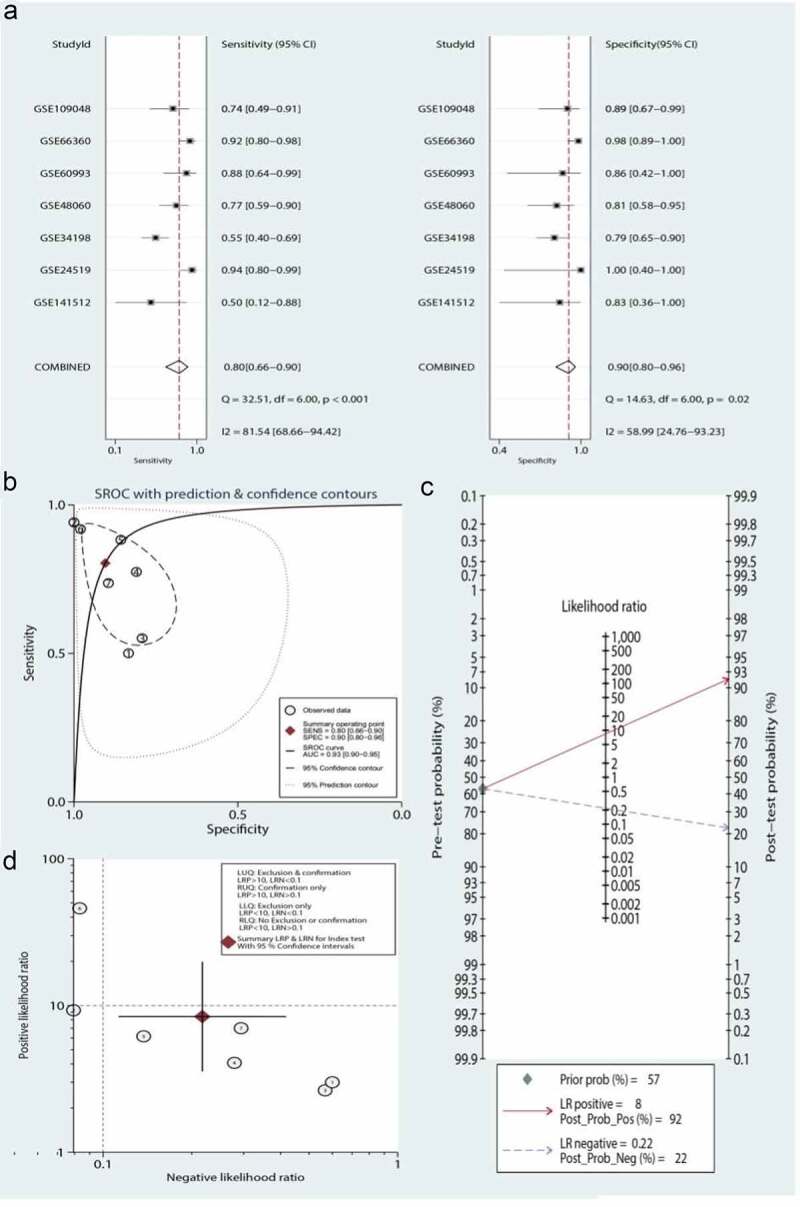
Figure 7.

Meta-analysis of the three-gene signature for predicting diagnosis in patients with myocardial infarction (MI). (a) Forest plots of the pooled sensitivity and specificity of the three-gene signature in the diagnosis of MI. (b) Summary receiver operating characteristic (SROC) curve of the three-gene signature. (c) Fagan’s nomogram was used to evaluate the clinical utility of the three-gene signature for the diagnosis of MI. (d) Likelihood ratio scattergram
