
Figure 1.
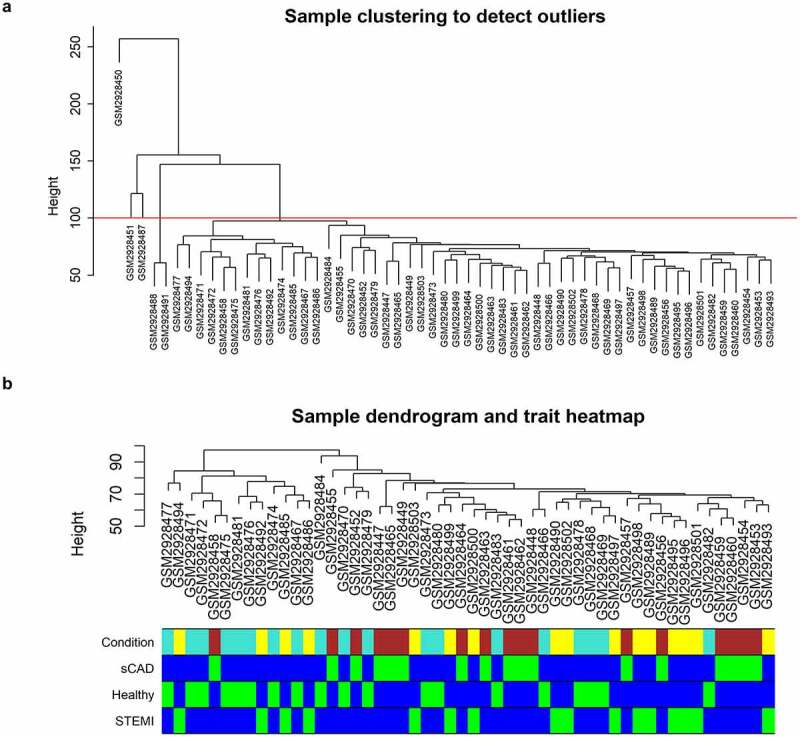
Clustering dendrogram of GSE109048. (a) A clustering tree of samples was constructed with expression; cutoff for outgroups was depicted with a red line. (b) The associated clinical traits were mapped to the clustering tree without outgroups