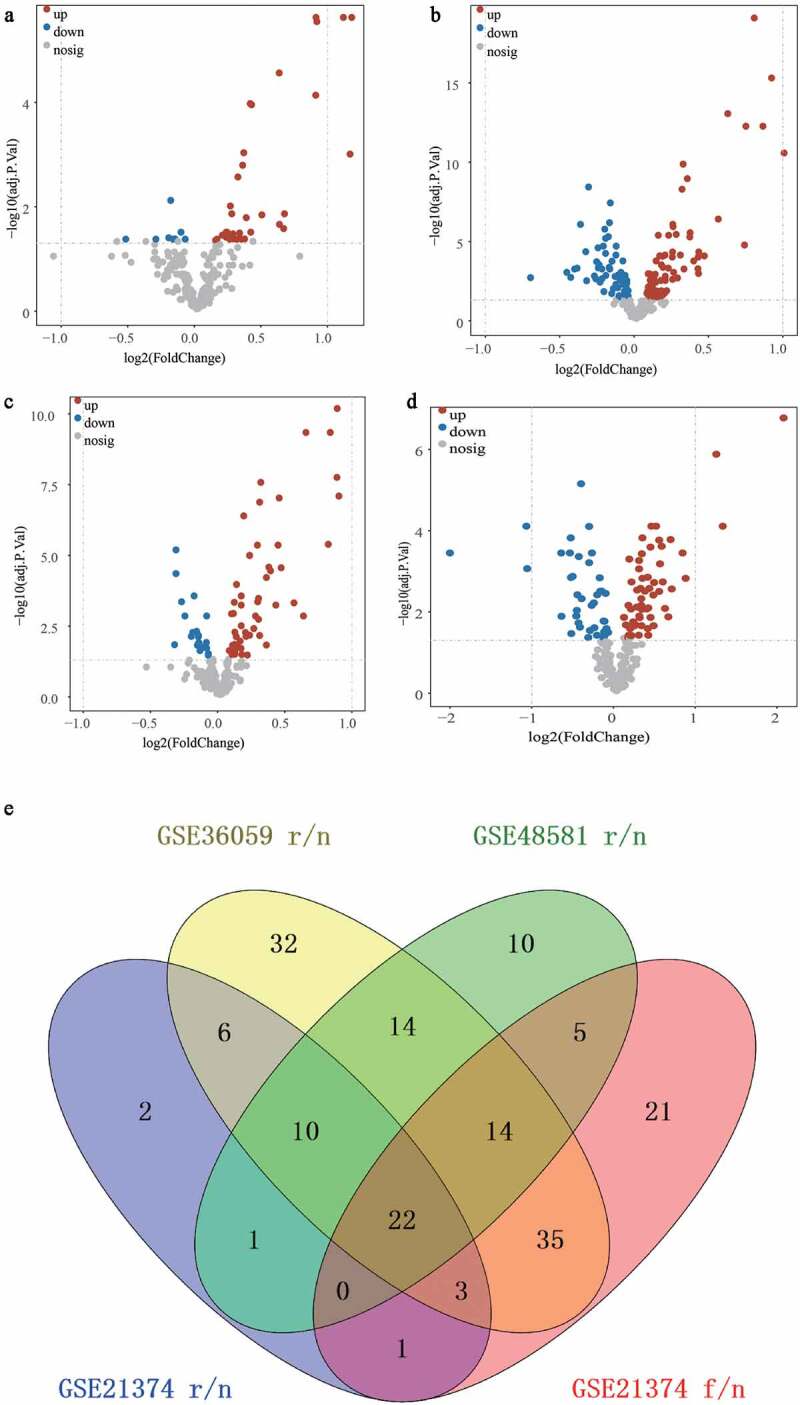
Figure 1.

Identification of the DFGs related to rejection and graft loss. (a-c) The DFGs between rejection and non-rejection group in GSE21374 (a) GSE36059 (b) and GSE48581 (c), respectively. (d) The DFGs between the group which graft loss time less than survival medium time and the group which without graft loss and survival more than survival medium time in GSE21374 dataset. (e) The Venn diagram showed the overlapping genes of these DFGs
