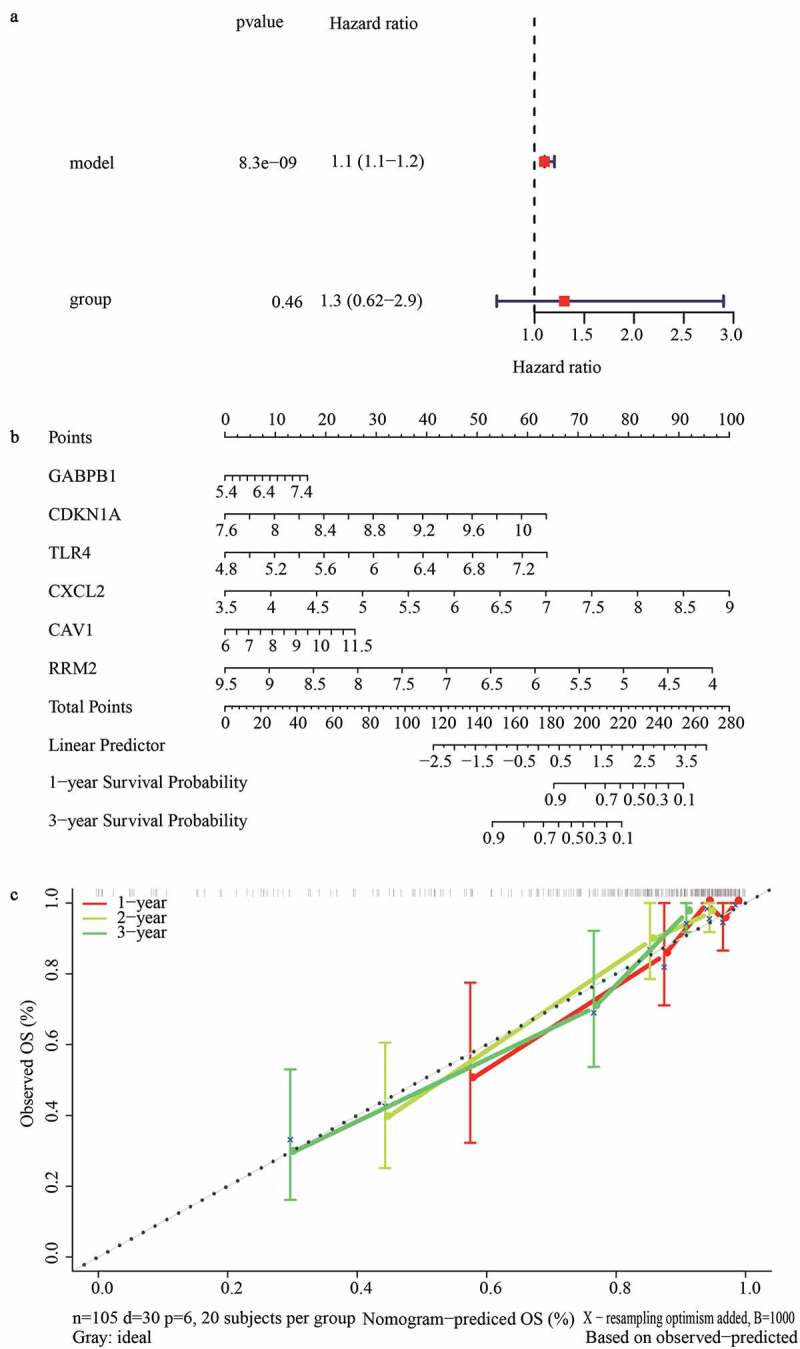
Figure 5.

Construction of a nomogram for predicting the 1-, 2- and 3-year graft loss. (a) Univariate Cox regression analysis showed the contribution of each variable to the graft loss. (b) A nomogram for predicting 1-,2-and 3- graft loss. (c) The calibration plot presented the probability for predicting the 1-, 2- and 3- graft loss
