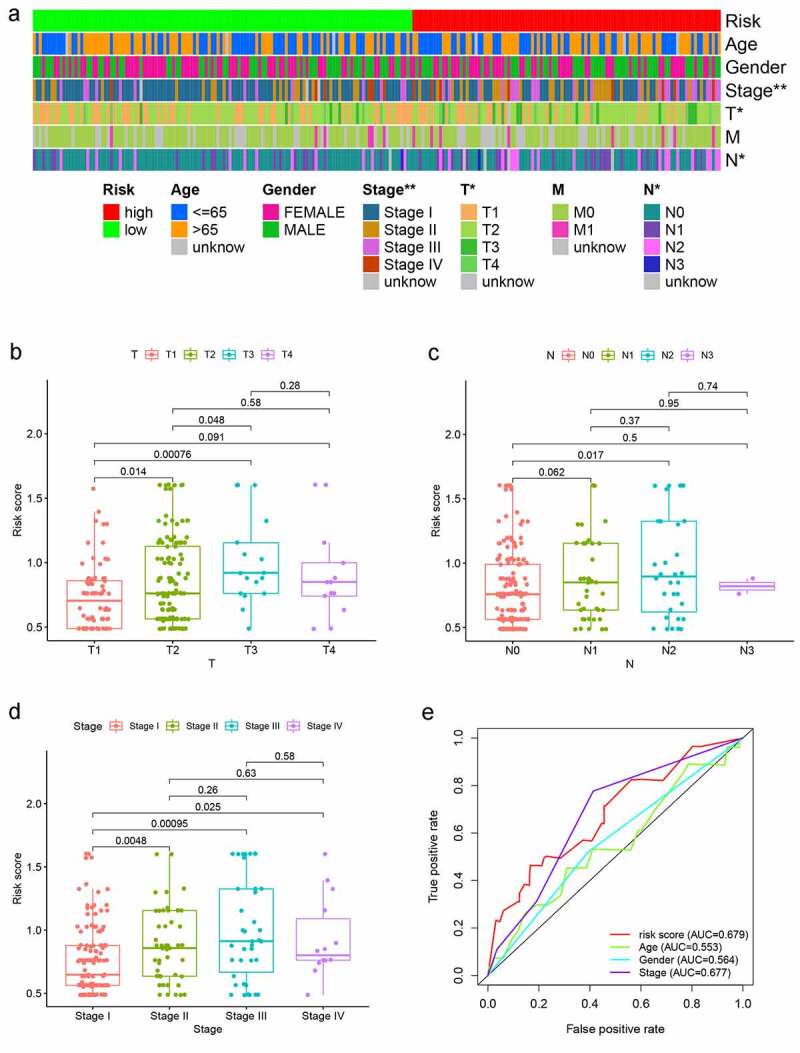
Figure 5.

Analysis between clinicopathological features and the risk model. (a–d) A strip chart along with the scatter diagram showed that T stage and N stage, and clinical stage were significantly associated with the risk score. (e) Risk score curve has the maximum AUC value (AUC = 0.679) compared to the other clinicopathological features
