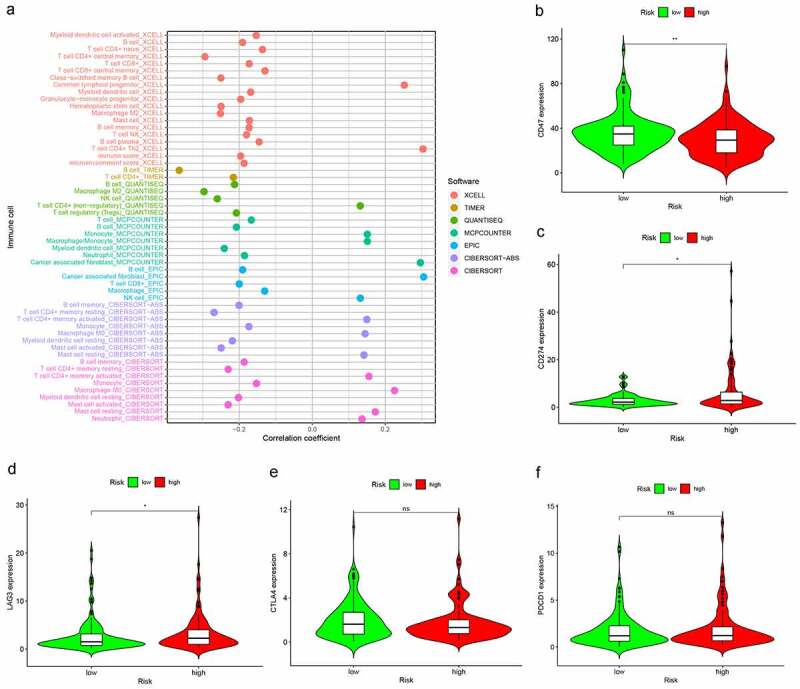
Figure 6.

Risk model in tumor-infiltrating immune cells, and ICI-related biomarkers. (a) The high-risk group was more positively correlated with macrophages M0, Neutrophil, T cell CD4+ memory activated as shown in bubble chart. (b–f) The expression of CD47, CD274, and LAG3 were statistically different between high- and low-risk groups, while not in CTLA4, PDCD1 (p < 0.001 = ***, <0.01 = **, and <0.05 = *)
