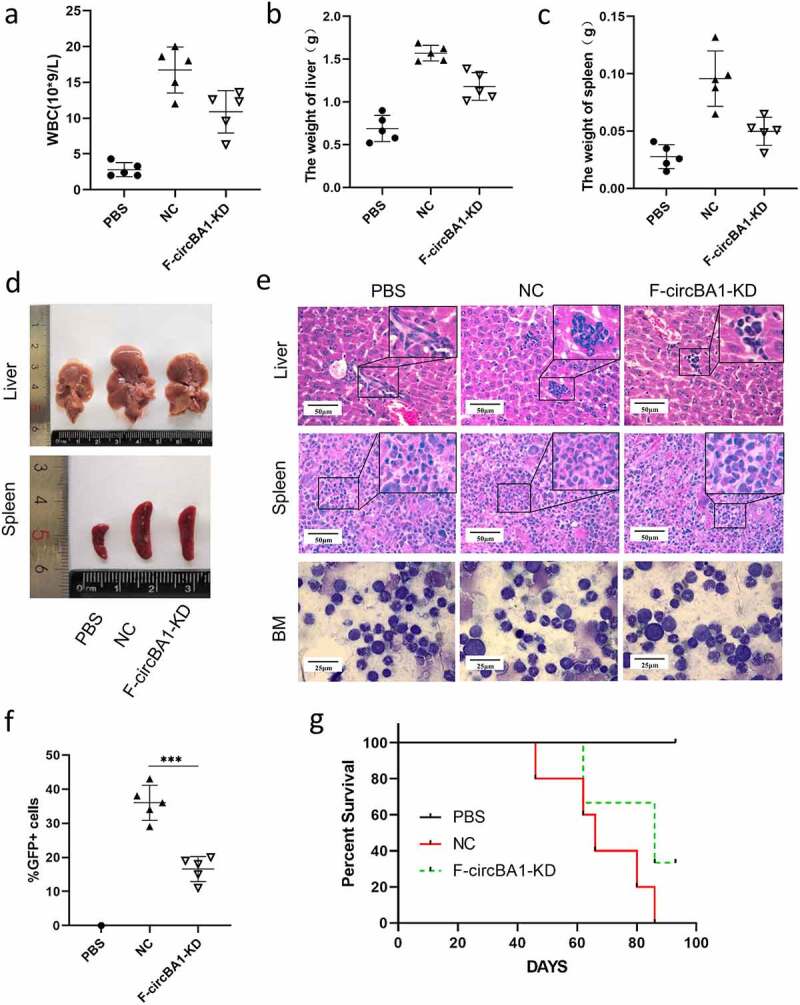
Figure 3.

F-circBA1 promotes leukemogenesis in vivo. (a) Total white blood cell count of peripheral in PBS, NC, and F-circBA1-KD groups were determined. (b-d) The weight and size of liver and spleen in PBS, NC, and F-circBA1-KD groups were determined. (e) The infiltration of CML cells in the indicated organs of each group was detected via histopathological and bone marrow cytological analysis. (f) The percentage of GFP+ cells in the peripheral blood of each group were tested using flow cytometry. (g) Survival curves were analyzed using Kaplan-Meier methods. *P < 0.05, **P < 0.01, ***P < 0.001
