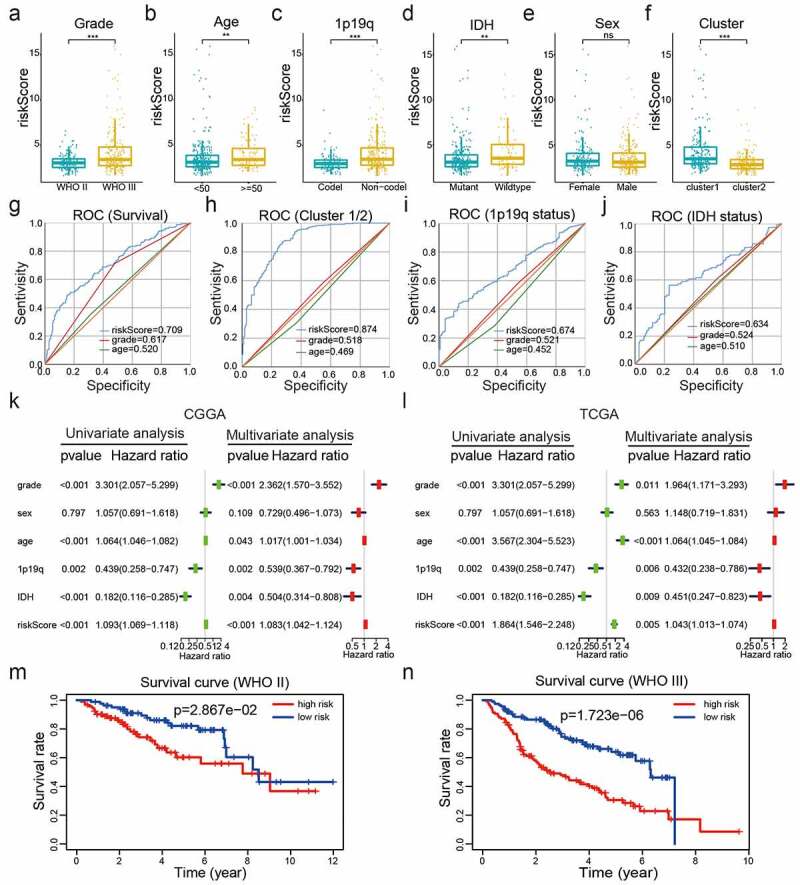
Figure 5.

Correlations between risk scores, clinical characteristics and clusters. (a-f): Distributions of risk scores stratified by WHO grade (a), age (b), 1p/19q status (c), IDH status (d), sex (e), and cluster (f). (g-j): Predictive efficiency of risk score, WHO grade and age relative to the survival rate (g), cluster1 group (h), IDH status (i) and 1p/19q codel status (j). (k-l): Relationships between clinical characteristics and OS of patients in the CGGA (k) and TCGA (l) datasets determined via univariate and multivariate Cox regression analyses. (m-n): Kaplan-Meier analysis of gliomas different WHO grades from the CGGA dataset. ns P> 0.05, * P< 0.05, ** P< 0.01, and *** P< 0.001
