

Abstract
PURPOSE
Acute care use (ACU) is a major driver of oncologic costs and is penalized by a Centers for Medicare & Medicaid Services quality measure, OP-35. Targeted interventions reduce preventable ACU; however, identifying which patients might benefit remains challenging. Prior predictive models have made use of a limited subset of the data in the electronic health record (EHR). We aimed to predict risk of preventable ACU after starting chemotherapy using machine learning (ML) algorithms trained on comprehensive EHR data.
METHODS
Chemotherapy patients treated at an academic institution and affiliated community care sites between January 2013 and July 2019 who met inclusion criteria for OP-35 were identified. Preventable ACU was defined using OP-35 criteria. Structured EHR data generated before chemotherapy treatment were obtained. ML models were trained to predict risk for ACU after starting chemotherapy using 80% of the cohort. The remaining 20% were used to test model performance by the area under the receiver operator curve.
RESULTS
Eight thousand four hundred thirty-nine patients were included, of whom 35% had preventable ACU within 180 days of starting chemotherapy. Our primary model classified patients at risk for preventable ACU with an area under the receiver operator curve of 0.783 (95% CI, 0.761 to 0.806). Performance was better for identifying admissions than emergency department visits. Key variables included prior hospitalizations, cancer stage, race, laboratory values, and a diagnosis of depression. Analyses showed limited benefit from including patient-reported outcome data and indicated inequities in outcomes and risk modeling for Black and Medicaid patients.
CONCLUSION
Dense EHR data can identify patients at risk for ACU using ML with promising accuracy. These models have potential to improve cancer care outcomes, patient experience, and costs by allowing for targeted, preventative interventions.
INTRODUCTION
Acute care use (ACU) including emergency department (ED) visits and inpatient (IP) admissions account for nearly half of the cost associated with oncologic care in the United States.1,2 As many as 50% of these visits are potentially preventable with early outpatient interventions.3-6 Furthermore, substantial regional variation in the costs and frequency of ACU suggest opportunities for reduction of ACU.1,7 Not only is ACU costly, unplanned ACU negatively affects patient quality of life and is poor-quality care.8,9 In an effort to improve quality of care, increase transparency, and reduce costs, the Centers for Medicare & Medicaid Services (CMS) implemented a new quality measure, Chemotherapy Measure (OP-35), which tracks IP admissions or ED visits for patients age ≥ 18 years for potentially preventable diagnoses within 30 days of outpatient chemotherapy administration.10
CONTEXT
Key Objective
To predict risk for preventable acute care use (ACU) after starting chemotherapy using comprehensive structured electronic health record (EHR) data.
Knowledge Generated
We evaluated several machine learning models to predict ACU following chemotherapy using a comprehensive capture of pretreatment structured variables from the EHR. The top-performing model achieved strong performance (area under the receiver operator curve = 0.783; 95% CI, 0.761 to 0.806) and identified known and previously underutilized features associated with ACU, including prior hospitalization and diagnosis of depression. We found inequities in outcomes and risk predictions for Black and Medicaid patients, suggesting closer monitoring could help achieve equitable outcomes for these groups.
Relevance
Patients at risk for preventable ACU after starting chemotherapy can be identified using machine learning. Models could risk-stratify patients using systematically captured EHR data, providing opportunities for clinical decision support tools to help health systems deliver targeted, preventative interventions to improve patient outcomes.
Although many of these admissions or ED visits are avoidable with adequate preventative care, resource constraints necessitate preventative interventions to be targeted. Therefore, developing a robust, data-driven method to identify patients who are most at risk of ED visits or acute admissions at the time of chemotherapy initiation would be valuable for health systems seeking to improve performance on OP-35 metrics. In addition, risk-stratifying patients according to their likelihood of ACU would prioritize preventative care to patients most in need, improving patient outcomes, comfort, and satisfaction during a chemotherapy regimen. Artificial intelligence (AI), including machine learning (ML) has potential to provide this type of risk assessment to physicians.
AI-driven oncologic care includes deriving novel insights from complex health data to predict patient outcomes, including cancer survival.11,12 Regulatory changes have also demanded the use of real-world data, such as that derived from electronic health records (EHRs), to guide clinical assertions and practice guidelines.13 ML applied to EHRs has been used specifically to tackle the issue of identifying patients with cancer at risk for ACU.14-17 Although these studies advance our knowledge in the field, they were limited to a small number of available variables in the EHR, used logistic regression instead of more robust AI models, and/or did not use OP-35 criteria to determine preventable ACU.
As AI enables better use of real-world data, there is an opportunity to develop clinical decision support tools that could help identify patients at higher risk of ACU following chemotherapy and therefore improve clinical and patient outcomes among these patients. We hypothesized that we could accurately identify patients with cancer undergoing chemotherapy who are at risk of preventable ACU, as defined by CMS's OP-35 using prechemotherapy EHR data. We developed, validated, and compared nine ML models to predict ACU at 3, 6, and 12 months following the start of chemotherapy among patients seen in oncology clinics affiliated with a large academic cancer center (Fig 1A). We also incorporated patient-reported outcomes (PROs) to evaluate the impact of these data on predicting risk for preventable ACU.
FIG 1.

Study design and flow diagram. (A) Comprehensive EHR data on patients who met our inclusion criteria were obtained from our database. Data generated 180 days before the start of chemotherapy were processed and used to train machine learning models to predict risk of preventable ACU. Data generated after chemotherapy initiation were used to determine patient outcomes. (B) Inclusion criteria included OP-35 denominator inclusion criteria, follow-up 180 days after the episode of care for patients who did not have ACU, and adequate data to make predictions. ACU, acute care use; EHR, electronic health record.
METHODS
Setting
This retrospective, prognostic cohort study was performed at a Comprehensive Cancer Center (CCC). The CCC includes a large tertiary practice, as well as a community hospital and community practices. This study followed the Transparent Reporting of a Multivariable Prediction Model for Individual Prognosis or Diagnosis and Minimum Information for Medical AI Reporting guidelines.18,19 This study was approved by the university's institutional review board with a waiver of informed consent. The study was approved by the local ethics committee.
Study Population
Adult patients with cancer were eligible for this study if they underwent chemotherapy at the CCC between January 1, 2013, and July 10, 2019 (Fig 1B). Patients were excluded if they failed to meet inclusion criteria for OP-35 (n = 2,272), on the basis of CMS's 2019 Chemotherapy Measure Updates and Specifications Report.20 To limit effects because of loss to follow-up, patients who did not have an encounter after their episode of care, defined by the 180 days after the start of chemotherapy, or with a recorded date of death within the episode of care without record of ACU were excluded (n = 1,217). Finally, patients were excluded if they had no vitals, laboratory, medication, diagnosis, and/or procedural data from the 180 days before chemotherapy (n = 1,237).
Study Variables
All clinical data were obtained from the EHR. The CCC has a fully implemented EPIC EHR system, installed in 2008, that includes demographic, social, vital sign, procedure, diagnosis, medication, laboratory, health care utilization, and cancer-specific data generated before the first date of chemotherapy.21 Patient demographics and clinical data were captured at the time of diagnosis and first date of treatment, including age at treatment, primary cancer type, sex, insurance payor at treatment, ethnicity, race, and stage at diagnosis. Charlson comorbidity score was calculated for each patient on the basis of pretreatment diagnoses. Deaths were captured from the internal Cancer Registry or from the patient health records. To limit data leakage allowing the models to learn from future events, data generated after patients' first date of chemotherapy treatment were only used for cohort building and determining patient outcomes and otherwise were not included in any training or testing data provided to the models. Additionally, training data were limited to information generated in the 180 days before chemotherapy initiation. Further details on data cleaning and preprocessing are available in the Appendix 1.
Outcome Measures
Although CMS uses a 30-day time frame for OP-35 numerator inclusion, our primary outcome was a hospitalization or ED visit that met OP-35 criteria (OP-35 events) within the episode of care (180 days) following the initiation of chemotherapy. However, to test model sensitivities, we analyzed performance at 30, 180, and 365 days after chemotherapy initiation and additionally analyzed for ED-only and IP-only events. ED visits resulting in admission were treated as IP events.
Predictive Models
Patients were randomly assigned to be in the training (80%) or testing cohort (20%). To predict hospitalization or ED visits following chemotherapy initiation, nine models were developed: logistic regression with least absolute shrinkage and selection operator (LASSO), Ridge, and Elastic Net penalties; random forests; gradient-boosted trees; multilayer perceptron neural networks; support vector machines; K Nearest Neighbors classifiers; and ensemble voting models that used equal voting on the predictions from other models. Additional details of model building, training, and selection are included in the Appendix 1.
Evaluation Metrics
To evaluate model performance, the models were validated on the 20% test set, not used previously for model development, on the basis of the area under the receiver operator curve (AUROC) with 1,000-fold bootstrap to determine CIs.
Patient-Reported Outcome Subanalysis
A subanalysis was performed on patients with at least one 12-item Patient-Reported Outcomes Measurement Information System (PROMIS) survey completed within 180 days before starting chemotherapy.22,23 Two new models were trained on this cohort using same preprocessing, model training, and evaluation steps described above: one with the original features, and a second with the inclusion of 14 features derived from the PROMIS data (12-item survey responses, and the global mental and physical health scores).24
Evaluation of Disparities in the Model Output
To determine any effect of inherent bias in our models and data, patients were stratified in the testing cohort by their race, ethnicity, and insurance status, and then, their predicted risk-score percentiles were compared with their true rates of OP-35 events. Empiric cumulative distributions of predicted risk-score percentiles for subgroups were plotted against each other to assess how the models predicted each subgroup's risk for OP-35 events.
Statistical Analysis
Patient clinical characteristics were compared using univariable odds ratios (ORs). The results are presented as mean ± standard deviation, unless otherwise noted.
RESULTS
Cohort Characteristics
A total of 8,439 patients were included in the study cohort who were, on average, age 60.42 (14.48) years, 50% female, and 45% non-White (Table 1). A total of 2,939 patients (35%) met our primary outcome of having at least one OP-35 event within the first 180 days after starting chemotherapy (Appendix Fig A1A). OP-35 events decreased in frequency the further from chemotherapy initiation (Appendix Fig A1B). The most common diagnoses associated with these events included pain, complications of bone marrow suppression, such as neutropenia and sepsis, and gastrointestinal side effects, such as emesis (Appendix Fig A1C).
TABLE 1.
Patient Demographics

Patients with OP-35 events by 180 days significantly varied in multiple clinical characteristics than those without. For instance, these patients were on average 2.5 years younger at diagnosis (OR 0.988 per year; 95% CI, 0.985 to 0.991; P < .0001), more likely to be male (OR 1.113; 95% CI, 1.102 to 1.123; P < .0001), non-White (OR 1.280; 95% CI, 1.252 to 1.309; P < .0001), have stage IV disease (OR 1.873; 95% CI, 1.762 to 1.993; P < .0001), have a smoking history (OR 1.056; 95% CI, 1.062 to 1.051; P < .0001), and have a diagnosis of depression (OR 1.422; 95% CI, 1.369 to 1.478; P < .0001).
Model Performance for Predicting Risk of OP-35 Events
Overall, the various ML models performed reasonably well for determining patient risk for OP-35 events using the 759 EHR-based variables on which they were trained (AUROC range: 0.740-0.806, Appendix Table A2). Although the ensemble voting model had the best performance for predicting events by 180 days (AUROC 0.806; 95% CI, 0.794 to 0.816), the LASSO model performed comparably (AUROC 0.783; 95% CI, 0.761 to 0.806; AUROC range during cross-validation = 0.746-0.825, Appendix Figs 2B and 2C). As LASSO is a regularized form of logistic regression, it is easier to interpret how it is making predictions than with more complicated models and was therefore chosen to be our primary model. Although thresholds to label if a patient is likely to have an event could vary depending on the clinical use case, at Youden's index (probability of event = .278), this model had the following performance metrics: accuracy = 0.700; F1 score = 0.644; precision (event) = 0.567; precision (nonevent) = 0.821; recall (event) = 0.745; recall (nonevent) = 0.821; and area under the precision-recall curve = 0.702. This model selected 125 of 759 possible features to use in its predictions. These features included clinical variables used in prior risk models, such as the number of pretreatment hospitalizations, advanced stage disease, and white blood cell count, as well as underutilized features, including a diagnosis of depression, race, and prior brainstem magnetic resonance imaging (see Table 2 for the top model features and Appendix Table A3 for the full feature set).
TABLE 2.
Key Features of the Primary Model

To test the model's discriminative power in a setting similar to how it might be implemented at the point of care, the testing cohort was stratified into high-, intermediate-, and low-risk groups on the basis of their predicted risk score tertile. Kaplan-Meier survival curves for OP-35 events showed good separation between risk groups (Fig 2, P < .00001 for each group by log-rank test). By 180 days after starting chemotherapy, 357 (64%) of the 563 high-risk patients had an OP-35 event, whereas 75 (13%) of the 563 low-risk patients had an event.
FIG 2.

Risk-stratified Kaplan-Meier survival curves for ACU. Kaplan-Meier curves for preventable ACU events for patients in the test cohort stratified by predicted risk tertile. Shaded area represents 95% CIs. ACU, acute care use.
To assess the relative importance of each type of feature (eg, medications) on the model's predictions, performance was evaluated after retraining when withholding each feature type (Appendix Table A4). All 95% CIs for the AUROCs of the models with the withheld data overlapped with that of the model trained with the full data set; however, predictive performance generally declined when withholding feature types and experienced the greatest decline when withholding demographic and cancer-specific data (AUROC 0.779; 95% CI, 0.755 to 0.802).
Model Performance for Alternative Outcomes
The sensitivity of the primary LASSO model for predicting risk for OP-35 events was tested at alternative time points (30 and 365 days) and specific ACU setting (ED-only v IP-only). The performance decreased slightly compared with the 180-day outcome for both the 30-day (AUROC 0.774; 95% CI, 0.760 to 0.788) and 365-day outcomes (AUROC 0.772; 95% CI, 0.761 to 0.784; Appendix Fig A2A). The model had improved performance predicting IP-only events (AUROC 0.798; 95% CI, 0.787 to 0.809), but substantially worse performance for ED-only events (AUROC 0.615; 95% CI, 0.595 to 0.635) compared with the primary outcome; however, a model trained specifically to predict ED events performed comparably (AUROC 0.781; 95% CI, 0.762 to 0.796).
Effect of Race, Ethnicity, and Insurance Type
Notably, Black, Hispanic or Latino, and Medicaid patients were predicted to be disproportionately higher risk than their counterparts (Figs 3A-3C). For instance, 50% of the Black patients in our cohort were predicted to be at the 67.5th percentile of risk or higher. In the testing cohort, there was no significant difference in events between Black and White patients (41.3% v 33.5% with an event, respectively, P = .275); however, the predicted risk percentile for Black patients was significantly higher (64.15 ± 26.41 v 47.25 ± 28.59, P = .0001). Concordantly, the model also exhibited poor calibration for Black patients (Appendix Fig A3A). Similarly, 50% of Medicaid patients were predicted to be at the 64th percentile of risk or higher, and these patients had significantly higher predicted risk percentiles than those with private insurance (61.97 ± 26.20 v 51.65 ± 29.38, P = .002). When examining the interaction between race and insurance type, there was an additive effect between being Black and having Medicaid insurance (Fig 3D).
FIG 3.

Algorithmic risk scores stratified by race, ethnicity, and insurance status. Empiric cumulative distribution plots for the percentile of predicted risk for the test cohort stratified by (A) race, (B) ethnicity, (C) insurance status, and (D) the interaction between Black race and Medicaid.
Effect of PROs on Model Performance
Finally, to evaluate the impact PROs have on predictive performance, new LASSO models were trained to predict the risk for OP-35 events at 180 days on the subset of patients who had PRO data (n = 1,808). The baseline model on this data set performed with an AUROC of 0.735 (95% CI, 0.673 to 0.799). With the inclusion of PRO data, performance did not significantly change (AUROC 0.736; 95% CI, 0.673 to 0.798), but the model required only 41 features for comparable performance as compared to the 125 in the original model. PROMIS features selected by the model included the global physical health score, the self-reported pain score, and the self-reported quality of life score.
DISCUSSION
Improving the care and outcomes of patients with cancer undergoing chemotherapy must incorporate insights learned from AI-driven decision support. In this study, we identify patients at high risk for preventable acute care, the target of CMS's OP-35 measure, using ML models trained on routinely collected clinical data that demonstrated strong predictive performance. Our primary model was able to accurately discriminate patients at high risk for ACU versus low risk at an actionable level of accuracy. As payment models move to incorporate more value-based care measures and regulatory agencies demand the incorporation of real-world data to guide clinical practice, the open-source, ML-based tool we present has strong clinical utility and the potential to improve the identification and mitigation of these high-risk patients.
Our work presents a model focused specifically on OP-35 eligible admissions and ED visits, which can be implemented by health care systems that routinely capture prechemotherapy data on their patients by following our methodology. The regression coefficients that were selected by the LASSO model are generally consistent with previously reported literature about risk factors for ACU for patients with cancer; for example, previous ED admissions,25 neutropenia,26 and depression27 have all been shown to be associated with unplanned admissions in previous studies. In addition, the model selected novel features not typically included in risk models, such as depression and prior brain imaging, indicating that there is likely loss of predictive information when using a small subset of clinical variables. The limited declines in predictive performance when withholding entire feature categories from the model further suggest that missing predictive information can be partially recovered from other parts of the patient record and there are likely many plausible explanatory models when using dense data. Compared to previous work predicting ACU in patients with cancer, we used OP-35 inclusion criteria to identify preventable ACU, limited data input to only include data up to the initiation of chemotherapy, and took advantage of the richness of data offered by the EHR, incorporating more information about the patient's overall health to aid with prediction by using more than 750 EHR-derived features, whereas prior studies have made use of a much smaller set of clinical features.14,15,28,29
The very modest gains in predictive performance when including PROs expands upon recent work integrating PROs in ML models. Seow et al30 developed an ML model to predict cancer patient survival that integrated clinical characteristics and PROs to achieve strong predictive performance and calibration; however, it is unclear what benefit PRO inclusion provided to their predictions, as they do not report a model when withholding PROs.30 Although PROs are a critical component of evaluating modern oncology care, similar to our study, Grant et al recently showed that PROs did not improve performance when predicting ACU, suggesting their use may be somewhat limited in this particular prediction task.14,31 Importantly, this study shows that PROs provide some predictive power to determine risk for ACU, but they do not substantially add to model performance when sufficient structured EHR data are available for predictions.
Given the prior evidence of inequitable outcomes on the basis of demographic subgroup and insurer, we felt it was important to provide race, ethnicity, and insurance data to our models to study their respective effects.32-36 Our results further indicate that Black race and Medicaid payor are predictive of increased risk for ACU. In particular, our findings that patients with cancer with Medicaid insurance have higher risk scores for ACU are aligned with previous findings and suggest that Medicaid is correlated with poor patient outcomes. Although our analyses are not designed to address causation, our results support further study of these discrepancies for evaluation and the identification of methods to mitigate identified inequalities. Our health care system strives to equalize resource allocation; however, these results suggest that Medicaid and Black patients need closer monitoring than others to achieve equitable outcomes. This phenomenon is not localized to our health care system, as others have shown similar results across diverse settings.37 There is a growing shift in care delivery that emphasizes equitable outcomes over equal access to resources. A potential strategy to address this lack of equitable outcomes would be to ensure Medicaid and Black patients undergoing chemotherapy have more frequent follow-up and closer monitoring of symptoms than non-Hispanic Whites and patients insured by Medicare or private companies. Such strategies could potentially help decrease unethical gaps in outcomes. Additionally, the poor calibration of our models for certain demographic groups highlights the critical importance of making clinicians aware of potential biases in risk models when using these to make care decisions to limit perpetuation of bias and exacerbation of inequities.
Clinical implementation of this model can help provide outpatient physicians a data-driven tool to identify patients who are at highest risk of unplanned ED or IP admission and preemptively intervene. We envision a sliding scale of interventions on the basis of the risk cohort that the patient falls into, determined by their ML risk score.38 For example, high-risk patients could be prioritized for advanced home-based health care,39 frequent nursing follow-up phone calls to manage outpatient symptoms and answer questions,40 or home telemonitoring services.41 Targeting these interventions to high-risk cohorts is a cost-effective way for health care systems to manage large populations of oncology patients in a data-driven manner and is already being implemented in some health systems. A recent report that prospectively validated a similar ACU prediction model in radiotherapy patients demonstrated a 10% reduction in ACU for patients who received more frequent evaluation after being identified by an algorithm as high risk.29,42 From the patient's perspective, ML-guided interventions to reduce ACU would be beneficial, as increasing the number of days at home during chemotherapy and end-of-life oncology care is an important metric for quality of life.43
There are several limitations that are important to consider in this study. First, this study was performed at a large, academic medical center with multiple specialty oncology practices. In particular, the small number of Black and Black Medicaid patients in our analytic cohort, which reflects the current catchment area of our institution, may limit the generalizability of our analysis. Our cancer center is expanding its catchment area to include treatment centers serving more currently under-represented minorities in our common EHR information platform, which we will use to confirm our analyses and test interventions. External validation of this model at both academic and nonacademic hospitals is needed to ensure generalizability; however, this may prove difficult because of variations in EHR implementations resulting in nonparsimonious models. We plan to develop models on the basis of a common data model, readily allowing for exportation to other systems. In the interim, we encourage other health systems to follow our methodology and expand upon our results. Second, our model relies upon a large number of clinical variables, and although many of these values are routinely collected in the EHR, developing an information technology pipeline that reliably and accurately retrieves these data from the EHR for real-time predictions at the point of care could prove challenging. Third, our model is focused on a binary prediction of ACU within specific follow-up windows; however, there are many patients who will often have repeat admissions within the same follow-up window, significantly driving up utilization and costs.26 Future prediction models could be used to identify the number of ACU events per patient within prediction windows, giving health care systems more granular data to determine which patients would most likely benefit from preventative admission interventions. Fourth, our utilization and mortality data are limited to ED visits and admissions in our health care system and deaths captured by our cancer registry. Therefore, the data may be missing deaths and acute care services rendered elsewhere. Finally, although we developed a model for all patients receiving chemotherapy, regardless of the underlying cancer etiology, it is likely that models for specific cancer types would have improved performance at the expense of generalizability.
In conclusion, in this study, we present a data-driven model to identify chemotherapy patients at high risk for preventable ACU, as defined by CMS's OP-35 quality measure. We found that an ML model trained on a large number of routinely collected clinical variables can accurately identify patients at risk for ACU while on chemotherapy before starting treatment. Our model selected clinical features used in prior risk models and other less commonly used features to produce predictions with an actionable level of accuracy. Additionally, the inherent bias in our models and data demonstrate inequity in both health care systems and risk models and suggest Medicaid and Black patients would benefit from closer monitoring than others to achieve equitable outcomes. Further work will be needed to validate our models in other health care systems and assess the clinical impact of pretreatment risk predictions. Nonetheless, ML models can risk-stratify patients, allowing for differential intensity of monitoring and targeted, preventative interventions, and have potential to improve cancer care outcomes, costs, and patient experience.
APPENDIX 1
Data Preprocessing
Vital sign data were first cleaned of values incompatible with life as determined by clinician input. Next, a time-weighted average of vital sign data was calculated for each patient, with values close to the first date of chemotherapy more heavily weighted while still accounting for historical trends. This was done using the formula , where i indicates the feature, j indicates the participant, and t is the number of days before the start of chemotherapy for that participant. Missing vitals were then mean imputed if not present. Similarly, a time-weighted count for each procedure code was generated for each patient, with more recent procedures receiving higher values using the above formula. Individual medications were mapped to pharmacologic classes, and patients were given binary values for prescribed or not in the 180 days before chemotherapy. Health care utilization features included the number of prechemotherapy emergency department, inpatient, and psychiatry department visits, the proportion of emergency department visits that resulted in admission, and the average length of inpatient stays. For laboratory data, each laboratory was harmonized to common units, and then, a time-weighted average for each laboratory feature was calculated using the above formula. K Nearest Neighbors (KNN) imputation was then used to fill missing values with patients receiving the mean value of the 10 patients in the training set with the most similar laboratory profile on the basis of the laboratory data they did have. The KNN-imputer fit on the training set was used to impute missing values for both the training and testing cohorts. Additional features engineered included the total number of procedures, diagnoses, and medications that a patient had. To limit sparsity in the data, as most procedures, medications, diagnoses, and labs were only present in a limited subset of the cohort, features in these categories present in < 2.5% of the training cohort were excluded, yielding a total of 759 features. To complete preprocessing, each of the continuous variables was scaled to a standard normal distribution.
Models Trained
A total of nine models were trained. These included least absolute shrinkage and selection operator (LASSO), Ridge, and elastic net penalties, random forests, gradient-boosted model (GBM) trees, multilayer perceptron neural networks, support vector machines, KNN classifiers, and ensemble voting models that used equal voting on the predictions from the LASSO, ridge, elastic net, random forest, GBM, and support vector machines for a given outcome. A grid search with 10-fold cross-validation was used to tune hyperparameters and optimize performance on the training cohort using the area under the receiver operator curve metric (see Appendix Table A1 for the hyperparameter tuning details for each model). Except for the LASSO model, the best performing model from the grid search was then selected for evaluation for each outcome-model pair. For the LASSO model, we selected the most regularized model with a cross-validated error within 1 standard error of the minimum during cross validation (ie, the model using a lambda equal to the lambda.1se parameter returned from the cv.glmnet function).
Analysis Code
All codes were written in Python 3.6 (Python Software Foundation, https://www.python.org/), and all models were implemented using the scikit-learn package (version 0.22.1) with the exception of the GBM models, which were implemented using LightGBM (version 2.3.1), and the LASSO models, which were implemented in R 4.0.2 (The R Project for Statistical Computing, https://www.r-project.org/) using the glmnet package (version 4.1) with feature CIs generated by the selectiveInference package (version 1.2.5; Pedregosa F, et al: Scikit-learn: Machine Learning in Python; Ke G, et al: Curran Associates, 2017, pp 3149-3157; Friedman JH, et al: J Stat Softw 33:1-22, 2010; Tibshirani R, et al: 2019. https://CRAN.R-project.org/package=selectiveInference).
FIG A1.

OP-35 events in cohort. (A) Cumulative proportion of the cohort with an OP-35 event after time chemotherapy imitation. (B) Distribution of time from chemotherapy initiation to first OP-35 event in the cohort. (C) Distribution of diagnoses associated with the first OP-35 event for patients in the cohort. ACU, acute care use; ED, emergency department.
FIG A2.
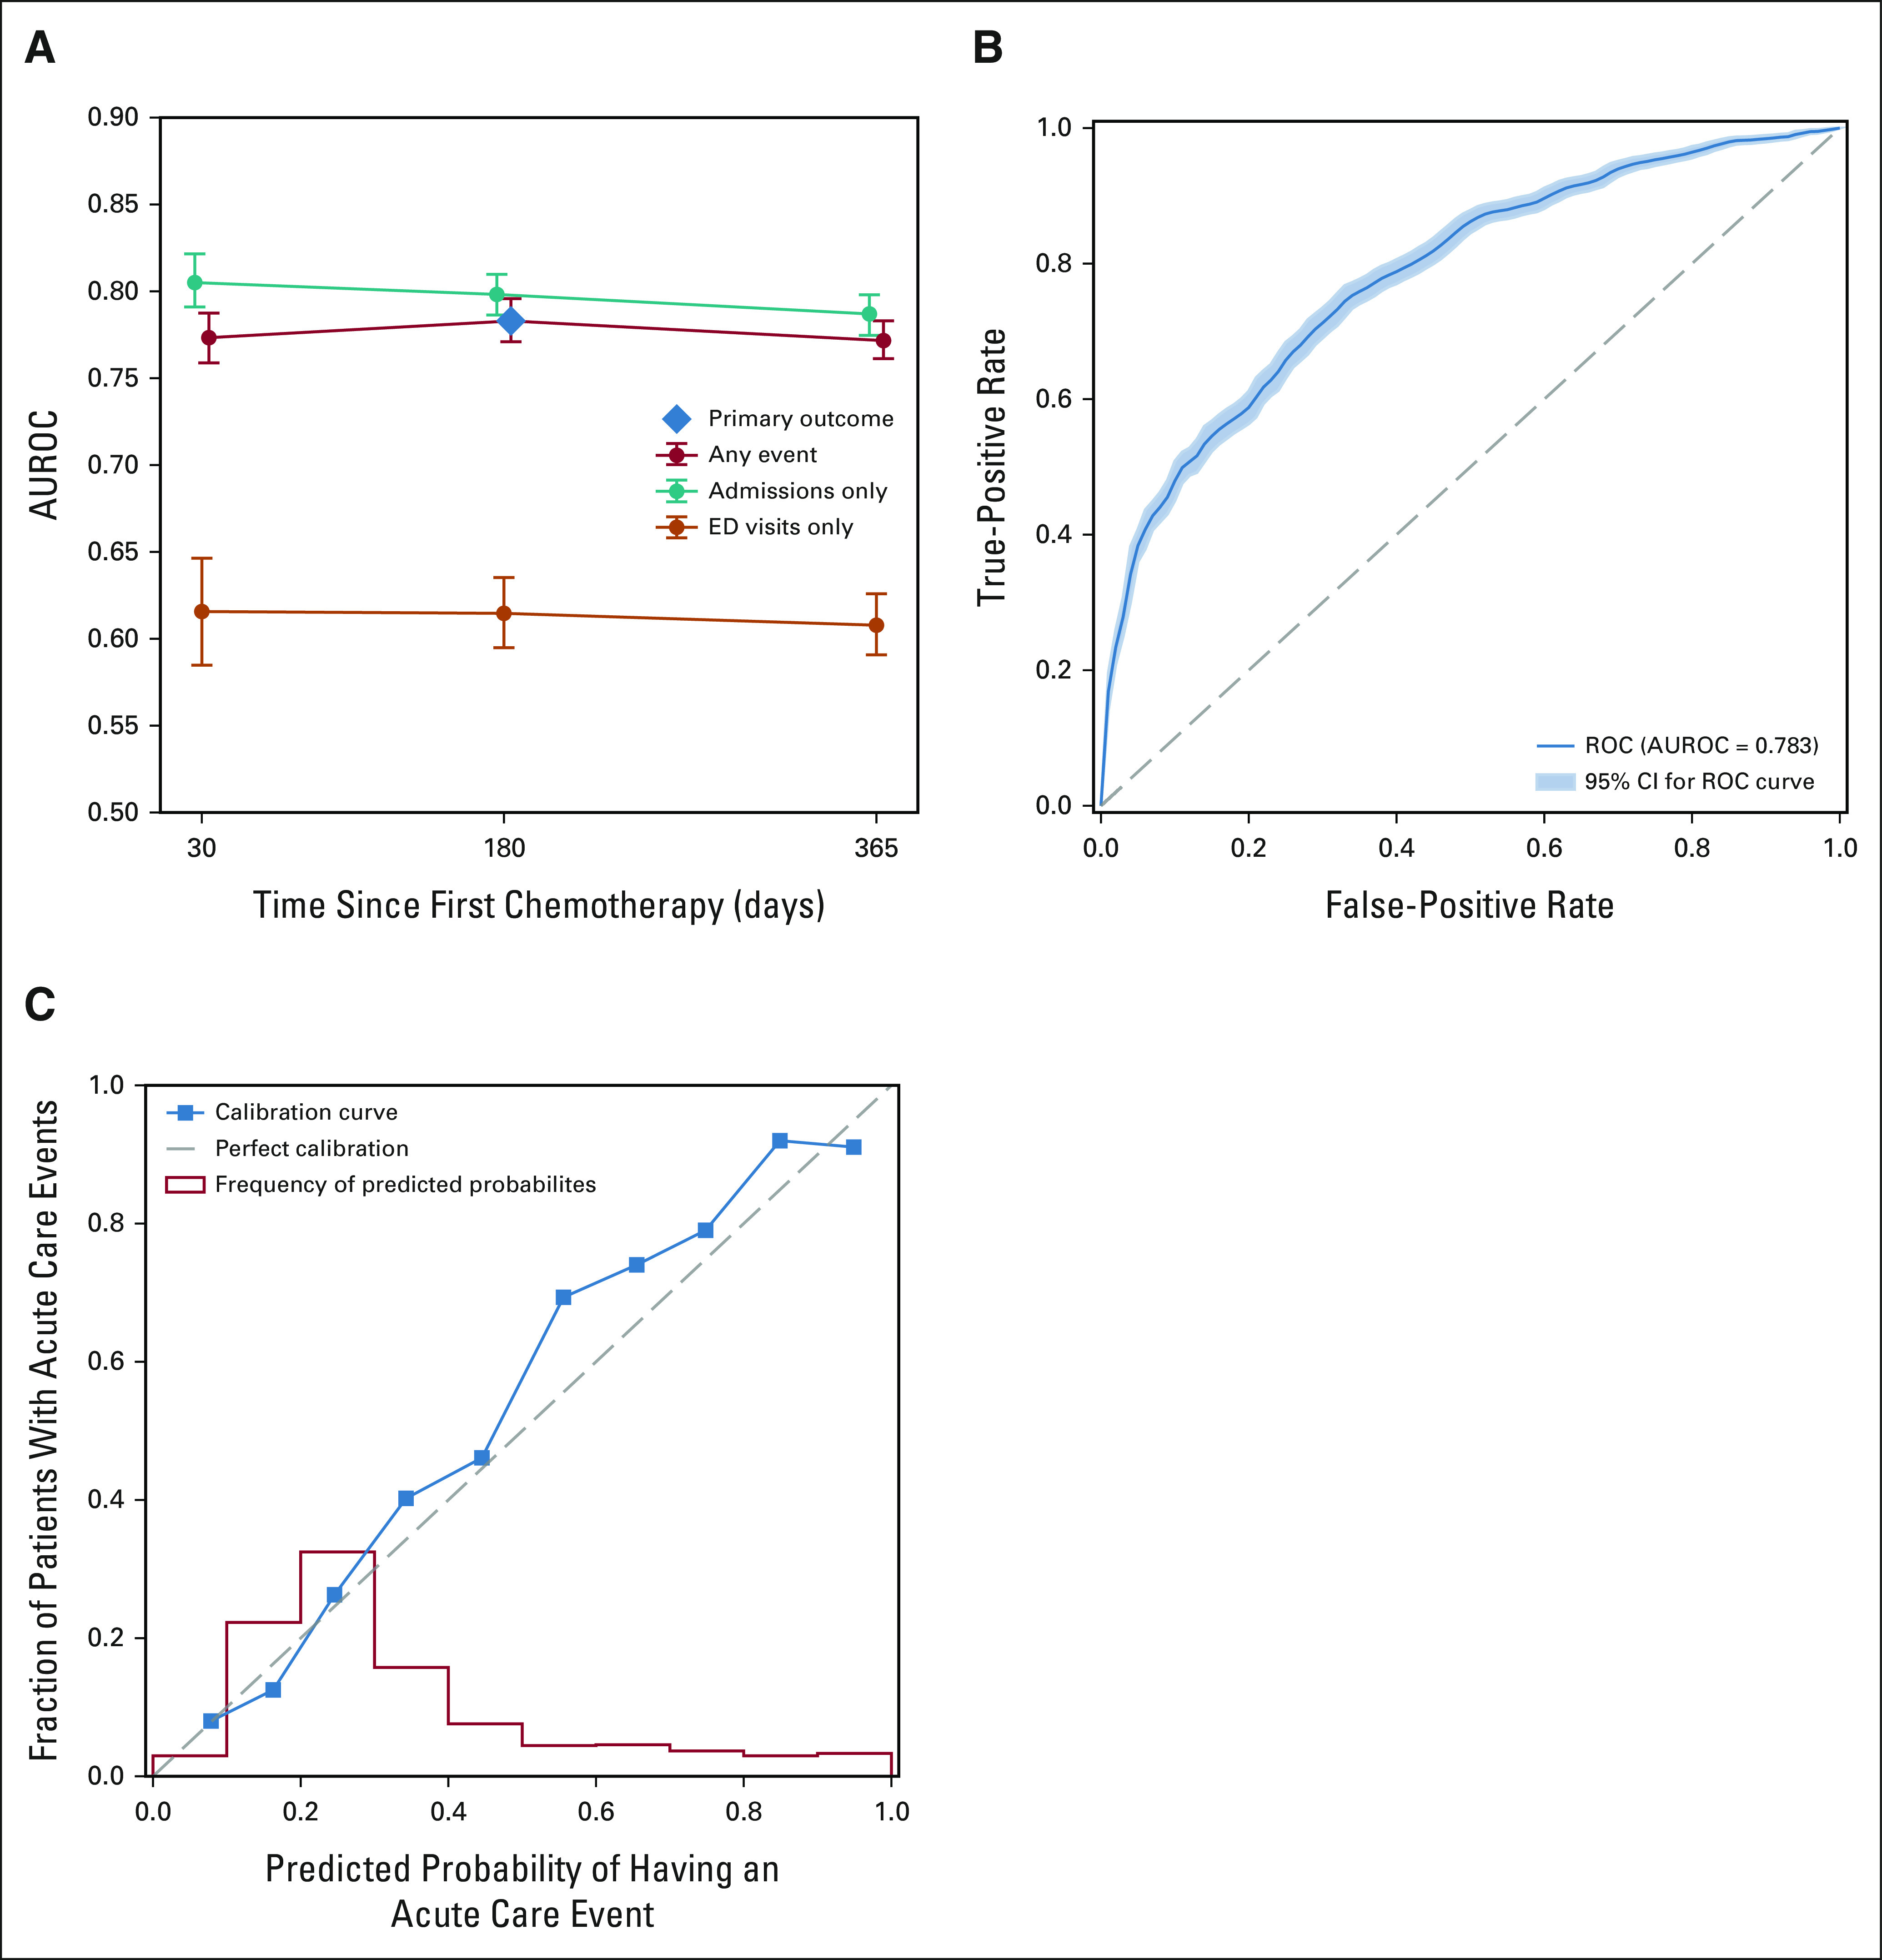
LASSO Model Performance. (A) Performance of primary LASSO model for predicting any OP-35 event, admissions-only OP-35 events, and ED visits-only OP-35 events at 30, 180, and 365 days. Vertical bars indicate 95% CIs. (B) ROC for the LASSO model when predicting any OP-35 event at 180 days. Shaded area indicates 95% CI. (C) Calibration curve for the LASSO model when predicting any OP-35 event at 180 days (blue) and distribution of predicted probabilities of having an OP-35 event by 180 days (red). AUROC, area under the receiver operator curve; ED, emergency department; LASSO, least absolute shrinkage and selection operator; ROC, receiver operator curve.
FIG A3.

LASSO model calibration for demographic subgroups. Calibration curves and histograms of predicted probabilities for ACU for the primary LASSO model, stratified by demographic subgroups: (A) White versus Black patients, (B) Hispanic or Latino versus non-Hispanic or non-Latino patients, and (C) Medicaid versus non-Medicaid patients. ACU, acute care use; LASSO, least absolute shrinkage and selection operator.
TABLE A1.
Hyperparameter Tuning

TABLE A2.
Model AUROCs

TABLE A3.
All Least Absolute Shrinkage and Selection Operator Coefficients

TABLE A4.
Ablation Analysis AUROCs

Douglas W. Blayney
Leadership: Artelo Biosciences
Stock and Other Ownership Interests: Artelo Biosciences, Madorra
Consulting or Advisory Role: Creare, Daiichi Sankyo, Embold Health, Lilly, Google, G1 Therapeutics, Merck, BMS, Incyte
Research Funding: BeyondSpring Pharmaceuticals (Inst), Creare (Inst)
Open Payments Link: https://openpaymentsdata.cms.gov/physician/728442
James D. Brooks
Stock and Other Ownership Interests: Guardant Health
Tina Hernandez-Boussard
Consulting or Advisory Role: Verantos
Research Funding: AstraZeneca (Inst), Health Management Systems (Inst)
Travel, Accommodations, Expenses: Health Management Systems
No other potential conflicts of interest were reported.
DISCLAIMER
The content is solely the responsibility of the authors and does not necessarily represent the official views of the National Institutes of Health.
The funding sources had no role in the design and conduct of the study; collection, management, analysis, and interpretation of the data; preparation, review, or approval of the manuscript; or decision to submit the manuscript for publication.
PRIOR PRESENTATION
Abstract presented at the 2021 ASCO Annual Meeting, June 4-8, 2021, virtual; and the NCCN 2021 Annual Conference, March 18-20, 2021, virtual.
SUPPORT
Supported by the National Cancer Institute of the National Institutes of Health under Award Number R01CA183962.
DATA SHARING STATEMENT
The analysis code for this study is available at https://github.com/dylan-peterson-95/predicting-preventable-admissions. As we are unable to share PHI, there are simulated data available in the repository with an example of how to generate model predictions.
AUTHOR CONTRIBUTIONS
Conception and design: All authors
Financial support: Tina Hernandez-Boussard
Administrative support: James D. Brooks, Tina Hernandez-Boussard
Provision of study materials or patients: Tina Hernandez-Boussard
Collection and assembly of data: Dylan J. Peterson
Data analysis and interpretation: All authors
Manuscript writing: All authors
Final approval of manuscript: All authors
Accountable for all aspects of the work: All authors
AUTHORS' DISCLOSURES OF POTENTIAL CONFLICTS OF INTEREST
The following represents disclosure information provided by authors of this manuscript. All relationships are considered compensated unless otherwise noted. Relationships are self-held unless noted. I = Immediate Family Member, Inst = My Institution. Relationships may not relate to the subject matter of this manuscript. For more information about ASCO's conflict of interest policy, please refer to www.asco.org/rwc or ascopubs.org/cci/author-center.
Open Payments is a public database containing information reported by companies about payments made to US-licensed physicians (Open Payments).
Douglas W. Blayney
Leadership: Artelo Biosciences
Stock and Other Ownership Interests: Artelo Biosciences, Madorra
Consulting or Advisory Role: Creare, Daiichi Sankyo, Embold Health, Lilly, Google, G1 Therapeutics, Merck, BMS, Incyte
Research Funding: BeyondSpring Pharmaceuticals (Inst), Creare (Inst)
Open Payments Link: https://openpaymentsdata.cms.gov/physician/728442
James D. Brooks
Stock and Other Ownership Interests: Guardant Health
Tina Hernandez-Boussard
Consulting or Advisory Role: Verantos
Research Funding: AstraZeneca (Inst), Health Management Systems (Inst)
Travel, Accommodations, Expenses: Health Management Systems
No other potential conflicts of interest were reported.
REFERENCES
- 1.Brooks GA, Li L, Uno H, et al. Acute hospital care is the chief driver of regional spending variation in Medicare patients with advanced cancer Health Aff (Millwood) 331793–18002014 [DOI] [PMC free article] [PubMed] [Google Scholar]
- 2.Yabroff KR, Lamont EB, Mariotto A, et al. Cost of care for elderly cancer patients in the United States J Natl Cancer Inst 100630–6412008 [DOI] [PubMed] [Google Scholar]
- 3. Adelson KB, Dest V, Velji S, et al. Emergency department (ED) utilization and hospital admission rates among oncology patients at a large academic center and the need for improved urgent care access. J Clin Oncol. 2014;32(30 suppl) abstr 19. [Google Scholar]
- 4. Brooks G, Uno H, Jacobson JO, et al. Clinician assessment of potentially avoidable hospitalization in patients with cancer. J Clin Oncol. 2014;32(30 suppl) doi: 10.1200/JCO.2013.52.4330. abstr 4. [DOI] [PMC free article] [PubMed] [Google Scholar]
- 5.El-Jawahri A, Keenan T, Abel GA, et al. Potentially avoidable hospital admissions in older patients with acute myeloid leukaemia in the USA: A retrospective analysis Lancet Haematol 3e276–e2832016 [DOI] [PubMed] [Google Scholar]
- 6.Delgado-Guay MO, Kim YJ, Shin SH, et al. Avoidable and unavoidable visits to the emergency department among patients with advanced cancer receiving outpatient palliative care J Pain Symptom Manage 49497–5042015 [DOI] [PubMed] [Google Scholar]
- 7.Brooks GA, Li L, Sharma DB, et al. Regional variation in spending and survival for older adults with advanced cancer J Natl Cancer Inst 105634–6422013 [DOI] [PMC free article] [PubMed] [Google Scholar]
- 8.Wallace EM, Cooney MC, Walsh J, et al. Why do palliative care patients present to the emergency department? Avoidable or unavoidable? Am J Hosp Palliat Care 30253–2562013 [DOI] [PubMed] [Google Scholar]
- 9.Earle CC, Park ER, Lai B, et al. Identifying potential indicators of the quality of end-of-life cancer care from administrative data J Clin Oncol 211133–11382003 [DOI] [PubMed] [Google Scholar]
- 10.Centers for Medicare & Medicaid Services . 2019 Chemotherapy Measure Facts Admissions and Emergency Department (ED) Visits for Patients Receiving Outpatient Chemotherapy Hospital Outpatient Quality Reporting (OQR) Program (OP-35) https://qualitynet.cms.gov/files/5dcc6762a3e7610023518e23?filename=CY21_OQRChemoMsr_FactSheet.pdf [Google Scholar]
- 11.Nagy M, Radakovich N, Nazha A.Machine learning in oncology: What should clinicians know? JCO Clin Cancer Inform 4799–8102020 [DOI] [PubMed] [Google Scholar]
- 12. Parikh RB, Manz C, Chivers C, et al. Machine learning approaches to predict 6-month mortality among patients with cancer. JAMA Netw Open. 2019;2:e1915997. doi: 10.1001/jamanetworkopen.2019.15997. [DOI] [PMC free article] [PubMed] [Google Scholar]
- 13.U.S. Government Publishing Office . 21st Century Cures Implementation: Updates From FDA and NIH. Subcomitte on Health of the Committee on Energy and Commerce of the House of Representatives; 2018. https://www.govinfo.gov/content/pkg/CHRG-115hhrg35866/html/CHRG-115hhrg35866.htm [Google Scholar]
- 14. Grant RC, Moineddin R, Yao Z, et al. Development and validation of a score to predict acute care use after initiation of systemic therapy for cancer. JAMA Netw Open. 2019;2:e1912823. doi: 10.1001/jamanetworkopen.2019.12823. [DOI] [PMC free article] [PubMed] [Google Scholar]
- 15.Brooks GA, Kansagra AJ, Rao SR, et al. A clinical prediction model to assess risk for chemotherapy-related hospitalization in patients initiating palliative chemotherapy JAMA Oncol 1441–4472015 [DOI] [PMC free article] [PubMed] [Google Scholar]
- 16.Daly B, Gorenshteyn D, Nicholas KJ, et al. Building a clinically relevant risk model: Predicting risk of a potentially preventable acute care visit for patients starting antineoplastic treatment JCO Clin Cancer Inform 4275–2892020 [DOI] [PMC free article] [PubMed] [Google Scholar]
- 17.Brooks GA, Uno H, Aiello Bowles EJ, et al. Hospitalization risk during chemotherapy for advanced cancer: Development and validation of risk stratification models using real-world data JCO Clin Cancer Inform 31–102019 [DOI] [PMC free article] [PubMed] [Google Scholar]
- 18. Collins GS, Reitsma JB, Altman DG, et al. Transparent reporting of a multivariable prediction model for individual prognosis or diagnosis (TRIPOD): The TRIPOD statement. BMJ. 2015;350:g7594. doi: 10.1136/bmj.g7594. [DOI] [PubMed] [Google Scholar]
- 19.Hernandez-Boussard T, Bozkurt S, Ioannidis JPA, et al. MINIMAR (MINimum Information for Medical AI Reporting): Developing reporting standards for artificial intelligence in health care J Am Med Inform Assoc 272011–20152020 [DOI] [PMC free article] [PubMed] [Google Scholar]
- 20.Centers for Medicare & Medicaid Services . 2019 Chemotherapy Measure Updates and Specifications Report. Centers for Medicare & Medicaid; 2019. https://qualitynet.cms.gov/files/5e1227a1a69354001fa69c33?filename=2019_Chemo_AnnlUpdateRpt.pdf [Google Scholar]
- 21.Lowe HJ, Ferris TA, Hernandez PM, et al. STRIDE—An integrated standards-based translational research informatics platform AMIA Annu Symp Proc 2009391–3952009 [PMC free article] [PubMed] [Google Scholar]
- 22.Seneviratne MG, Bozkurt S, Patel MI, et al. Distribution of global health measures from routinely-collected PROMIS surveys in patients with breast cancer or prostate cancer Cancer 125943–9512019 [DOI] [PMC free article] [PubMed] [Google Scholar]
- 23.Azad AD, Yilmaz M, Bozkurt S, et al. Diverse patient trajectories during cytotoxic chemotherapy: Capturing longitudinal patient reported outcomes Cancer Med 105783–57932021 [DOI] [PMC free article] [PubMed] [Google Scholar]
- 24. Hays RD, Schalet BD, Spritzer KL, et al. Two-item PROMIS® global physical and mental health scales. J Patient Rep Outcomes. 2017;1:2. doi: 10.1186/s41687-017-0003-8. [DOI] [PMC free article] [PubMed] [Google Scholar]
- 25.Donzé JD, Lipsitz S, Schnipper JL.Risk factors and patterns of potentially avoidable readmission in patients with cancer J Oncol Pract 13e68–e762016 [DOI] [PubMed] [Google Scholar]
- 26.Gibson S, McConigley R.Unplanned oncology admissions within 14 days of non-surgical discharge: A retrospective study Support Care Cancer 24311–3172016 [DOI] [PubMed] [Google Scholar]
- 27.Mausbach BT, Irwin SA.Depression and healthcare service utilization in patients with cancer Psychooncology 261133–11392017 [DOI] [PMC free article] [PubMed] [Google Scholar]
- 28.Csik VP, Li M, Binder AF, et al. Development of an oncology acute care risk prediction model JCO Clin Cancer Inform 5266–2712021 [DOI] [PubMed] [Google Scholar]
- 29.Hong JC, Niedzwiecki D, Palta M, et al. Predicting emergency visits and hospital admissions during radiation and chemoradiation: An internally validated pretreatment machine learning algorithm JCO Clin Cancer Inform 21–112018 [DOI] [PubMed] [Google Scholar]
- 30. Seow H, Tanuseputro P, Barbera L, et al. Development and validation of a prognostic survival model with patient-reported outcomes for patients with cancer. JAMA Netw Open. 2020;3:e201768. doi: 10.1001/jamanetworkopen.2020.1768. [DOI] [PMC free article] [PubMed] [Google Scholar]
- 31.Warsame R, D'Souza A.Patient reported outcomes have arrived: A practical overview for clinicians in using patient reported outcomes in oncology Mayo Clin Proc 942291–23012019 [DOI] [PMC free article] [PubMed] [Google Scholar]
- 32.Ellis L, Canchola AJ, Spiegel D, et al. Trends in cancer survival by health insurance status in California from 1997 to 2014 JAMA Oncol 4317–3232018 [DOI] [PMC free article] [PubMed] [Google Scholar]
- 33.Blayney DW.Efficacy of Medicaid for patients with cancer in California JAMA Oncol 4323–3252018 [DOI] [PubMed] [Google Scholar]
- 34. Coquet J, Bievre N, Billaut V, et al. Assessment of a clinical trial-derived survival model in patients with metastatic castration-resistant prostate cancer. JAMA Netw Open. 2021;4:e2031730. doi: 10.1001/jamanetworkopen.2020.31730. [DOI] [PMC free article] [PubMed] [Google Scholar]
- 35.Bradley CJ, Gardiner J, Given CW, et al. Cancer, Medicaid enrollment, and survival disparities Cancer 1031712–17182005 [DOI] [PubMed] [Google Scholar]
- 36.Miesfeldt S, Murray K, Lucas L, et al. Association of age, gender, and race with intensity of end-of-life care for Medicare beneficiaries with cancer J Palliat Med 15548–5542012 [DOI] [PMC free article] [PubMed] [Google Scholar]
- 37.Obermeyer Z, Powers B, Vogeli C, et al. Dissecting racial bias in an algorithm used to manage the health of populations Science 366447–4532019 [DOI] [PubMed] [Google Scholar]
- 38.Handley NR, Schuchter LM, Bekelman JE.Best practices for reducing unplanned acute care for patients with cancer J Oncol Pract 14306–3132018 [DOI] [PMC free article] [PubMed] [Google Scholar]
- 39. Shepperd S, Doll H, Angus RM, et al. Admission avoidance hospital at home. Cochrane Database Syst Rev. 2008:CD007491. doi: 10.1002/14651858.CD007491. [DOI] [PMC free article] [PubMed] [Google Scholar]
- 40.Traeger L, McDonnell TM, McCarty CE, et al. Nursing intervention to enhance outpatient chemotherapy symptom management: Patient-reported outcomes of a randomized controlled trial Cancer 1213905–39132015 [DOI] [PubMed] [Google Scholar]
- 41.Nimako K, Lu S-K, Ayite B, et al. A pilot study of a novel home telemonitoring system for oncology patients receiving chemotherapy J Telemed Telecare 19148–1522013 [DOI] [PubMed] [Google Scholar]
- 42.Hong JC, Eclov NCW, Dalal NH, et al. System for high-intensity evaluation during radiation therapy (SHIELD-RT): A prospective randomized study of machine learning-directed clinical evaluations during radiation and chemoradiation J Clin Oncol 383652–36612020 [DOI] [PubMed] [Google Scholar]
- 43.Andersen SK, Croxford R, Earle CC, et al. Days at home in the last 6 months of life: A patient-determined quality indicator for cancer care J Oncol Pract 15e308–e3152019 [DOI] [PubMed] [Google Scholar]
Associated Data
This section collects any data citations, data availability statements, or supplementary materials included in this article.
Data Availability Statement
The analysis code for this study is available at https://github.com/dylan-peterson-95/predicting-preventable-admissions. As we are unable to share PHI, there are simulated data available in the repository with an example of how to generate model predictions.