

Abstract
Wilms tumour (WT), an embryonal kidney cancer, has been extensively characterised for genetic and epigenetic alterations, but a proportion of WTs still lack identifiable abnormalities. To uncover DNA methylation changes critical for WT pathogenesis, we compared the epigenome of foetal kidney with two WT cell lines, filtering our results to remove common cancer‐associated epigenetic changes and to enrich for genes involved in early kidney development. This identified four hypermethylated genes, of which ESRP2 (epithelial splicing regulatory protein 2) was the most promising for further study. ESRP2 was commonly repressed by DNA methylation in WT, and this occurred early in WT development (in nephrogenic rests). ESRP2 expression was reactivated by DNA methyltransferase inhibition in WT cell lines. When ESRP2 was overexpressed in WT cell lines, it inhibited cellular proliferation in vitro, and in vivo it suppressed tumour growth of orthotopic xenografts in nude mice. RNA‐seq of the ESRP2‐expressing WT cell lines identified several novel splicing targets. We propose a model in which epigenetic inactivation of ESRP2 disrupts the mesenchymal to epithelial transition in early kidney development to generate WT.
Keywords: DNA methylation, epigenetics, ESRP2, MET, Wilms tumour
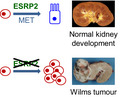
ESRP2 regulates alternative splicing events that are critical for the mesenchymal to epithelial transition (MET) that occurs during kidney development. We show that in Wilms tumour, ESRP2 is commonly inactivated by DNA methylation at an early stage of carcinogenesis. We propose that epigenetic inactivation of ESRP2 disrupts the regulation of alternative splicing during MET. Disrupted MET leads in turn to persistence of undifferentiated foetal kidney cells that may progress to a tumour.
Abbreviations
- ANOVA
analysis of variance
- Aza
5‐aza‐2’‐deoxycytidine
- BCH
Bristol Children’s Hospital
- DMEM
Dulbecco’s modified Eagle’s medium
- Dox
doxycycline
- FK
foetal kidney
- MCIP
methyl CpG immunoprecipitation
- MET
mesenchymal–epithelial transition
- NK
normal kidney
- NR
nephrogenic rest
- NT
normal tissue
- qPCR
quantitative real‐time PCR
- RMH
Royal Marsden Hospital
- RNA‐seq
RNA sequencing
- WT
Wilms tumour
1. Introduction
Wilms tumour (WT; nephroblastoma) is an embryonal kidney cancer [1, 2], which originates from foetal kidney (FK), due to the failure of the mesenchymal to epithelial transition (MET) that the metanephric blastema undergoes during early nephrogenesis. Premalignant lesions (nephrogenic rests; NRs) are often found as microscopic lesions in the normal kidney (NK) adjacent to WTs [3]. It is hypothesised that genetic and epigenetic defects occur during renal development that block MET, leading to the formation of NRs, some of which progress to WT [1, 2, 3].
The molecular events underlying WT pathogenesis involve an array of genetic and epigenetic defects [2]. The earliest genetic mutations in WT were found in the WT1 gene, which plays a critical role in regulating MET during nephrogenesis [2]. The Wnt pathway is also vital in renal development [2], and mutations in Wnt pathway components including CTNNB1 [4, 5] and WTX (AMER1) [6] have also been found in WT. Recent genome‐wide sequencing studies have identified mutations in microRNA‐processing genes, such as DROSHA, DICER and DGCR8, and mutations in other renal developmental regulators, including SIX1, SIX2 and SALL1 [7, 8, 9, 10, 11, 12]. Most of these events show no strong association with clinical outcome, but TP53 mutations are found in the rare anaplastic variant of WT, which has a much poorer prognosis than other subtypes [13].
Epigenetic alterations are also common in WT, especially at the 11p15 locus, where the frequent loss of imprinting of the foetal growth factor gene IGF2 is associated with DNA hypermethylation at H19 [14]. Other epigenetic alterations in WT include loss of imprinting at 11p13 involving imprinted WT1 transcripts [14, 15], global hypomethylation [16], DNA hypermethylation at individual tumour suppressor genes such as RASSF1A [16, 17, 18], and long‐range epigenetic silencing of the PCDHG@ gene clusters [19].
Despite the identification of many loci with genetic and/or epigenetic lesions in WT, a proportion of WTs still lack identifiable driver defects, implying that additional novel genes are involved in WT pathogenesis [7]. We previously used genome‐wide DNA methylation analysis to identify novel epigenetic lesions in WT [19], and here, we report further studies comparing WT cell lines to foetal kidney. We have identified novel differentially methylated genes, one of which is the alternative splicing regulator ESRP2 (epithelial splicing regulatory protein 2). ESRP2 is known to be important in epithelial to mesenchymal transitions and MET [20], suggesting that epigenetic deregulation of MET may be an important factor in WT development. We show that ESRP2 is frequently silenced by DNA hypermethylation in WT and that it acts as a tumour suppressor gene, regulating alternative splicing in novel genes, some of which affect pathways known to be important in kidney development.
2. Materials and methods
2.1. Ethical statement
WT samples were from Bristol Children’s hospital (BCH), or from collaborators at the Royal Marsden Hospital (RMH), as part of a UK collaboration. Samples were obtained with informed written consent (from parent and/or legal guardian for children less than 18 years old) and with appropriate ethical approval (E5797, Southwest – Central Bristol Research Ethics Committee (UK)). All methods were performed in accordance with the relevant regulations specified in the UK Human Tissue Act 2004. The study methodologies conformed to the standards set by the Declaration of Helsinki. All animal experiments and procedures were approved by the UK Home Office in accordance with the Animals (Scientific Procedures) Act 1986. Mice were maintained at the Biological Services Unit, University of Exeter, UK. Housing and handling of mice have been done according to the UK Home Office Code of Practice: https://assets.publishing.service.gov.uk/government/uploads/system/uploads/attachment_data/file/388895/COPAnimalsFullPrint.pdf.
2.2. Cell lines
WT cell lines Wit49 (a kind gift from Professor Herman Yeger, University of Toronto) [21] and 17.94 (established in our own laboratory; available from DSMZ (German Collection of Microorganisms and Cell Cultures), https://www.dsmz.de/dsmz) [22] were grown in Dulbecco’s modified Eagle’s medium (DMEM) with 10% FBS, 100 U·mL−1 penicillin, 0.1 mg·mL−1 streptomycin, and 2 mm l‐glutamine, at 37 °C in 5% CO2. WT cell line identity was confirmed by short tandem repeat analysis (Fig. S1).
The V200 and E200L cell lines were derived by transfecting Wit49 cells with the inducible expression vector pBIG2r [23], either empty (V200) or containing an ESRP2 cDNA insert (E200L). ESRP2 cDNA was amplified by PCR from IMAGE clone 4810948, using a forward primer containing a BamHI site and a reverse primer containing an EcoRV site plus a FLAG tag (Table S1), then ligated into BamHI/EcoRV‐digested pBIG2r (Fig. S2A). Transfected cells were selected and maintained in 50 µg·mL−1 hygromycin B (Santa Cruz Biotechnology). Only the ESRP2‐transfected Wit49 cells (E200L) expressed vector‐derived ESRP2 RNA (Fig. S2B). ESRP2 expression was induced with 2‐5 µg·mL−1 doxycycline (Dox, Sigma), with maximum ESRP2 protein expression at 72 to 96 h postinduction (Fig. S2C).
2.3. Transient transfection
WT cell lines Wit49 and 17.94 were seeded into 6‐well plates (2 × 10⁵ cells·well−1) and transfected with 1 µg plasmid expressing FLAG‐tagged Esrp1 or Esrp2, or empty vector (pIBX‐C‐FF‐B‐Esrp1/2 [24]), using FuGENE 6 (Promega), according to the manufacturer’s instructions. Transfected cells were selected with 2.5 µg·mL−1 blasticidin (Sigma) after three days, and after 5 days, adherent cells were trypsinised and counted.
2.4. Cell growth assays
For mass culture assays, cells were seeded into 6‐well plates (1 × 10⁶ cells·well−1) and treated with 2 µg·mL−1 doxycycline or DMSO vehicle control, with medium changes every 3 days. Cells were trypsinised and counted using a Countess Cell Counter and trypan blue stain to exclude dead cells.
For colony assays, cells were seeded into 6‐well plates (2 × 10⁵ cells·well−1) and treated with 2 µg·mL−1 doxycycline or DMSO vehicle control. Medium was changed every 3 days, and then at 14 days, cells were fixed, stained with methylene blue and colonies counted manually.
To monitor proliferation in real time, cells were seeded in 24‐well plates (5 × 10³ cells·well−1) and images were taken in four different fields per well every 2 h (IncuCyte ZOOM live cell imaging system; Essen BioScience) and phase confluence was calculated as a surrogate for growth.
2.5. Transwell assay
Cells were pretreated for 4 days with 2 µg·mL−1 doxycycline or control media and then seeded into Transwell inserts (2 × 10⁵ cells·insert−1 in FBS‐free DMEM; 8 µm pore, PET membrane; Falcon, 353093) in a 6‐well plate. Wells were filled with 1.7 mL 10% FBS in DMEM to produce a chemotactic gradient. After 24 h, inserts were washed and cells on underside of membrane were fixed and stained with crystal violet and counted manually using light microscopy.
2.6. Scratch assay
Cells were seeded into 24‐well plates (7.5 × 10⁵ cells·well−1) and treated with 2 µg·mL−1 doxycycline or DMSO vehicle control, prior to a scratch being performed manually in the centre of each well. Wells were washed with PBS to remove dead cells, control/doxycycline media replaced, and wells were analysed at 24 and 48 h via Widefield microscopy, using ImageJ software to determine percentage wound closure.
2.7. Cell Trace Violet (CTV) proliferation assay
1x10⁶ cells were incubated for 20 min at 37 °C in the dark in 1 mL of diluted CTV stain (Thermo Fisher; C34571; prepared according to manufacturer’s instructions), then staining was quenched using 10% FBS in DMEM, and cells were seeded into T12.5 flasks. Controls were made by fixing 3x10⁵ stained cells in 1% paraformaldehyde and stored at 4 °C in the dark. Seeded cells in T12.5 flasks were treated for 6 days with 2 µg·mL−1 doxycycline or control media, and intensity of CTV staining was analysed using a NovoCyte Flow Cytometer and flowjo software.
2.8. 5‐Aza‐2’‐deoxycytidine treatment
Cells were incubated in medium containing 2 µm 5‐aza‐2’‐deoxycytidine (Aza; Sigma, Gillingham, UK) or drug solvent (DMSO) for up to 6 days, with a medium change every 2 days.
2.9. Xenografting into nude mice
V200 and E200L cells were transduced with lentivirus expressing firefly luciferase (Amsbio LVP326), and transduced cells were selected with blasticidin, according to the manufacturer’s protocol. For orthotopic kidney implantation, male nude mice (2 months old; Charles River) were anaesthetised using isoflurane, an incision was performed in the left flank of the mice, the kidney was exteriorised and 3 × 10⁶ cells were injected. Mice were imaged twice weekly (Xenogen IVIS), following intraperitoneal injection with luciferin. When a bioluminescent signal above background was detected (demonstrating the establishment of tumour growth), mice were injected intraperitoneally with doxycycline three times/week (50 mg·kg−1 in 5% glucose). Mice were culled either when tumours grew to the maximum allowed size (10mm in diameter, according to the animal licence) or after two months of imaging. The sample size was determined by power calculations using existing data from similar experiments performed routinely in Dr Oltean’s lab. More specifically, the sample size was obtained to be able to see a significant difference (P > 0.05) for tumour growth with a power value of 0.80 (> 80%). We have used statistical principles and formulas available on the following websites: www.nc3rs.org.uk; http://www.statisticalsolutions.net/pss_calc.php. We have not done randomisation in the animal experiments, and there was no blinding of the investigator.
2.10. DNA extraction and methyl CpG immunoprecipitation (MCIP)
DNA was extracted from WT cell lines with a DNeasy kit (Qiagen, Manchester, UK). Human foetal kidney DNA was obtained from BioChain. MCIP was performed as described previously [25] by co‐hybridising methylation‐enriched DNA fractions with input DNA onto a custom microarray (NimbleGen), based on design 2006‐04‐28_HG18_Refseq_Promoter (see GEO entry for further details). Statistical analyses by ChIPMonk software (https://www.bioinformatics.babraham.ac.uk/projects/chipmonk/) used windowed t‐tests to identify differentially methylated genes (Table S2). MCIP data are accessible through GEO Series accession number GSE153047: https://www.ncbi.nlm.nih.gov/geo/query/acc.cgi?acc=GSE153047.
2.11. Pyrosequencing
DNA was purified by phenol/chloroform extraction, bisulphite converted (EZ DNA Methylation Gold kit; Zymo Research), amplified using a PyroMark PCR kit (Qiagen) and pyrosequenced on a PyroMark Q96 instrument (Qiagen), using primers listed in Table S3.
2.12. RNA extraction, cDNA synthesis and RT‐PCR
Total RNA was extracted using TriReagent (Sigma) and DNase treated with TURBO DNA‐free (Ambion, Gloucester, UK). Human foetal kidney RNA was obtained from BioChain. cDNA was synthesised using the Superscript IV RT‐PCR system (Invitrogen, Gloucester, UK). Gene‐specific primers (Table S1) were used for end‐point PCR (HotStarTaq Plus DNA Polymerase; Qiagen), to detect inclusion or exclusion of alternative exons, after electrophoresis on agarose gels (1.5%). Quantitative real‐time PCR (qPCR) using gene‐specific primers (Table S1) was performed using QuantiNova SYBR Green Mix (Qiagen) on an MX3000P real‐time PCR machine (Stratagene), normalising the amount of target gene to the endogenous level of TBP. Human universal RNA (Agilent) was used as a reference to standardise results between qPCR batches.
2.13. Protein extraction and western blotting
Cells were washed with ice‐cold PBS and lysed in cell lysis buffer (Cell Signaling, London, UK), with complete mini‐inhibitors (Roche) for 10 min on ice, and then sonicated for 5 min (Diagenode, Bioruptor). 25 µg proteins were separated on SDS/polyacrylamide gels and analysed by western blotting. Primary antibodies were against ESRP2 (rabbit, Abcam ab155227), FLAG (mouse, Sigma F3165) and β‐ACTIN (rabbit, Abcam AB8227), followed by secondary HRP‐labelled anti‐rabbit IgG (Sigma A6154) or anti‐mouse IgG (Sigma A9044). Chemiluminescence detection was with Lumiglo (KPL).
2.14. Immunofluorescence
Cells were grown on sterile glass slides, fixed for 30 min at room temperature in 1% paraformaldehyde in PBS, permeabilised for 10 min in 0.5% Triton X‐100 in PBS and finally rinsed in 50mM glycine in PBS. Fixed cells were stained using a primary antibody against FLAG (mouse, Sigma F3165) and secondary antibody against mouse IgG (Alexa Fluor 488‐labelled; Invitrogen) to detect transfected ESRP2, together with Alexa Fluor 594‐labelled phalloidin (Invitrogen) to detect actin. Antibodies were diluted in PBS + 1% bovine serum albumin, containing 0.1 µg·mL−1 DAPI to image nuclei. Slides were mounted in Fluoroshield (Sigma) and examined with a confocal microscope, acquiring eight images at 1 µm spacing/field. Maximum intensity projections were merged using ImageJ software (http://imagej.nih.gov/ij/).
2.15. RNA sequencing (RNA‐seq)
RNA was extracted from E200L cells 96 h after treatment with 2 µg·mL−1 doxycycline, or control solvent (DMSO), using an RNAeasy kit (Qiagen), then DNase treated, and quality confirmed using an Agilent ScreenTape RNA assay. Two biological replicates were used for RNA‐seq (i.e. four samples total). Sequencing libraries were prepared from total RNA (500 ng) using the TruSeq Stranded mRNA Library Preparation Kit (Illumina, Inc., Cambridge, UK) and uniquely barcoded adapters (RNA LT adapters, Illumina, Inc). Libraries were pooled equimolarly for sequencing, which was carried out on the NextSeq500 instrument (Illumina, Inc.) using the NextSeq High Output v2 150‐cycle kit (Illumina, Inc.). Approximately 300 million paired reads (passing filter, PF) were obtained, divided between the four experimental samples. NextSeq Control Software version 2.0.0 and RTA v2.4.6 were used for instrument control and primary analysis, respectively. Reads from the four samples were mapped to the human genome (hg19) using the new Tuxedo Suite of programs (HISAT2, StringTie, Ballgown; https://www.ncbi.nlm.nih.gov/pubmed/?term=27560171). To identify RNA splicing alterations, the four BAM files generated by HISAT2 were used as input for rMATS ([26] http://rnaseq‐mats.sourceforge.net/user_guide.htm). Bam files were viewed in the Integrative Genomics Viewer (http://software.broadinstitute.org/software/igv/) to produce Sashimi plots of alternative splicing. RNA‐seq data are accessible through GEO Series accession number GSE154496: https://www.ncbi.nlm.nih.gov/geo/query/acc.cgi?acc=GSE154496.
2.16. Statistical analysis
Comparisons of two datasets were performed using Student’s t‐test or a Mann–Whitney U‐test, depending on whether the data met the normal distribution. A comparison of three or more groups was performed using one‐way analysis of variance (ANOVA) with Dunnett’s post‐test or using Tukey’s pairwise test. The Chipmonk software used for MCIP analysis and the rMATS software used for RNA‐seq analysis use Benjamini and Hochberg FDR correction for multiple testing. For smaller numbers of samples, Bonferroni correction was used for multiple testing. Numbers of samples quoted in figure legends (n) refer to biological replicates. P < 0.05 was considered to indicate a statistically significant difference.
3. Results
3.1. Genome‐wide DNA methylation analysis
We used MCIP to identify 225 genes that were hypermethylated in two WT cell lines compared with foetal kidney (Fig. 1A and Table S2). Gene ontology analysis showed that these genes were particularly involved in chromatin organisation, developmental processes and transcriptional regulation (Fig. 1B and Table S4). To distinguish genes that were methylated specifically in WT, two filters were applied: (a) genes were removed that are polycomb repressive complex marked in embryonic stem cells, since such genes are predisposed to DNA methylation in a wide range of human cancers [27, 28, 29] and therefore might not be WT‐specific; (b) positive selection was applied for genes that are upregulated in early nephrogenesis, since their inactivation could induce the MET block that is critical for WT development [2]. Using these criteria, four candidate genes were pinpointed: CHST2, KIT, PTTG1IP and ESRP2 (also known as RBM35B) (Fig. 1A and Table S2), of which ESRP2 was the most consistently methylated in WT (Fig. 1C).
Fig. 1.
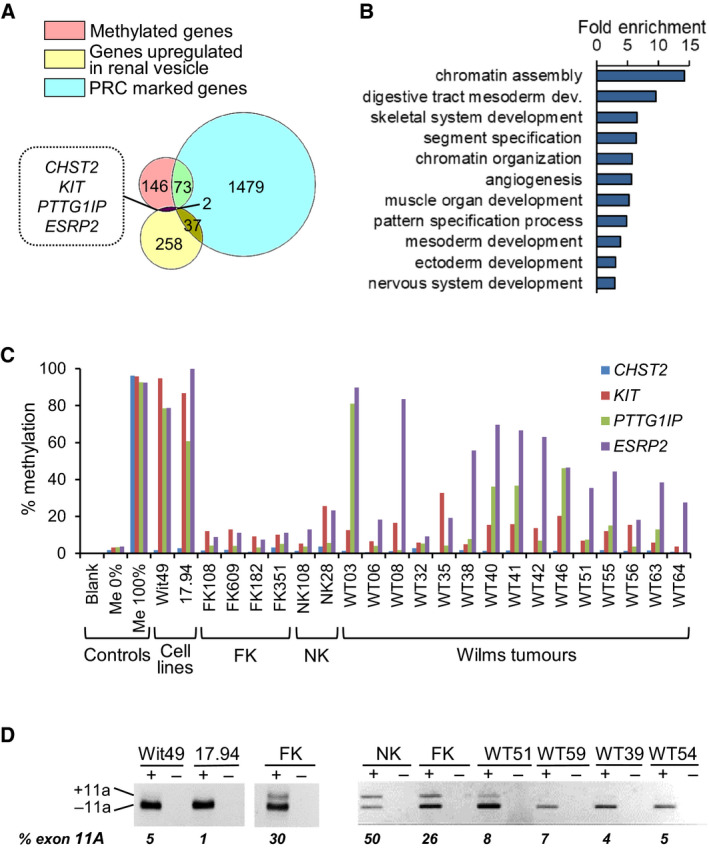
Identification of ESRP2 as a candidate hypermethylated gene. (A) Venn diagram showing filtering of the 225 methylated genes that were identified by methyl CpG immunoprecipitation (MCIP), firstly by negative selection for genes that are polycomb repressive complex (PRC) marked in embryonic stem cells and secondly by positive selection for genes that are upregulated in the renal vesicle during kidney development. The full list of methylated genes and filtered lists are shown in Table S2. dev., development. (B) Gene Ontology analysis of the 225 methylated genes. Only categories with a fold enrichment > 3 are shown; Table S4 for full results. (C) Bar chart of CHST2, KIT, PTTG1IP and ESRP2 DNA methylation. Controls (Blank, Me 0% (unmethylated DNA control), Me 100% (fully methylated DNA control)), Cell lines (Wilms tumour cell lines, n = 2), FK (foetal kidney, n = 4), NK (normal kidney, n = 2) and Wilms tumours (n = 15). DNA methylation was assayed by pyrosequencing; Table S3 for pyrosequencing primers. (D) Alternative splicing of ENAH exon 11A was analysed by RT‐PCR followed by agarose gel electrophoresis in 2 WT cell lines (Wit49 and 17.94), FK, NK and 4 WTs. Representative of n = 3.
ESRP2 was particularly attractive for further study, because of its known involvement in epithelial to mesenchymal transitions in cancer [30]. Support for a role in WT came from examination of the ESRP2 target ENAH. ESRP2 induces inclusion of the epithelial‐specific exon 11a in ENAH RNA transcripts [24]. Using RT‐PCR, less exon 11A was found expressed in WTs compared with normal kidney (NK) and foetal kidney (FK), consistent with downregulation of ESRP2 in WT (Fig. 1D). We therefore went onto examine DNA methylation and expression of ESRP2 in two large cohorts of WTs using pyrosequencing (Figs. S3 and S4).
3.2. DNA methylation of ESRP2 in Wilms tumour
The first cohort of WTs from Bristol Children’s Hospital (BCH) consisted of tumour samples of all stages, obtained at surgical resection, prechemotherapy. 72% of these WTs were hypermethylated at the ESRP2 (DNA methylation > 25%) compared with normal tissue (NT) (Fig. 2A and Fig. S4A). The second cohort from the Royal Marsden Hospital (RMH) were from stages 1 to 3, taken at surgical resection, postchemotherapy. In this different cohort, 78% of WTs were hypermethylated (Fig. 2B and Fig. S4C). ESRP1 DNA methylation was also tested in the RMH cohort and found to be very low (< 2%) in NT and WT, and not significantly different (Fig. 2B). Additional independent DNA methylation data were extracted for the ESRP1 and ESRP2 promoters from the data set GSE59157, which showed hypermethylation of ESRP2 in WTs, with much lower methylation of ESRP1, that was only marginally different between NT and WT (Fig. 2C). Thus, ESRP2 DNA was hypermethylated in three independent cohorts of WTs, but the ESRP2 paralog ESRP1 was not hypermethylated.
Fig. 2.
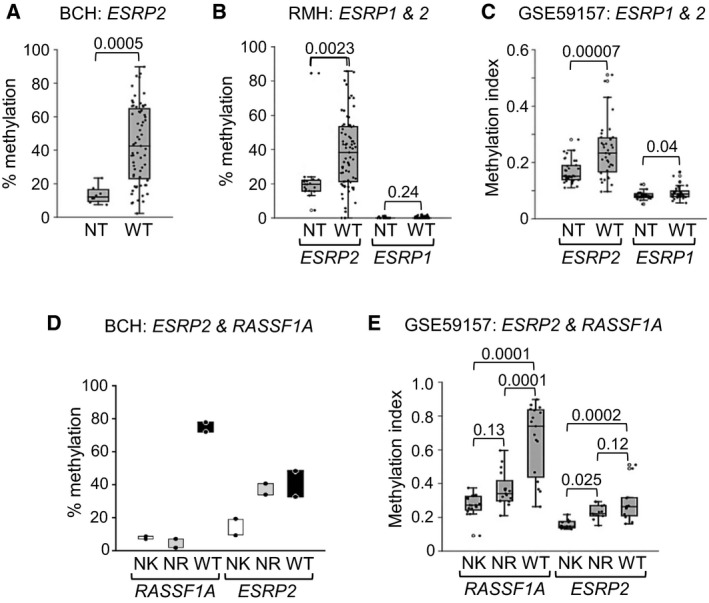
ESRP2 is hypermethylated in Wilms tumours and nephrogenic rests. (A) Dot‐boxplot of ESRP2 DNA methylation in the BCH cohort. NT (normal tissue) n = 8 (4 NK (normal kidney) and 4 FK (foetal kidney), WT (Wilms tumour) n = 65, P value from t‐test. (B) Dot‐boxplot of ESRP2 and ESRP1 DNA methylation in the RMH cohort. ESRP2: NT n = 18 (all NK), WT n = 73; ESRP1: NT n = 15 (all NK), WT n = 69, P values from t‐test. (C) Dot‐boxplot of ESRP2 and ESRP1 DNA methylation in dataset GSE59157. NT n = 36 (all NK), WT n = 37, P values from t‐test. (D) RASSF1A and ESRP2 methylation in nephrogenic rests in the BCH cohort. Two sets of matched NK, NR (nephrogenic rest) and WT are shown. (E) Dot‐boxplot of RASSF1A and ESRP2 methylation in nephrogenic rests in the GSE59157 data set. 17 sets of matched NK, NR and WT are shown for RASSF1A methylation and 13 sets for ESRP2 methylation, from individuals where the WT was hypermethylated compared with the matched NK. P values from Tukey’s pairwise test. DNA methylation was assayed by pyrosequencing in A to D and by Illumina Human Methylation 450 bead arrays in E.
There was no significant association between tumour stage and ESRP2 DNA methylation (Fig. S5A, B), nor between ESRP2 methylation and survival (Fig. S6), nor between tumour histology and ESRP2 methylation (Fig. S7A, C).
ESRP2 is located on chromosome 16q22, a chromosomal region showing frequent loss of heterozygosity (LOH) in WT [31]. No difference was observed in the ESRP2 methylation in WTs with or without 16q LOH (Fig. S5C).
Most WTs are thought to develop via premalignant lesions (NRs) [3]. To characterise the phase of WT development at which ESRP2 DNA methylation occurs, it was assayed in two sets of matched NK, NR and WT. ESRP2 was found to be at a similar level of hypermethylation in NRs and matched WTs compared with NKs (Fig. 2D). In contrast, RASSF1A, a tumour suppressor gene frequently hypermethylated in WT [18], was not hypermethylated in NRs (Fig. 2D), as previously reported [16]. Methylation values were also extracted for NRs from data set GSE59157, and similarly, ESRP2 was significantly more methylated in both NR and WT compared with NK (Fig. 2E), but RASSF1A was only hypermethylated in WTs and not NRs compared with NK (Fig. 2E).
To investigate whether epigenetic changes, including ESRP2 hypermethylation, are associated with other clinical and molecular features, the BCH cohort of WTs were grouped by hierarchical clustering of DNA methylation values at four loci: ESRP2, the WT1 antisense regulatory region [15], H19 [14] and RASSF1A [18] (Fig. S8 and Table S5). Interestingly, of the 22 WTs studied for WT1 mutations, all six WT1‐mutant WTs were in the same cluster (group 3), whereas ten of the WT1 wild‐type WTs were in group 1 or 2 and six in group 3 (P = 0.015, Fisher exact test). This difference in epigenetic profiles between WT1‐mutant and wild‐type WTs is supported by similar findings in a recent comprehensive characterisation of molecular defects in WT [7].
ESRP2 DNA hypermethylation was also observed in 10 of 16 (63%) non‐WT childhood renal tumours (Fig. S9A), especially in clear cell sarcomas of the kidney and in rhabdoid tumours. In data sets GSE73187 and GSE4487, ESRP2 was also found to be hypermethylated in clear cell sarcomas (Figs S9B, C) and rhabdoid tumours (Fig. S9C). Interestingly, examination of TCGA data showed DNA methylation changes in ESRP2 in several adult cancers, including hypermethylation in two adult kidney cancers (renal clear cell carcinoma and renal papillary cell carcinoma; Fig. S9D). This suggests that epigenetic inactivation of ESRP2 may be involved in the pathogenesis of several types of renal tumours in adults and children, not just in WT.
3.3. Expression of ESRP2 in Wilms tumour
In the BCH cohort, expression of ESRP2 in WT was very low compared with NT (Fig. 3A and Fig. S4B) and hypermethylation was associated with reduced expression of ESRP2 (Fig. 3B). In the RMH cohort, the expression of ESRP2 was also reduced in WT compared with NT (Fig. 3C and Fig. S4D), but ESRP1 expression was not significantly different (Fig. 3C). In data set GSE2712, ESRP2 expression was lower in WT compared with NT, but ESRP1 expression did not differ significantly (Fig. 3D). Like methylation results, there was no relationship between ESRP2 expression and tumour histology (Fig. S7B, D, E). These results showed that ESRP2 but not ESRP1 expression was reduced in WTs compared with NT and that reduced expression of ESRP2 was associated with hypermethylation. When the two WT cell lines were treated with the DNA methylation inhibitor 5‐aza‐2’‐deoxycytidine (Aza), there was a 5‐ to 10‐fold increase in ESRP2 RNA expression (Fig. 3E), suggesting a mechanistic link between ESRP2 methylation and gene expression.
Fig. 3.
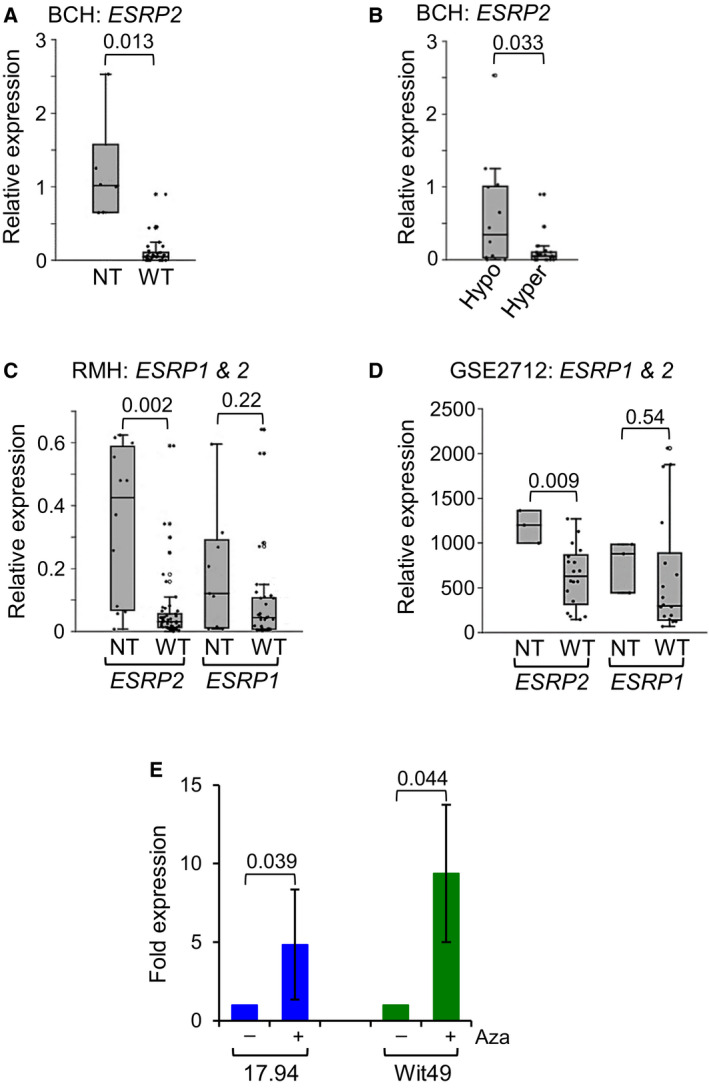
ESRP2 expression is repressed in Wilms tumour and regulated by DNA methylation. (A) Dot‐boxplot of ESRP2 RNA expression relative to FK (foetal kidney) in the BCH cohort. NT (normal tissue) n = 6 (3 NK (normal kidney) and 3 FK), WT (Wilms tumour) n = 32, P value from t‐test. (B) Dot‐boxplot of ESRP2 expression in hypomethylated versus hypermethylated samples in the BCH. Hypomethylated n = 14 (ESRP2 methylation< 25%, Hypo), hypermethylated n = 24 (ESRP2 methylation > 25%, hyper), P value from t‐test. (C) Dot‐boxplot of ESRP2 and ESRP1 RNA expression relative to NT in the RMH cohort. ESRP2: NT n = 12 (all NK), WT n = 51; ESRP1: NT n = 9 (all NK), WT n = 33, P values from t‐tests. (D) Dot‐boxplot of ESRP2 and ESRP1 RNA expression in the GSE2712 data set. NT n = 3 (all FK), WT n = 18, P values from t‐tests. (E) 17.94 and Wit49 WT cell lines were treated with 2 µm Aza (5‐aza‐2’‐deoxycytidine) for six days. ESRP2 RNA levels expressed relative to untreated cells. Results are mean ± SD of n = 3, P values from paired t‐tests. RNA expression was measured by real‐time qPCR, normalised to endogenous levels of TBP in A, B, C and E, and by Affymetrix Human Genome U133A arrays in D.
3.4. Biological function of ESRP2 in vitro
The results described above suggested that ESRP2 may have an important functional role in the development of WT. To carry out functional analyses, we initially used transient transfection to constitutively overexpress ESRP genes in WT cell lines 17.94 and Wit49. Overexpression of ESRP2, but not of ESRP1, produced strong growth inhibition in both cell lines (Fig. S10). Due to the strong growth inhibition by ESRP2, we were unable to establish stable cell lines using these constitutively active expression vectors. We therefore transfected the WT cell lines with an inducible ESRP2 expression vector (Fig. S2). Unfortunately, we were unable to establish a stable cell line from 17.94, but the WT cell line Wit49 was successfully transfected, producing the E200L cell line (V200 was the control cell line transfected with empty vector). E200L showed strong doxycycline‐induced expression of ESRP2 RNA (Fig. 4A) and protein (Fig. 4B), with the expected nuclear localisation of ESRP2 protein (Fig. 4D). Induction of ESRP2 drove the splicing of the known target gene ENAH [24] towards its epithelial splice form (+exon 11a; Fig. 4C), demonstrating that the construct produced biologically active ESRP2 in a WT cell line. There was slight leakiness from the expression vector, with more ESRP2 RNA detected in uninduced E200L cells compared with V200 cells (Fig. 4A), which probably explains the increased level of ENAH exon 11a in uninduced E200L cells compared with V200 cells (Fig. 4C).
Fig. 4.
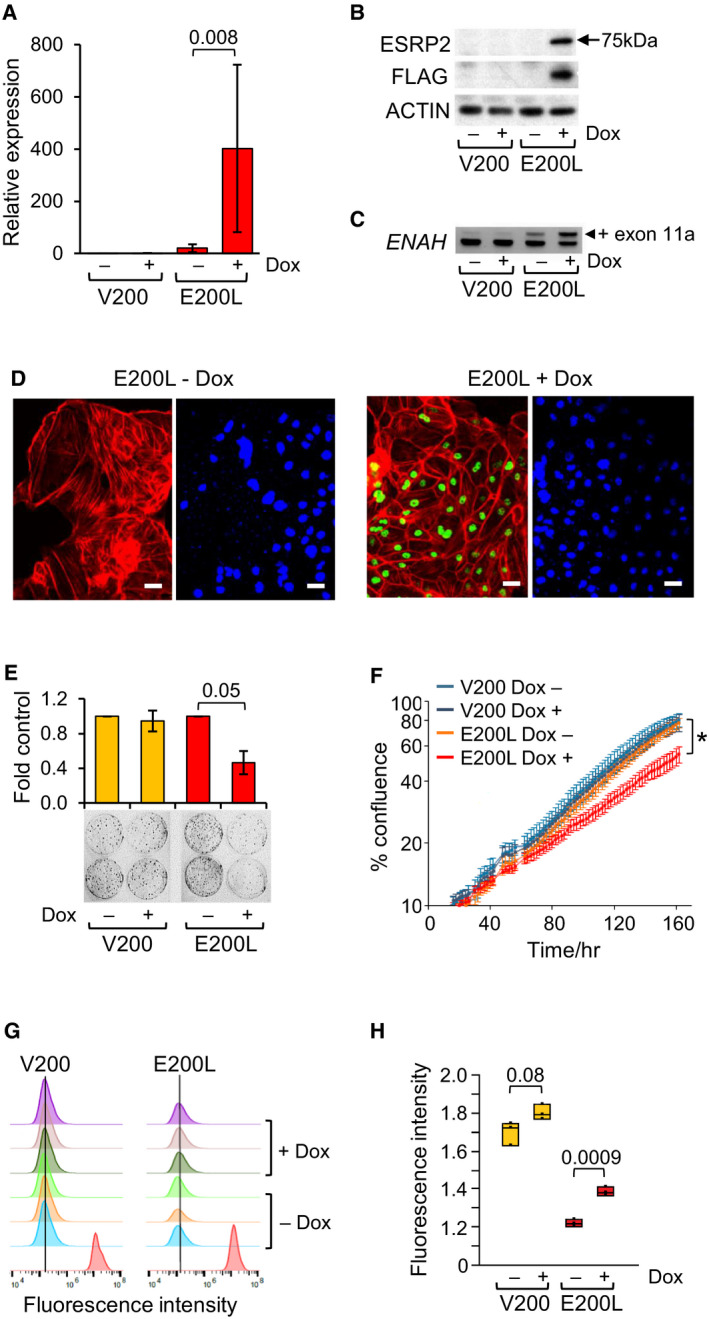
Inducible expression of ESRP2 in a Wilms tumour cell line. V200 is a control WT cell line (transfected with empty vector), and E200L is a WT cell line expressing doxycycline‐inducible ESRP2 (Materials and Methods). (A) ESRP2 RNA expression assayed by qPCR, normalised to endogenous levels of TBP, in V200 and E200L cells after 72‐h doxycycline (Dox) induction, shown as fold induction relative to uninduced V200 cells. Results are mean ±SD of n = 3, P value from paired t‐test. (B) ESRP2 protein assayed by western blotting in V200 and E200L cells after 72‐h doxycycline induction. Anti‐ESRP2 detected total ESRP2 protein, anti‐FLAG detected vector‐derived ESRP2 and anti‐ACTIN was used as a loading control. Representative of n = 3. (C) Alternative splicing of ENAH exon 11A was analysed by RT‐PCR followed by agarose gel electrophoresis to detect different sized amplicons, in V200 and E200L cells after 72‐h doxycycline induction. Representative of n = 3. (D) Immunofluorescence of E200L cells, stained for FLAG‐tagged ESRP2 (green) and ACTIN (red) in the left‐hand panels, and for nuclear DNA with DAPI (blue) in the right‐hand panels, after 72‐h doxycycline induction (+Dox), or uninduced (‐Dox). Scale bars = 50 µm. (E) Colony‐forming assay of induced (doxycycline‐treated) and uninduced V200 and E200L cells, shown as fold colony numbers compared to uninduced controls after 14 days. Results are mean ± SD of n = 3, P values from paired t‐test. (F) Cell confluence assay (by IncuCyte), showing growth of induced (doxycycline‐treated) and uninduced V200 and E200L cells. Results are mean ± SD of n = 6, P value at 162 h from paired t‐test. Representative of n = 3. (G) H: Cell trace violet (CTV) proliferation assay of induced (doxycycline‐treated) and uninduced V200 and E200L cells. (G) CTV staining of triplicates of induced and uninduced cells showing median fluorescence intensity histograms at 6 days of treatment. Red peaks are controls representing staining of cells at day zero. (H) Dot‐boxplot of quantitation of staining at 6 days (n = 3). P values from paired t‐tests of log‐transformed values.
Overexpression of ESRP2 was associated with an apparent redistribution of actin filaments towards the cell periphery (Fig. 4D), compared to a more cytoplasmic distribution of actin stress fibres in uninduced cells (Fig. 4D), as reported in other systems [32, 33].
ESRP2 overexpression caused decreased colony‐forming efficiency (Fig. 4E), as well as reduced growth rate in mass cultures (Fig. S11). Real‐time analysis of cell density showed a slower cell proliferation rate in the doxycycline‐induced E200L cells (Fig. 4F), associated with a small but significant decrease in the rate of cell division (Fig. 4G, H). Cell invasion (Fig. S12A) and cell motility (Fig. S12B) showed no changes upon induction of ESRP2 expression.
3.5. Xenograft assays of ESRP2 function in vivo
We used orthotopic xenografts of the Wit49‐derived cell lines, under the kidney capsule of nude mice [34] (Fig. 5), to examine the effect of ESRP2 expression in vivo. After treatment with doxycycline, tumours produced by V200 cells continued to proliferate, whilst tumours produced by E200L cells stopped growing, or regressed (Fig. 5A and Fig. S13A, B). V200 cells produced large tumours in four of five mice, but only one mouse out of five injected with E200L cells (1E‐L) produced a large tumour (Fig. 5B and Fig. S13C). Western blotting of excised tumours demonstrated that doxycycline treatment had induced high‐level ESRP2 expression in all E200L tumours, with the notable exception of 1E‐L (where the tumour grew larger) and V200‐induced tumours (Fig. 5C). This therefore demonstrated a strong correlation between ESRP2 expression and suppression of tumour growth.
Fig. 5.
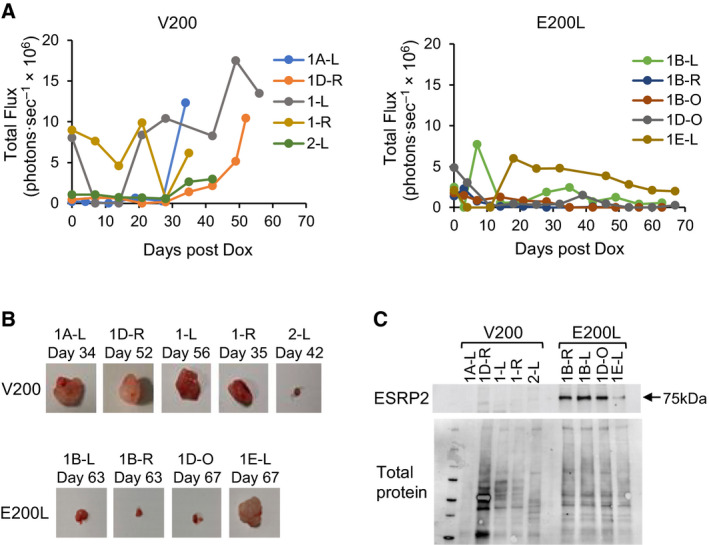
Tumorigenicity of ESRP2‐expressing WT cells. Orthotopic xenografts of V200 and E200L cells were produced by injecting cells under the kidney capsule of nude mice (n = 5 for each cell line). When a bioluminescent signal was detected above background (incipient growth of tumours), mice were injected intraperitoneally with doxycycline (Dox) three times per week, as described in Materials and Methods. (A) Time course of tumour growth as assayed by in vivo bioluminescence in V200 (left) and E200L (right) xenografts. Plots show tumour signals days after doxycycline induction (i.e. first doxycycline injection = day zero) for each individual mouse. Plot of the average of the bioluminescence traces is shown in Fig. S13A. (B) Tumours excised from mice (no tumour was excisable in mouse 1B‐0 at day 63, therefore only four E200L tumours are shown). Full details of tumour size and weight are shown in Fig. S13C. (C) Western blot of ESRP2 protein expression in excised tumours.
3.6. RNA‐seq analysis of alternative splicing in Wilms tumour cell lines
In biological duplicates, we carried out RNA‐seq on E200L cells that were doxycycline‐induced (ESRP2‐expressing) or uninduced (non‐expressing), obtaining between 70 and 80 million paired‐end reads per sample. These reads were mapped onto the human genome, examined for differential gene expression and used in rMATS software [26] to identify alternative splicing events.
Very few transcripts, apart from ESRP2, showed significant changes in RNA expression (P < 0.05, fold change > 2) when ESRP2 expression was induced (Fig. 6A, B). Interestingly, one induced gene was GRHL1, and grainyhead‐like transcription factors are important in both kidney development and MET [35], making them good candidates for an involvement in WT. However, we found no difference in expression of GRHL1 between NT and WT (Fig. S14), which does not support a role for altered GRHL1 expression in WT pathogenesis.
Fig. 6.
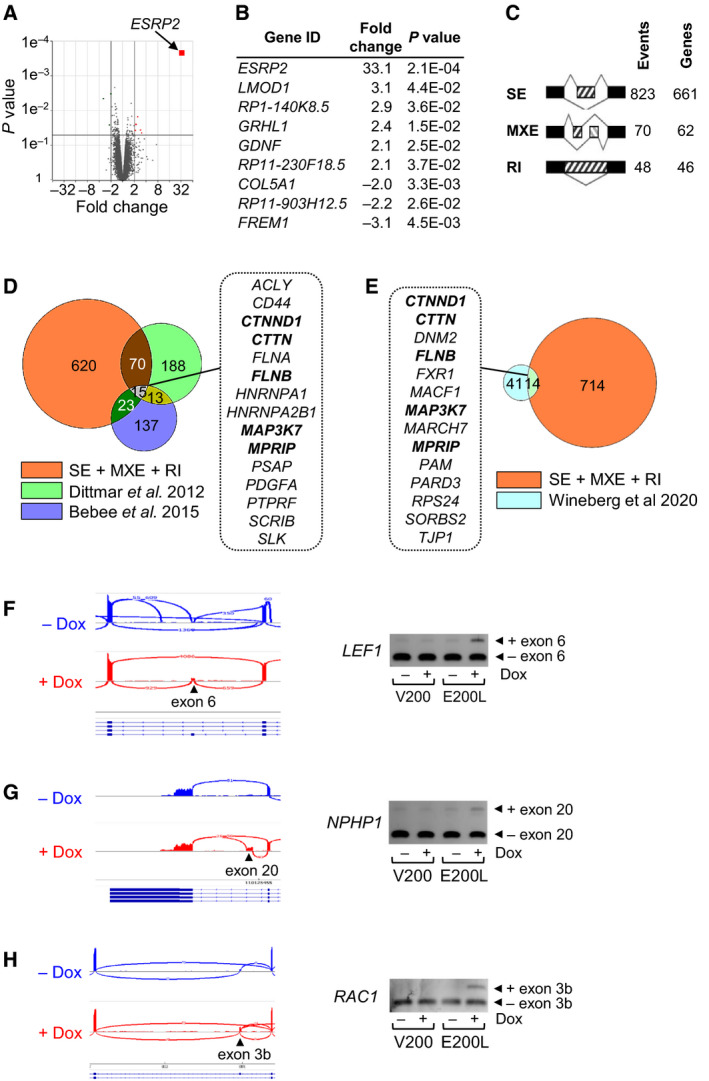
RNA‐seq analysis identifies ESRP2 targets in a WT cell line. RNA‐seq was performed on E200L cells with or without 96 h of doxycycline induction (to induce high‐level ESRP2 expression). (A) Volcano plot of P value versus fold induction of transcripts in ESRP2‐expressing E200L cells compared with non‐expressing cells. Genes induced > 2‐fold with P < 0.05 are indicated in red, and ESRP2 is labelled. (B) List of genes in A that were induced > 2‐fold with P < 0.05. (C) Number of altered splicing events and affected genes induced by ESRP2 expression. SE; skipped exons, MXE; mutually exclusive exons; RI, retained introns. Tables S6 to S8 for full details. (D) Venn diagram comparing genes identified in this study (SE + MXE + RI) with two other RNA‐seq analyses of ESRP‐induced splicing changes [36, 37]. (E) Venn diagram comparing genes identified in this study (SE + MXE + RI) with an RNA‐seq analysis of MET‐associated splicing changes in the developing kidney [38]. (F, G and H) Alternative splicing of novel targets LEF1 (F), NPHP1 (G) and RAC1 (H). Left‐hand panels: Sashimi plots of RNA‐seq data from E500L cells uninduced (‐Dox) or induced to express ESRP2 (+Dox). Right‐hand panels: Agarose gels of RT‐PCRs of amplicons spanning alternatively spliced exons (Table S1 for primers), in V200 and E200L cells, either uninduced, or doxycycline‐induced to produce high‐level ESRP2 expression in E200L cells.
In contrast to the lack of altered gene transcription, ESRP2 induction was associated with over 900 splicing events involving over 700 genes, with significant changes (false discovery rate, FDR < 0.05) in skipped exons, mutually exclusive exons and retained introns (Fig. 6C, Table S6, S7, and S8). The genes involved were particularly enriched for biological processes concerned with vesicular and intracellular transport (Table S9). Although we found many ESRP target genes in common with other reports [36, 37], we also identified over 600 novel target genes (Fig. 6D). Comparison with a recent study of MET‐associated alternative splicing changes during kidney development [38] also revealed overlap with some of our target genes (Fig. 6E). Interestingly, the two lists of genes identified as overlapping our ESRP2 targets, included five genes (33–36%) in common (CTNND1, CTTN, FLNB, MAP3K7 and MPRIP; shown in bold in Fig. 6D, E), emphasising the importance of ESRP‐regulated alternative splicing in kidney development.
We validated a selection of putative targets by specific RT‐PCR assays, to examine exon inclusion upon ESRP2 induction. We successfully validated several previously identified targets; CD44, ENAH, FGFR2, SCRIB and SLK (Fig. S15), as well as the novel targets LEF1, NPHP1 and RAC1 (Fig. 6F, G, H). However, some putative target genes showed no altered splicing after ESRP2 induction (Fig. S16 and Table S10).
To investigate the possible role of ESRP2 target genes in WT pathogenesis, we examined alternative splicing of 12 genes (seven novel and five previously described) in FK, NK and WT (Fig. 7 and Fig. S17). Five genes (42%) showed significant changes in the degree of alternative splicing between normal tissues and WT (Fig. 7), and seven (58%) did not (Fig. S17, Table S10).
Fig. 7.
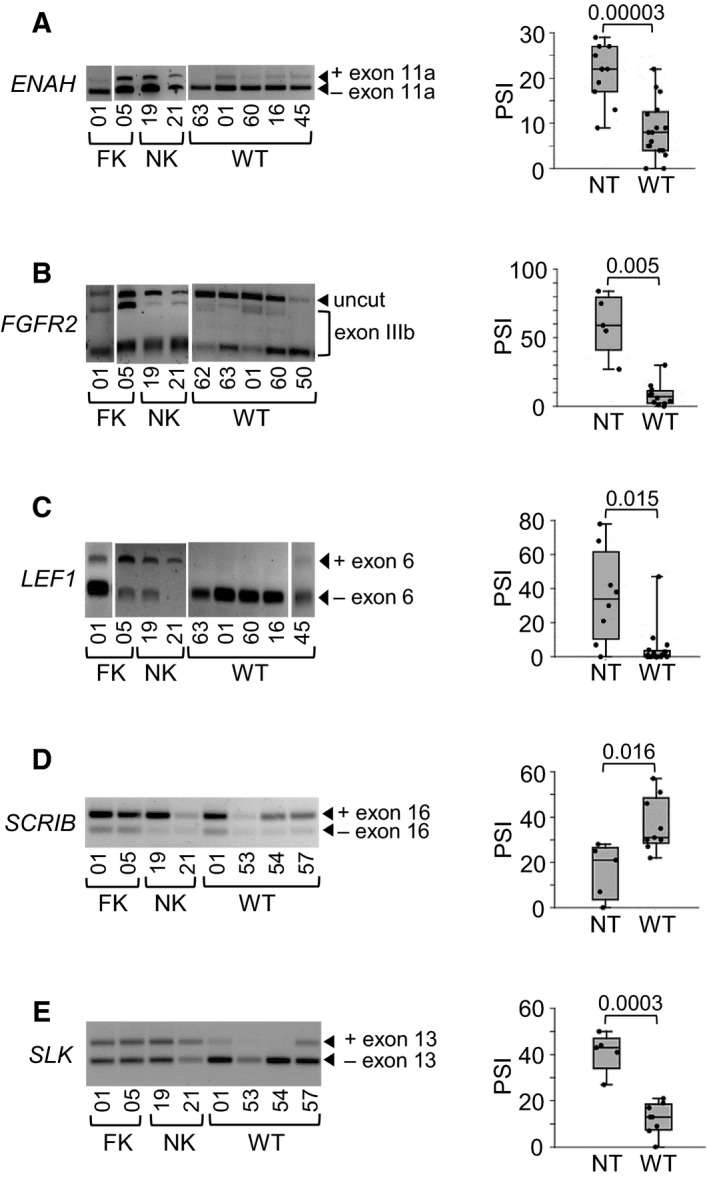
Alternative splicing of ESRP2 target genes in Wilms tumour. (A to E) Left‐hand panels: Representative agarose gels of RT‐PCRs of amplicons spanning the alternatively spliced exons (Table S1 for primers), from FK (foetal kidney), NK (normal kidney) and WT (Wilms tumour). FGFR2 exon IIIb was detected by restriction digest with AvaI [24]. Right‐hand panels: Dot‐boxplots showing per cent splice inclusion (PSI) in NT (normal tissue) and WT. P values from t‐test. ENAH (A), NT n = 11 (4 FK and 7 NK), WT n = 17; FGFR2 (B), NT n = 5 (3 FK and 2 NK), WT n = 12; LEF1 (C), NT n = 8 (5 FK and 3 NK), WT n = 17; SCRIB (D), NT n = 5 (2 FK and 3 NK), WT n = 9; SLK (E), NT n = 5 (2 FK and 3 NK), WT n = 8.
4. Discussion
This is the first demonstration of ESRP2 repression caused by DNA hypermethylation in WT, which implicates RNA splicing alterations as an important pathogenic factor in WT development. Investigation of matched sets of NK, NR and WT (Fig. 2D, E) suggested that inactivation of ESRP2 by DNA methylation occurs at an early stage in kidney development, prior to NR formation. We propose that ESRP2 is essential for the differentiation of the metanephric blastema into nephrons (Fig. 8B) and that loss of ESRP2 expression causes a differentiation block, initiating NRs, that can undergo further genetic and epigenetic defects to produce WT (Fig. 8C). Support for this model comes from studies showing that the Esrp paralogs are expressed in the developing kidney [39], with increased expression of Esrp 1 and 2 when renal precursors undergo epithelial differentiation [38], and that knockout of Esrp genes in mice decreases kidney volume, due to a lack of nephrons [40].
Fig. 8.
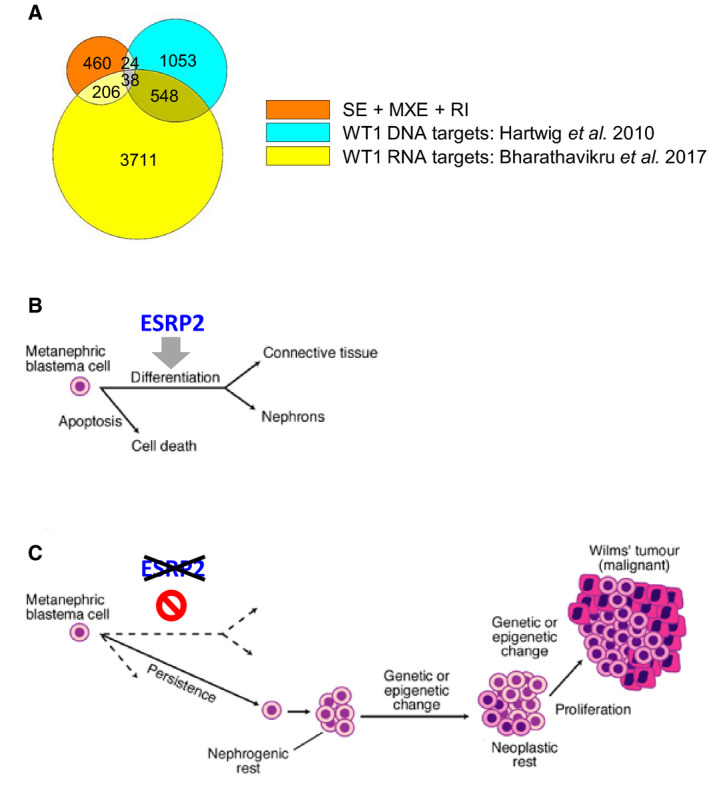
ESRP2 action in Wilms tumour. (A) Venn diagram comparing the 728 unique genes identified in this study (SE + MXE + RI, skipped exons; mutually exclusive exons and retained introns; Fig. 6) with 1663 WT1 DNA‐binding targets identified by chromatin immunoprecipitation in developing kidney [50] and 4503 WT1 RNA‐binding targets (protein‐coding genes) identified by RNA immunoprecipitation in M15 mesonephric cells [51]. (B) ESRP2 may be required for epithelial differentiation, to form nephrons during kidney development. (C) Loss of ESRP2 function by hypermethylation may inhibit normal differentiation and therefore promote persistence of undifferentiated blastema, leading to nephrogenic rest formation and eventual progression to Wilms tumour. B and C adapted from Fig. 2 in reference [1].
Inactivation of ESRP2 as an early premalignant event in WT development probably explains why we found no association with clinical features (Figs S5 and S6). It also explains why we found no association between ESRP2 methylation and LOH at 16q (Fig. S5C), where the ESRP2 gene is located, because we have previously demonstrated that 16q LOH occurs after NR formation [14], that is after ESPR2 hypermethylation.
We have shown that ESRP1, though an ESRP2 paralogue, is not repressed by hypermethylation in WTs (Fig. 2B, C and Fig. 3C, D). This implies that ESRP1 and ESRP2 may have different biological functions and are regulated differently in some instances, as recently reported in prostate cancer, where ESRP2 but not ESRP1 is regulated by androgens [41].
Splicing alterations are frequent in human cancers [42], including ESRP‐induced changes in breast cancer [33, 43], prostate cancer [41, 44], renal cell carcinoma [45] and colorectal cancer [46]. Most studies have reported expression changes without finding underlying genetic or epigenetic defects in the ESRP genes themselves [33, 41, 43, 45, 46]. However, there are reports of genetic defects in ESRP genes in human cancers, specifically, microsatellite indels [47] or duplications [44] of ESRP1. In addition, there are reports of DNA methylation changes in ESRP1 in prostate cancer [48] and of ESRP2 in breast cancer [49], and our examination of TCGA data (Fig. S9D) demonstrated ESRP2 methylation changes in several other adult cancer types. Thus, our results add to a growing body of evidence that ESRP genes can be either genetically or epigenetically deregulated in a wide range of human cancers.
Our functional studies suggested that the main biological effect of ESRP2 is to regulate cell proliferation by slowing cell division (Fig. 4E–H and Fig. S11). Whilst we observed some actin cytoskeleton rearrangement (Fig. 4D), we did not observe significant expression changes in classical epithelial marker genes (Fig. 6A, B), nor any changes in cell motility or invasion (Fig. S12), unlike what occurs when ESRP expression is modulated in adult human cancer cell lines [30, 32, 33]. Coupled with our xenograft experiments that identify ESRP2 as a bona fide tumour suppressor gene (Fig. 5), these results suggest that the tumour suppressor activity of ESRP2 in WT cell lines occurs mainly by altering cell growth properties, rather than by affecting cellular differentiation.
Mechanistically, our RNA‐seq results demonstrated that ESRP2 modulated the splicing of a diverse range of genes, including both well‐established and novel targets (Fig. 6 and Tables S6 to S8). A subset of these genes showed reduced expression of their epithelial splice forms in WT (Fig. 7), consistent with DNA hypermethylation‐induced downregulation of ESRP2 in WT (Fig 2 and Fig. 3). Interestingly, of the 728 genes that we identified as having their splicing modulated by ESRP2 (Fig. 6), only 62 (9%) are WT1 DNA‐binding targets [50], whereas 244 (34%) are WT1 RNA‐binding targets [51] (Fig. 8A). The WT1 RNA‐binding targets include all five of the ESRP2‐regulated genes that we found in common between our results and two other RNA‐seq studies (Fig. 6D, E). This suggests that WT1 and ESRP2 are involved in the post‐transcriptional regulation of a similar set of genes during renal development. Since ESRP2 hypermethylation is an early event, like WT1 mutation [52, 53], this suggests that ESRP2 hypermethylation may be another important early event in WT development, which contributes to WT pathogenesis by inhibiting MET (Fig. 8C). These results, together with genetic evidence showing defects in miRNA‐processing genes in WT [8, 9, 10, 11, 12], reinforce the critical role that post‐transcriptional gene regulation plays in WT pathogenesis.
5. Conclusions
Our genome‐wide DNA methylation analysis of WT has identified ESRP2 as a novel differentially methylated gene. ESRP2 was frequently silenced by DNA hypermethylation in WT, and this occurred early in WT development (in nephrogenic rests). ESRP2 inhibited cellular proliferation in vitro, and in vivo it suppressed tumour growth of orthotopic xenografts in nude mice, demonstrating that ESRP2 acts as a tumour suppressor gene in WT. Using RNA‐seq of the ESRP2‐expressing WT cell lines, we have identified several novel splicing targets, some of which affect pathways known to be important in kidney development. We propose that epigenetic inactivation of ESRP2 disrupts the regulation of alternative splicing during the mesenchymal to epithelial transition in early kidney development, to generate WT.
Conflict of interest
The authors declare no conflict of interest.
Author contributions
DL carried out the RNA‐seq, target validation and other experimental work; LL performed the animal experiments; WM carried out pyrosequencing, qPCR and derived the inducible cell line; D Lee performed the bioinformatic analysis of the RNA‐seq data; MS performed the MCIP DNA methylation analysis; AZ, LP and WYC performed DNA methylation and expression analyses on cell lines and tumours; YA and JB validated putative ESRP2 targets; RW and KPJ provided tumour samples and clinical data; KTAM help devise the methylation analysis strategy; SO planned experiments, especially the animal work; and KWB wrote the paper, planned work and carried out some experimental work. All authors viewed the manuscript and were given the opportunity to comment on it.
Peer Review
The peer review history for this article is available at https://publons.com/publon/10.1002/1878‐0261.13101.
Supporting information
Fig. S1. Cell line STR profiles.
Fig. S2. ESRP2 inducible expression construct.
Fig. S3. ESRP2 methylation detected by MCIP.
Fig. S4. ESRP2 methylation and RNA expression in Wilms tumours from two cohorts.
Fig. S5. ESRP2 DNA methylation in Wilms tumours of different stages and 16q LOH status.
Fig. S6. Overall survival in Wilms tumour patients with different levels of ESRP2 methylation.
Fig. S7. ESRP2 methylation and expression in Wilms tumours of different histological subtypes.
Fig. S8. Hierarchical clustering of Wilms tumours by DNA methylation.
Fig. S9. ESRP2 methylation in other childhood renal tumours and adult cancers.
Fig. S10. Transient transfection of Wilms tumour cells with Esrp1 and Esrp2.
Fig. S11. Growth of Wit49 transfected cells.
Fig. S12. Motility assays of Wit49 transfected cells.
Fig. S13. Mouse tumorigenicity data.
Fig. S14. GRHL1 RNA expression.
Fig. S15. Successfully validated putative ESRP2 target genes.
Fig. S16. Unsuccessfully validated putative ESRP2 target genes.
Fig. S17. Alternative splicing of putative ESRP2 target genes in normal kidney and Wilms tumour.
Table S1. Oligonucleotide primers used for PCR.
Table S2. MCIP hits and filtering.
Table S3. Pyrosequencing assays.
Table S4. MCIP hits GO analysis.
Table S5. Properties of tumours used in Fig. S8.
Table S6. Skipped exons (SE) identified with rMATs.
Table S7. Mutually exclusive exons (MXE) identified with rMATS.
Table S8. Retained introns (RI) identified with rMATS.
Table S9. GO analysis of all genes identified with rMATS from RNA‐seq data; Mutually exclusive exons (MXE), Retained introns (RI) and Skipped exons (SE).
Table S10. Putative ESRP2 targets.
Acknowledgments
The authors thank Professor Herman Yeger (University of Toronto) for the gift of the Wit49 cell line; Prof Russ Carstens (University of Pennsylvania) for the Esrp1/2 plasmids; Dr Madhu Kollareddy for the STR profile of Wit49; the Bristol Genetics Laboratory, Southmead Hospital, for help with pyrosequencing; Dr Paul Bishop for advice about immunofluorescence; Dr. Andrew Herman and Lorena Sueiro Ballesteros for the flow cytometry; and the University of Bristol Genomics Facility for the RNA sequencing work. This work was funded by the Children’s Cancer and Leukaemia Group / Little Princess Trust Project Grant programme (award reference: CCLGA 2017 11), Children with Cancer UK (code: 2012/135), CLIC Sargent UK and the John James Bristol Foundation.
Contributor Information
Sebastian Oltean, Email: s.oltean@exeter.ac.uk.
Keith W. Brown, Email: keith.brown@bristol.ac.uk.
Data accessibility
Supporting data are available in the supplementary material of this article [Figs S1 to S17, and Tables S1 to S10]. The genome‐wide DNA methylation (MCIP) data that support the findings of this study are openly available in NCBI's Gene Expression Omnibus and are accessible through https://www.ncbi.nlm.nih.gov/geo/query/acc.cgi?acc=GSE153047, GEO Series accession number GSE153047. The RNA‐seq data that support the findings of this study are openly available in NCBI's Gene Expression Omnibus and are accessible through https://www.ncbi.nlm.nih.gov/geo/query/acc.cgi?acc=GSE154496, GEO Series accession number GSE154496.
REFERENCES
- 1. Brown KW & Malik KT (2001) The molecular biology of Wilms tumour. Expert Rev Mol Med 2001, 1–16. [DOI] [PubMed] [Google Scholar]
- 2. Hohenstein P, Pritchard‐Jones K & Charlton J (2015) The yin and yang of kidney development and Wilms' tumors. Genes Dev 29, 467–482. [DOI] [PMC free article] [PubMed] [Google Scholar]
- 3. Beckwith JB (1998) Nephrogenic rests and the pathogenesis of Wilms tumor: Developmental and clinical considerations. Am J Med Genet 79, 268–273. [DOI] [PubMed] [Google Scholar]
- 4. Koesters R, Ridder R, Kopp‐Schneider A, Betts D, Adams V, Niggli F, Briner J & Von Knebel DM (1999) Mutational activation of the beta‐catenin proto‐oncogene is a common event in the development of Wilms' tumors. Cancer Res 59, 3880–3882. [PubMed] [Google Scholar]
- 5. Maiti S, Alam R, Amos CI & Huff V (2000) Frequent association of beta‐catenin and WT1 mutations in Wilms tumors. Cancer Res 60, 6288–6292. [PubMed] [Google Scholar]
- 6. Rivera MN, Kim WJ, Wells J, Driscoll DR, Brannigan BW, Han M, Kim JC, Feinberg AP, Gerald WL, Vargas SO et al. (2007) An X chromosome gene, WTX, is commonly inactivated in Wilms tumor. Science 315, 642–645. [DOI] [PubMed] [Google Scholar]
- 7. Gadd S, Huff V, Walz AL, Ooms A, Armstrong AE, Gerhard DS, Smith MA, Auvil JMG, Meerzaman D, Chen QR et al. (2017) A Children's Oncology Group and TARGET initiative exploring the genetic landscape of Wilms tumor. Nat Genet 49, 1487–1494. [DOI] [PMC free article] [PubMed] [Google Scholar]
- 8. Rakheja D, Chen KS, Liu Y, Shukla AA, Schmid V, Chang TC, Khokhar S, Wickiser JE, Karandikar NJ, Malter JS et al. (2014) Somatic mutations in DROSHA and DICER1 impair microRNA biogenesis through distinct mechanisms in Wilms tumours. Nat Commun 2, 4802. [DOI] [PMC free article] [PubMed] [Google Scholar]
- 9. Torrezan GT, Ferreira EN, Nakahata AM, Barros BD, Castro MT, Correa BR, Krepischi AC, Olivieri EH, Cunha IW, Tabori U et al. (2014) Recurrent somatic mutation in DROSHA induces microRNA profile changes in Wilms tumour. Nat Commun 5, 4039. [DOI] [PMC free article] [PubMed] [Google Scholar]
- 10. Walz AL, Ooms A, Gadd S, Gerhard DS, Smith MA, Guidry Auvil JM, Meerzaman D, Chen QR, Hsu CH, Yan C et al. (2015) Recurrent DGCR8, DROSHA, and six homeodomain mutations in favorable histology wilms tumors. Cancer Cell 27, 286–297. [DOI] [PMC free article] [PubMed] [Google Scholar]
- 11. Wegert J, Ishaque N, Vardapour R, Georg C, Gu Z, Bieg M, Ziegler B, Bausenwein S, Nourkami N, Ludwig N et al. (2015) Mutations in the SIX1/2 Pathway and the DROSHA/DGCR8 miRNA Microprocessor Complex Underlie High‐Risk Blastemal Type Wilms Tumors. Cancer Cell 27, 298–311. [DOI] [PubMed] [Google Scholar]
- 12. Wu MK, Sabbaghian N, Xu B, Addidou‐Kalucki S, Bernard C, Zou D, Reeve AE, Eccles MR, Cole C, Choong CS et al. (2013) Biallelic DICER1 mutations occur in Wilms tumours. J Pathol 230, 154–164. [DOI] [PubMed] [Google Scholar]
- 13. Bardeesy N, Falkoff D, Petruzzi MJ, Nowak N, Zabel B, Adam M, Aguiar MC, Grundy P, Shows T & Pelletier J (1994) Anaplastic Wilms' tumour, a subtype displaying poor prognosis, harbours p53 gene mutations. Nat Genet 7, 91–97. [DOI] [PubMed] [Google Scholar]
- 14. Brown KW, Power F, Moore B, Charles AK & Malik KT (2008) Frequency and timing of loss of imprinting at 11p13 and 11p15 in Wilms' tumor development. Mol Cancer Res 6, 1114–1123. [DOI] [PubMed] [Google Scholar]
- 15. Malik K, Salpekar A, Hancock A, Moorwood K, Jackson S, Charles A & Brown KW (2000) Identification of differential methylation of the WT1 antisense regulatory region and relaxation of imprinting in Wilms' tumor. Cancer Res 60, 2356–2360. [PubMed] [Google Scholar]
- 16. Ehrlich M, Jiang G, Fiala E, Dome JS, Yu MC, Long TI, Youn B, Sohn OS, Widschwendter M, Tomlinson GE et al. (2002) Hypomethylation and hypermethylation of DNA in Wilms tumors. Oncogene 21, 6694–6702. [DOI] [PubMed] [Google Scholar]
- 17. Morris MR, Hesson LB, Wagner KJ, Morgan NV, Astuti D, Lees RD, Cooper WN, Lee J, Gentle D, Macdonald F et al. (2003) Multigene methylation analysis of Wilms' tumour and adult renal cell carcinoma. Oncogene 22, 6794–6801. [DOI] [PubMed] [Google Scholar]
- 18. Wagner KJ, Cooper WN, Grundy RG, Caldwell G, Jones C, Wadey RB, Morton D, Schofield PN, Reik W, Latif F et al. (2002) Frequent RASSF1A tumour suppressor gene promoter methylation in Wilms' tumour and colorectal cancer. Oncogene 21, 7277–7282. [DOI] [PubMed] [Google Scholar]
- 19. Dallosso AR, Hancock AL, Szemes M, Moorwood K, Chilukamarri L, Tsai HH, Sarkar A, Barasch J, Vuononvirta R, Jones C et al. (2009) Frequent long‐range epigenetic silencing of protocadherin gene clusters on chromosome 5q31 in Wilms' tumor. PLoS Genet 5, e1000745. [DOI] [PMC free article] [PubMed] [Google Scholar]
- 20. Warzecha CC & Carstens RP (2012) Complex changes in alternative pre‐mRNA splicing play a central role in the epithelial‐to‐mesenchymal transition (EMT). Semin Cancer Biol 22, 417–427. [DOI] [PMC free article] [PubMed] [Google Scholar]
- 21. Alami J, Williams BR & Yeger H (2003) Derivation and characterization of a Wilms' tumour cell line, WiT 49. Int J Cancer 107, 365–374. [DOI] [PubMed] [Google Scholar]
- 22. Brown KW, Charles A, Dallosso A, White G, Charlet J, Standen GR & Malik K (2012) Characterization of 17.94, a novel anaplastic Wilms' tumor cell line. Cancer Genet 205, 319–326. [DOI] [PubMed] [Google Scholar]
- 23. Strathdee CA, McLeod MR & Hall JR (1999) Efficient control of tetracycline‐responsive gene expression from an autoregulated bi‐directional expression vector. Gene 229, 21–29. [DOI] [PubMed] [Google Scholar]
- 24. Warzecha CC, Sato TK, Nabet B, Hogenesch JB & Carstens RP (2009) ESRP1 and ESRP2 Are Epithelial Cell‐Type‐Specific Regulators of FGFR2 Splicing. Mol Cell 33, 591–601. [DOI] [PMC free article] [PubMed] [Google Scholar]
- 25. Charlet J, Tomari A, Dallosso AR, Szemes M, Kaselova M, Curry TJ, Almutairi B, Etchevers HC, McConville C, Malik KT et al. (2017) Genome‐wide DNA methylation analysis identifies MEGF10 as a novel epigenetically repressed candidate tumor suppressor gene in neuroblastoma. Mol Carcinog 56, 1290–1301. [DOI] [PMC free article] [PubMed] [Google Scholar]
- 26. Shen S, Park JW, Huang J, Dittmar KA, Lu ZX, Zhou Q, Carstens RP & Xing Y (2012) MATS: a Bayesian framework for flexible detection of differential alternative splicing from RNA‐Seq data. Nucleic Acids Res 40, e61. [DOI] [PMC free article] [PubMed] [Google Scholar]
- 27. Ohm JE, McGarvey KM, Yu X, Cheng L, Schuebel KE, Cope L, Mohammad HP, Chen W, Daniel VC, Yu W et al. (2007) A stem cell‐like chromatin pattern may predispose tumor suppressor genes to DNA hypermethylation and heritable silencing. Nat Genet 39, 237–242. [DOI] [PMC free article] [PubMed] [Google Scholar]
- 28. Schlesinger Y, Straussman R, Keshet I, Farkash S, Hecht M, Zimmerman J, Eden E, Yakhini Z, Ben‐Shushan E, Reubinoff BE et al. (2007) Polycomb‐mediated methylation on Lys27 of histone H3 pre‐marks genes for de novo methylation in cancer. Nat Genet 39, 232–236. [DOI] [PubMed] [Google Scholar]
- 29. Widschwendter M, Fiegl H, Egle D, Mueller‐Holzner E, Spizzo G, Marth C, Weisenberger DJ, Campan M, Young J, Jacobs I et al. (2007) Epigenetic stem cell signature in cancer. Nat Genet 39, 157–158. [DOI] [PubMed] [Google Scholar]
- 30. Warzecha CC, Jiang P, Amirikian K, Dittmar KA, Lu H, Shen S, Guo W, Xing Y & Carstens RP (2010) An ESRP‐regulated splicing programme is abrogated during the epithelial‐mesenchymal transition. EMBO J 29, 3286–3300. [DOI] [PMC free article] [PubMed] [Google Scholar]
- 31. Grundy PE, Telzerow PE, Breslow N, Moksness J, Huff V & Paterson MC (1994) Loss of heterozygosity for chromosomes 16Q and 1P in wilms tumors predicts an adverse outcome. Cancer Res 54, 2331–2333. [PubMed] [Google Scholar]
- 32. Di Modugno F, Iapicca P, Boudreau A, Mottolese M, Terrenato I, Perracchio L, Carstens RP, Santoni A, Bissell MJ & Nistico P (2012) Splicing program of human MENA produces a previously undescribed isoform associated with invasive, mesenchymal‐like breast tumors. Proc Natl Acad Sci USA 109, 19280–19285. [DOI] [PMC free article] [PubMed] [Google Scholar]
- 33. Shapiro IM, Cheng AW, Flytzanis NC, Balsamo M, Condeelis JS, Oktay MH, Burge CB & Gertler FB (2011) An EMT–driven alternative splicing program occurs in human breast cancer and modulates cellular phenotype. PLoS Genet 7, e1002218. [DOI] [PMC free article] [PubMed] [Google Scholar]
- 34. Bielen A, Box G, Perryman L, Bjerke L, Popov S, Jamin Y, Jury A, Valenti M, Brandon Ade H, Martins V et al. (2012) Dependence of Wilms tumor cells on signaling through insulin‐like growth factor 1 in an orthotopic xenograft model targetable by specific receptor inhibition. Proc Natl Acad Sci USA 109, E1267–1276. [DOI] [PMC free article] [PubMed] [Google Scholar]
- 35. Frisch SM, Farris JC & Pifer PM (2017) Roles of Grainyhead‐like transcription factors in cancer. Oncogene 36, 6067–6073. [DOI] [PubMed] [Google Scholar]
- 36. Bebee TW, Park JW, Sheridan KI, Warzecha CC, Cieply BW, Rohacek AM, Xing Y & Carstens RP (2015) The splicing regulators Esrp1 and Esrp2 direct an epithelial splicing program essential for mammalian development. Elife 4, e08954. [DOI] [PMC free article] [PubMed] [Google Scholar]
- 37. Dittmar KA, Jiang P, Park JW, Amirikian K, Wan J, Shen S, Xing Y & Carstens RP (2012) Genome‐wide determination of a broad ESRP‐regulated posttranscriptional network by high‐throughput sequencing. Mol Cell Biol 32, 1468–1482. [DOI] [PMC free article] [PubMed] [Google Scholar]
- 38. Wineberg Y, Bar‐Lev TH, Futorian A, Ben‐Haim N, Armon L, Ickowicz D, Oriel S, Bucris E, Yehuda Y, Pode‐Shakked N et al. (2020) Single‐Cell RNA sequencing reveals mRNA splice isoform switching during kidney development. J Am Soc Nephrol 31, 2278–2291. [DOI] [PMC free article] [PubMed] [Google Scholar]
- 39. Visel A, Thaller C & Eichele G (2004) GenePaint.org: an atlas of gene expression patterns in the mouse embryo. Nucleic Acids Res 32, D552–556. [DOI] [PMC free article] [PubMed] [Google Scholar]
- 40. Bebee TW, Sims‐Lucas S, Park JW, Bushnell D, Cieply B, Xing Y, Bates CM & Carstens RP (2016) Ablation of the epithelial‐specific splicing factor Esrp1 results in ureteric branching defects and reduced nephron number. Dev Dyn 245, 991–1000. [DOI] [PMC free article] [PubMed] [Google Scholar]
- 41. Munkley J, Li L, Krishnan SRG, Hysenaj G, Scott E, Dalgliesh C, Oo HZ, Maia TM, Cheung K, Ehrmann I et al. (2019) Androgen‐regulated transcription of ESRP2 drives alternative splicing patterns in prostate cancer. Elife 8, e47678. [DOI] [PMC free article] [PubMed] [Google Scholar]
- 42. Oltean S & Bates DO (2014) Hallmarks of alternative splicing in cancer. Oncogene 33, 5311–5318. [DOI] [PubMed] [Google Scholar]
- 43. Gokmen‐Polar Y, Neelamraju Y, Goswami CP, Gu Y, Gu X, Nallamothu G, Vieth E, Janga SC, Ryan M & Badve SS (2019) Splicing factor ESRP1 controls ER‐positive breast cancer by altering metabolic pathways. EMBO Rep 20, e46078. [DOI] [PMC free article] [PubMed] [Google Scholar]
- 44. Gerhauser C, Favero F, Risch T, Simon R, Feuerbach L, Assenov Y, Heckmann D, Sidiropoulos N, Waszak SM, Hubschmann D et al. (2018) Molecular Evolution of Early‐Onset Prostate Cancer Identifies Molecular Risk Markers and Clinical Trajectories. Cancer Cell 34, 996–1011. [DOI] [PMC free article] [PubMed] [Google Scholar]
- 45. Mizutani A, Koinuma D, Seimiya H & Miyazono K (2016) The Arkadia‐ESRP2 axis suppresses tumor progression: analyses in clear‐cell renal cell carcinoma. Oncogene 35, 3514–3523. [DOI] [PMC free article] [PubMed] [Google Scholar]
- 46. Deloria AJ, Hoflmayer D, Kienzl P, Lopatecka J, Sampl S, Klimpfinger M, Braunschmid T, Bastian F, Lu L, Marian B et al. (2016) Epithelial splicing regulatory protein 1 and 2 paralogues correlate with splice signatures and favorable outcome in human colorectal cancer. Oncotarget 7, 73800–73816. [DOI] [PMC free article] [PubMed] [Google Scholar]
- 47. Maruvka YE, Mouw KW, Karlic R, Parasuraman P, Kamburov A, Polak P, Haradhvala NJ, Hess JM, Rheinbay E, Brody Y et al. (2017) Analysis of somatic microsatellite indels identifies driver events in human tumors. Nat Biotechnol 35, 951–959. [DOI] [PMC free article] [PubMed] [Google Scholar]
- 48. Pistore C, Giannoni E, Colangelo T, Rizzo F, Magnani E, Muccillo L, Giurato G, Mancini M, Rizzo S, Riccardi M et al. (2017) DNA methylation variations are required for epithelial‐to‐mesenchymal transition induced by cancer‐associated fibroblasts in prostate cancer cells. Oncogene 36, 5551–5566. [DOI] [PubMed] [Google Scholar]
- 49. Heilmann K, Toth R, Bossmann C, Klimo K, Plass C & Gerhauser C (2017) Genome‐wide screen for differentially methylated long noncoding RNAs identifies Esrp2 and lncRNA Esrp2‐as regulated by enhancer DNA methylation with prognostic relevance for human breast cancer. Oncogene 36, 6446–6461. [DOI] [PMC free article] [PubMed] [Google Scholar]
- 50. Hartwig S, Ho J, Pandey P, Macisaac K, Taglienti M, Xiang M, Alterovitz G, Ramoni M, Fraenkel E & Kreidberg JA (2010) Genomic characterization of Wilms' tumor suppressor 1 targets in nephron progenitor cells during kidney development. Development 137, 1189–1203. [DOI] [PMC free article] [PubMed] [Google Scholar]
- 51. Bharathavikru R, Dudnakova T, Aitken S, Slight J, Artibani M, Hohenstein P, Tollervey D & Hastie N (2017) Transcription factor Wilms' tumor 1 regulates developmental RNAs through 3' UTR interaction. Genes Dev 31, 347–352. [DOI] [PMC free article] [PubMed] [Google Scholar]
- 52. Charles AK, Brown KW & Berry PJ (1998) Microdissecting the genetic events in nephrogenic rests and Wilms' tumor development. Am J Pathol 153, 991–1000. [DOI] [PMC free article] [PubMed] [Google Scholar]
- 53. Park S, Bernard A, Bove KE, Sens DA, Hazen‐Martin DJ, Garvin AJ & Haber DA (1993) Inactivation of WT1 in nephrogenic rests, genetic precursors to Wilms' tumour. Nat Genet 5, 363–367. [DOI] [PubMed] [Google Scholar]
Associated Data
This section collects any data citations, data availability statements, or supplementary materials included in this article.
Supplementary Materials
Fig. S1. Cell line STR profiles.
Fig. S2. ESRP2 inducible expression construct.
Fig. S3. ESRP2 methylation detected by MCIP.
Fig. S4. ESRP2 methylation and RNA expression in Wilms tumours from two cohorts.
Fig. S5. ESRP2 DNA methylation in Wilms tumours of different stages and 16q LOH status.
Fig. S6. Overall survival in Wilms tumour patients with different levels of ESRP2 methylation.
Fig. S7. ESRP2 methylation and expression in Wilms tumours of different histological subtypes.
Fig. S8. Hierarchical clustering of Wilms tumours by DNA methylation.
Fig. S9. ESRP2 methylation in other childhood renal tumours and adult cancers.
Fig. S10. Transient transfection of Wilms tumour cells with Esrp1 and Esrp2.
Fig. S11. Growth of Wit49 transfected cells.
Fig. S12. Motility assays of Wit49 transfected cells.
Fig. S13. Mouse tumorigenicity data.
Fig. S14. GRHL1 RNA expression.
Fig. S15. Successfully validated putative ESRP2 target genes.
Fig. S16. Unsuccessfully validated putative ESRP2 target genes.
Fig. S17. Alternative splicing of putative ESRP2 target genes in normal kidney and Wilms tumour.
Table S1. Oligonucleotide primers used for PCR.
Table S2. MCIP hits and filtering.
Table S3. Pyrosequencing assays.
Table S4. MCIP hits GO analysis.
Table S5. Properties of tumours used in Fig. S8.
Table S6. Skipped exons (SE) identified with rMATs.
Table S7. Mutually exclusive exons (MXE) identified with rMATS.
Table S8. Retained introns (RI) identified with rMATS.
Table S9. GO analysis of all genes identified with rMATS from RNA‐seq data; Mutually exclusive exons (MXE), Retained introns (RI) and Skipped exons (SE).
Table S10. Putative ESRP2 targets.
Data Availability Statement
Supporting data are available in the supplementary material of this article [Figs S1 to S17, and Tables S1 to S10]. The genome‐wide DNA methylation (MCIP) data that support the findings of this study are openly available in NCBI's Gene Expression Omnibus and are accessible through https://www.ncbi.nlm.nih.gov/geo/query/acc.cgi?acc=GSE153047, GEO Series accession number GSE153047. The RNA‐seq data that support the findings of this study are openly available in NCBI's Gene Expression Omnibus and are accessible through https://www.ncbi.nlm.nih.gov/geo/query/acc.cgi?acc=GSE154496, GEO Series accession number GSE154496.