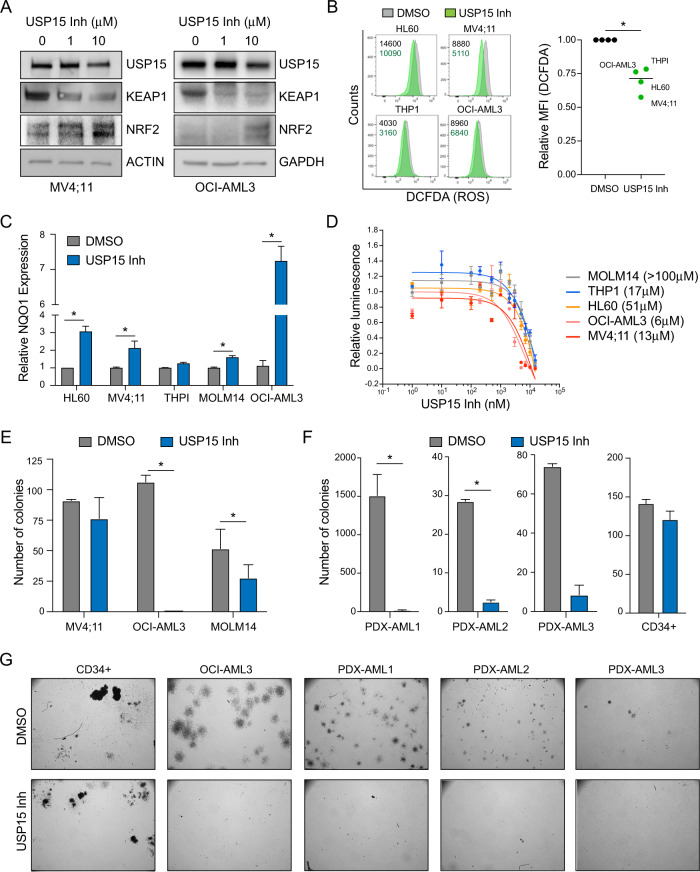
Fig. 6. Inhibition of USP15 with a small molecule induces NRF2-medidated redox stress and impairs leukemic progenitors in vitro.
A Immunoblot analysis of USP15, KEAP1, NRF2, and ACTIN/GAPDH in MV4;11 and OCI-AML3 cells treated with vehicle (DMSO, 0 μM) or the indicated concentrations of USP15 inhibitor for 24 h. Data reflects three independent assays. B Left; histogram flow plots of DCFDA analysis of cellular ROS in the indicated AML cells treated for 24 h with DMSO (gray) or 10 μM of USP15 inhibitor (green) with the raw MFI values set shown. Right; the normalized mean-fluorescent intensity of DCFDA in the AML cell lines versus their DMSO controls. A parametric, ratio-paired t test was performed. *P = 0.01. The centerline depicts the median. Data is from four independent cell lines. C Relative NQO1 expression in the indicated AML cell lines treated with vehicle (DMSO) or USP15 inhibitor (10 μM) for 24 h (n = 3 replicates). D Cell-Titer Glo relative luminescence was measured at 72 h with USP15 inhibitor in the indicated AML cell lines. Luminescence detected in inhibitor-treated cells was normalized to the vehicle control cells treated with DMSO (n = 3 replicates per dose). The IC50 values for each cell line are shown. E Total number of colonies formed by MV4;11, OCI-AML3, and MOLM14 cell lines in methylcellulose after 7 days of treatment with the USP15 inhibitor (10 μM). (n = 3 per group). Data reflects two independent assays. F The total number of colonies formed by three independent patient-derived-xenografted (PDX) AML samples and normal CD34+ cells after 7–10 days of treatment with the USP15 inhibitor (10 μM). *P < 0.05. G Representative colony images from healthy CD34+, OCI-AML3 leukemic cell line, and three PDX AML samples treated with DMSO or USP15 inhibitor.

