Abstract
As well known that synapse loss is a significant pathological feature of Alzheimer’s disease (AD), meanwhile, the hippocampus is one of brain regions to be first affected in the early stage of AD. Thus, this work employs a comprehensive DG-CA3 network model of the hippocampus so as to explore the neuronal correlation between glutamatergic synapse loss and abnormal firing rhythm associated with AD from the perspective of neurocomputation. The neuropathological condition of glutamatergic synapse loss caused by the reduction of Shank3 protein in AD patients is imitated by decreasing glutamatergic excitatory synapse strength between different neurons. By means of power spectral analysis and dynamics technique, the numerical results reveal that excitability of pyramidal neuron as well as oriens lacunosum-moleculare (O-LM) cell in CA3 region is strongly degraded by the decrease of NMDA or AMPA-type glutamatergic excitatory synapse strength. Moreover, the relative power together with the peak of relative power density within alpha band is also diminished by decreasing glutamatergic synapse strength. These findings accord with the electrophysiological experiment of EEG that there is a decrease of alpha rhythm for AD patients, on the same time, they could highlight the significance of glutamatergic synapse loss in the pathogenesis of AD.
Keywords: Alzheimer’s disease, Glutamatergic synapse loss, Firing rate, Spectral analysis within alpha band
Introduction
Alzheimer’s disease (AD) is an irreversible progressive neurodegenerative disease. As the main type of dementia in the elderly, AD is clinically characterized by cognitive dysfunction such as learning disorder and memory deficit. Previous studies have shown that neurofibrillary tangles and senile plaques are obvious neuropathological structures of early AD, while they are not significantly associated with the degree of dementia. In recent years, the incidence rate of dementia is gradually increasing with the aging population (Adeli et al. 2005). It is reported that the prevalence of dementia over 65 years old has reached about 3.6%–10.3% in western countries and 1.8–10.8% in Asian countries, respectively (Lee et al. 2002). Recent statistics have showed that around 50 million people worldwide has suffered from AD or other forms of dementia.
Although the incidence of AD is high, its etiology and pathogenesis still remain elusive in clinical and medical research. During the past decades some hypotheses have been put forward for AD pathogenesis, in which the amyloid cascade hypothesis and the cholinergic hypothesis are the most popular ones (Barage and Sonawane 2015). The amyloid cascade hypothesis assumes that the neurodegeneration of AD is caused by abnormal accumulation of amyloid beta (Aβ) plaques in some brain regions. Extensive deposition of Aβ can lead to biochemical and structural changes including synapse loss, neuron loss and cerebral atrophy in axons, dendrites and neurosoma. The cholinergic hypothesis supposes that patients with AD are of cholinergic dysfunction which is accompanied with synapse decrease and loss. These two hypotheses suggest that synapse loss plays an important role in the pathogenesis of AD, which has attracted more and more attention in the field of AD (Wilcock et al. 2009; Davies et al. 1987; Clare et al. 2010). In 1987, Davies et al. (1987) have first proposed that synaptic loss is associated with senile dementia. Then, synaptic loss is confirmed to be a notable pathological feature of AD. In addition, some works have compared the synaptic loss in brains of AD patients with that in normal elderly, where they have found that proportion of synapses loss in normal elderly’s brain is about 10–15% while that in AD patients is about 30–40% (Clare et al. 2010).
In fact, there are many factors that can lead to synapse loss in AD. Mutated proteins in the postsynaptic density (PSD) are the main cause of synaptic loss (Selkoe 2005; Hardingham et al. 2010; Lambert et al. 2007; Felice et al. 2009). The mutated proteins can be roughly divided into three categories including extra-synaptic NMDA receptors, Shank protein and neurotoxic oligomers formed by Aβ deposition. As known that Shank protein is abundantly present in the cortex and hippocampus. Study have shown that Shank protein, as a highly expressed postsynaptic scaffold protein, regulates the inter-action between proteins and acts as a bridge between the neurotransmitter receptor complex and the actin cytoskeleton components. Shank protein plays an indispensable role in the formation and regulation of the PSD. In more detail, it is present in the PSD, which forms a platform supporting kinases and a variety of receptors such as glutamate receptors. Shank protein consists of three subtypes of Shank1, Shank2 and Shank3. Previous studies have examined that Shank3 protein is remarkably reduced in AD patients, meanwhile, the ubiquitin-protease system accelerates the degradation of Shank3 protein. In view of the significance of Shank3 protein to PSD and glutamate receptor, Lambert et al. (2007) and Felice et al. (2009) have indicated that Shank3’s reduction can lead to glutamatergic synapse loss and synapse dysfunction. Synaptic abnormalities resulting from the decrease of Shank3 should be highlighted in the pathogenesis of AD.
On the other hand, to better understand the pathogenesis of AD, more and more scientists have devoted themselves to the underlying neuronal mechanism under the pathological condition of AD from the perspective of neurocomputation. As well known that the hippocampus, as a crucial structure of brain limbic system, is mainly responsible for learning and memory, such as episodic memory and spatial memory (Squire 1992). The main structures of hippocampus include entorhinal cortex (EC), dentate gyrus (DG), CA1 region and CA3 region. The learning and memory functions of hippocampus are closely associated with some neurological diseases such as AD and epilepsy (Basso et al. 2006; Zhang et al. 2017; Fan et al. 2020). Especially, the hippocampus is one of the first regions to be affected in the early stage of AD (Adeli et al. 2005). At present, some computational models of hippocampus and its adjacent regions have been successfully constructed. For example, Golomb et al. (2006) have developed one-compartment model of CA1 pyramidal neuron based on the electrophysiological experiment and the membrane ionic channel theory. This nine-dimensional computational model can simulate some electrophysiological experimental results of the hippocampal CA1 pyramid neuron. Moreover, it can spontaneously generate abundant discharge patterns such as regular firing, tonic firing and rhythmic bursting. Then, this high-dimensional pyramidal neuron model has been reduced into minimum models and two-dimensional reduced model by dimension reduction technique (Peng et al. 2016). Due to the fact that the hippocampal pyramidal neurons receive cholinergic input from the medial septum, Jiang et al. (2020) have improved this pyramidal neuron model by introducing cholinergic action, and explored how acetylcholine deficiency influences the dynamic changes in the context of AD. Zou et al. (2012) have constructed a hippocampal septal network consisting of pyramidal, basket, O-LM and MSGABA neurons, then the hippocampus dynamical abnormalities have been evaluated in terms of power spectral analysis. Note that EEG abnormality is a potential marker of AD, which provides a helpful tool to diagnosis and treatment in clinical research. In the literature, some characteristics of EEG in the early stage of AD has been revealed, such as an increase in theta band power and a decrease in alpha band power (Dauwels et al. 2010; Jeong 2004; John et al. 2018).
The hippocampal CA3 region is one of key structures of memory. Especially, there are specil recurrent laterals in the CA3 region, which makes the hippocampus form associative memory (Samura et al. 2008). In addition to the neuron models of hippocampus CA1 region, how to mathematically model the hippocampal neurons in CA3 region and the peripheral brain area is also an interesting question in neuroscience. Marr (1971) has constructed a famous hippocampal CA3 neuron model, in which the self-associative memory function can be realized. By introducing the state variable of calcium ion concentration, Traub (1982) has established a 19-compartment hippocampal neuron model, by which the hippocampal neurons in CA3 region can be simulated more accurately. Combining two realistic models of the rat CA3 and CA1 regions, Taxidis et al. (2011) have proposed a full CA3-CA1 network model with chemical synaptic connections such as schaffer collaterals, which can accurately reproduce the basic characteristics of Sharp Wave-Ripple complexes and underline the mechanism for ripple generation. To investigate the transitions of temporal lobe epilepsy (TLE) from dynamics perspective, Zhang et al. (2017) have established a computational network model containing DG region and CA3 region based on the physiological structure of hippocampus, in which this comprehensive DG-CA3 network is based on Hodgkin–Huxley (HH) type models and two-compartment Pinsky–Rinzel (PR) model via glutamatergic and GABAergic synaptic connections, respectively. They have illustrated that the complex TLE transitions including interictal, preictal and seizure onset in pyramidal neuron can be realized by regulating the N-methyl-D-aspartic (NMDA) glutamate junction conductance strength.
In fact, the dentate gyrus is an integral portion of the hippocampus, which is the source of much of the cortical sensory information that the hippocampal formation uses to carry out its functions (Amaral et al. 2007). In addition, the dentate gyrus, as the major termination of projections from the entorhinal cortex, may firstly receives information from the entorhinal cortex and ultimately conveys to the CA3 field of the hippocampus, leading to the production of episodic memories. As stated above, in the literature some hippocampus computational models such as the hippocampal CA1 pyramidal neuron, the hippocampal CA3 pyramidal neuron and the hippocampal septal network have been proposed in the field of AD research. However, the neural correlation between the hippocampus DG-CA3 region and Alzheimer disease has still remained puzzled. In order to fully understand the hippocampus DG-CA3 neuronal mechanism of AD and underline the pathogenesis of AD associated with the glutamatergic synapse loss caused by the decrease of Shank3 protein, this work takes a first step to employ the comprehensive DG-CA3 network model to numerically explore the correlation between glutamatergic synapse loss and abnormal firing rhythm related with AD by means of power spectral analysis and dynamics method. Here, the neuropathological condition of glutamatergic synapse loss is simulated by decreasing glutamatergic synapse strength. The structure of this work is as follows. " Introduction" section introduces the DG-CA3 model detailedly. "Model presentation" section discuss the effects of glutamatergic synapse loss on the neuron excitability and alpha rhythmic activity. "Main results" section presents a clear conclusion and discussion about this work.
Model presentation
As illustrated in the previous work (Zhang et al. 2017), the organizational structure and synaptic connection layout of DG-CA3 model adopted in this work are shown in Fig. 1. The model is divided into two parts of DG region and CA3 region. In detail, the DG region is mainly composed of granule cell, mossy cell and the GABAergic interneuron, while the CA3 region is made of pyramidal neuron, O-LM cell and the GABAergic interneuron. The models for GABAergic interneuron, pyramidal neuron and O-LM cell are all simulated by Hodgkin Huxley (H–H) type model (Wang et al. 1996; Olufsen et al. 2003; Tort et al. 2008). The mossy cell model is imitated using a two-compartment model proposed by Pinsky and Rinzel (1994). The granule cell model is sourced from the work (Tateno et al. 2007), where the number of gating variables is reduced and the governing rule of calcium ion concentration is correspondingly adjusted compared to that used in the original DG-CA3 model (Yuen and Durand 1991; Zhang et al. 2017).
Fig. 1.
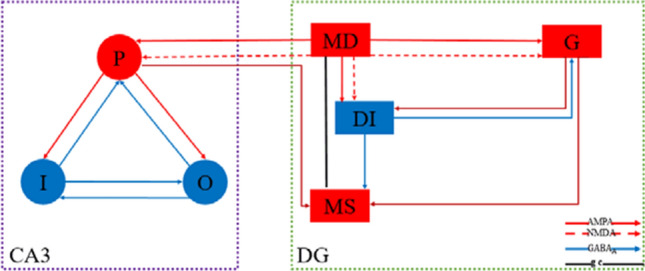
The organizational structure and synaptic connection layout of DG-CA3 model (Zhang et al. 2017). The model includes two parts of DG region and CA3 region. In CA3 region, the pyramidal neuron, GABAergic interneuron and O-LM cell are represented by P, I, and O, respectively. In DG region, G and DI denote granule cell and GABAergic interneuron, respectively. The mossy’s soma and dendrite are indicated by MS and MD, respectively. The AMPA/NMDA type synaptic connection are represented by the red solid/dash line with arrow means. The inhibitory type synaptic connection is denoted by the blue solid line with arrow. The inter-compartment coupling connection within mossy cell is indicated by black solid line
The synaptic connections in this DG-CA3 model are as follows (Zhang et al. 2017). GABAergic interneuron and mossy cell are innervated by granule cell through excitatory AMPA synaptic connections. Mossy cell propagates excitatory inputs to GABAergic interneuron and granule cell by both excitatory AMPA synaptic connection and excitatory NMDA synaptic connection. Depending on inhibitory synaptic connection, GABAergic interneuron returns inhibitory synaptic inputs to granule cell and mossy cell. Afterward, through mossy fiber path the excitatory inputs from DG are transmitted to pyramidal neuron in CA3 by excitatory AMPA synaptic connection and excitatory NMDA synaptic connection. Pyramidal neuron innervates GABAergic interneuron and O-LM cell by excitatory AMPA coupling connections, while both GABAergic interneuron and O-LM cell return inhibitory synaptic inputs to pyramidal neuron depending on synaptic connections. GABAergic interneuron and O-LM cell are mutually inhibited through inhibitory synaptic connections. There has been backprojection from pyramidal neuron in CA3 region to mossy cell in DG region by excitatory AMPA synaptic connection. Please refer to the detailed network modeling in the appendix.
Main results
All the numerical simulations in this section are performed in the circumstance of Matlab2016b. The DG-CA3 network model is numerically integrated by Runge Kutta method, in which parameter values for different synaptic connections and stimulating currents are listed in Table 1. As indicated in the Introduction, Shank3 protein has been examined to be notably diminished in AD patients. Moreover, the reduction of Shank3 protein can lead to glutamatergic synapse loss and synapse dysfunction. In the following, we decrease the glutamatergic synapse strength to imitate synapse loss resulting from the reduction of Shank3 protein. As stated in the Introduction, the neural information from the dentate gyrus to the CA3 region is very important for the hippocampus to perform its function of memory and learning. This motivates us focus on how the loss of glutamatergic synapse projecting to CA3 region influences the CA3 neurons’ firing rhythms rather than all the glutamatergic synapse losses. By numerical simulation we have confirmed that the effect of glutamatergic excitatory synapse loss on the CA3 GABAergic interneuron is similar that on the O-LM cell. As for the CA3 GABAergic interneuron and the O-LM cell are all inhibitory neuron in the CA3 region, only the case of O-LM cell is discussed to save space. Thus, the three excitatory synaptic connections to regulate glutamate receptor releasing between different neurons are illustrated in the following three cases. (1) The NMDA type synaptic conjunction from mossy cell in DG region to pyramidal neuron in CA3 region, where the synapse connection strength is denoted by . (2) The AMPA type synaptic conjunction from mossy cell in DG region to pyramidal neuron in CA3 region, where the synapse connection strength is denoted by . (3) The AMPA type synaptic conjunction from pyramidal neuron to O-LM cell within CA3 region, where the synapse strength is denoted by . Then, taking , and as the main control parameters in this DG-CA3 model respectively, the influence of glutamatergic excitatory synapse loss on the firing rhythm of pyramidal neuron and O-LM cell is systematically explored by analyzing the firing rate and the power spectrum within alpha band (7–13 Hz).
Table 1.
The parameters for different synaptic connections and stimulating currents in the DG-CA3 network
| Module | Presynaptic neuron | Synaptic coupling parameter | Case1 | Case2 | Case3 |
|---|---|---|---|---|---|
| CA3 | P | 0.001 | 0.001 | 0.001 | |
| 0.055 | 0.055 | – | |||
| 0.01 | 0.01 | 0.01 | |||
| Stimulating current | 1 µA/cm2 | 1µA/cm2 | 1 µA/cm2 | ||
| I | 0.001 | 0.001 | 0.001 | ||
| 0.0005 | 0.0005 | 0.0005 | |||
| Stimulating current | 10 µ/cm2 | 10 µ/cm2 | 10 µ/cm2 | ||
| O | 0.001 | 0.001 | 0.001 | ||
| 0.0005 | 0.0005 | 0.0005 | |||
| Stimulating current | 10 µ/cm2 | 10 µ/cm2 | 10 µ/cm2 | ||
| DG | G | 0.00001 | 0.00001 | 0.00001 | |
| 0.001 | 0.001 | 0.001 | |||
| Stimulating current | 10 µ/cm2 | 10 µ/cm2 | 10 µ/cm2 | ||
| DI | 0.0005 | 0.0005 | 0.0005 | ||
| 0.01 | 0.01 | 0.01 | |||
| Stimulating current | 10 µ/cm2 | 10 µ/cm2 | 10 µ/cm2 | ||
| MD | – | 0.0001 | 0.0001 | ||
| 0.0001 | – | 0.0001 | |||
| 0.0001 | 0.0001 | 0.0001 | |||
| 0.0001 | 0.0001 | 0.0001 | |||
| 0.0001 | 0.0001 | 0.0001 | |||
| 0.0001 | 0.0001 | 0.0001 | |||
| Stimulating current or | 10 µA/cm2 | 10 µ/cm2µA/cm2 | 10 µ/cm2µA/cm2 | ||
The signal “–” indicates that the corresponding parameter is control variable in this case
Case 1: taking NMDA type synaptic strength as control variable
This section takes the excitatory NMDA type synaptic connection as control variable to regulate glutamate receptors concentration from presynaptic mossy cell to postsynaptic pyramidal neuron. The other parameters for different synaptic connections and stimulating currents in the DG-CA3 network are regulated by the values of Case1 in Table 1. The influence of glutamatergic synapse loss on the firing rhythm of pyramidal neuron is discussed by decreasing the synaptic strength .
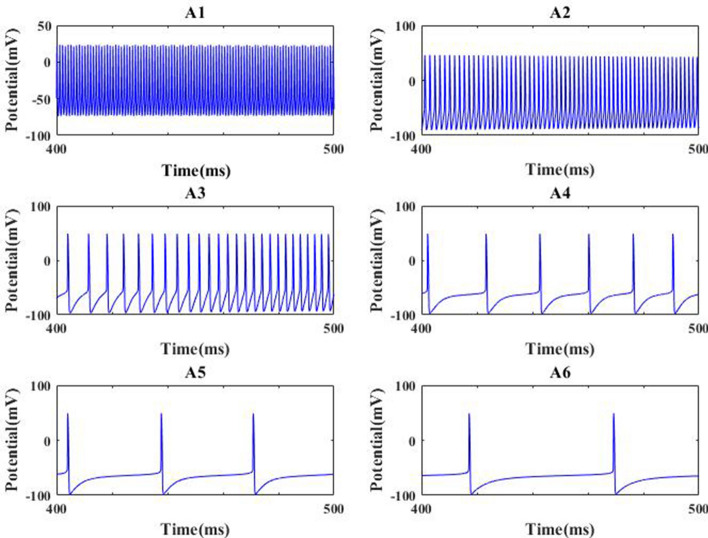
To reveal how the NMDA type synaptic connection influences the excitability of pyramidal neuron, the firing rate of pyramidal neuron is depicted in Fig. 2, which is gotten by the reciprocal of the average of interspike intervals (ISIs). From this figure, it can be clearly seen that there is a gradual decrease of firing rate as is initially decreased, then it abruptly decreases and reaches relative smaller value when is about 0.005, after that the firing rate of pyramidal neuron basically remains at this smaller value. This result indicates that the excitability of pyramidal neuron is strongly diminished by the decrease of synaptic strength . The decreased excitability resulting from synapse loss is further qualitatively demonstrated by the membrane potential of pyramidal neuron. Figure 3 show the evolution of membrane potential for some typical synapse strength, in which the parameter 0.025, 0.01, 0.008, 0.007, 0.005, 0.0001 is successively decreasing from Fig. 3 A1–A6. Results displayed in Fig. 3 illustrate that for strong NMDA type synaptic connection strength (please see panels A1–A3) the output firing trains look much more frequent, while for weak synaptic connection strength the spiking series becomes very rare (please see panels A4–A6). These results vividly verify that the excitability of pyramidal neuron is significantly diminished by the NMDA-type glutamatergic synapse loss induced by the reduction of Shank3 protein.
Fig. 2.
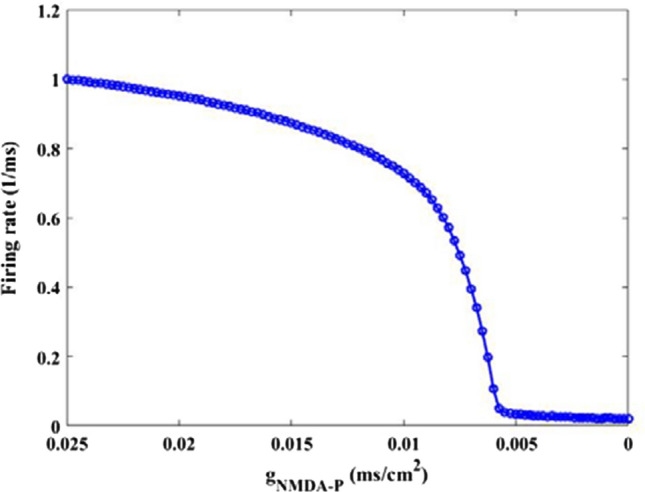
Dependence of the firing rate for pyramidal neuron on synapse strength . There is an obvious decrease in the firing rate upon decreasing parameters
Fig. 3.
Some membrane potential of pyramidal neuron for different strength : 0.025(A1), 0.01(A2), 0.008(A3), 0.007(A4), 0.005(A5), 0.0001(A6)
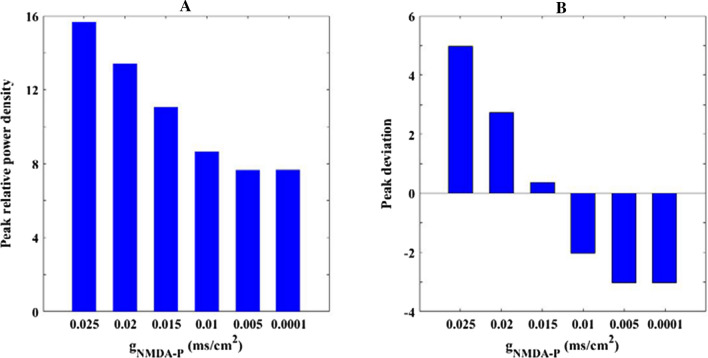
Then the effect of excitatory NMDA type synaptic connection on the firing rhythm of pyramidal neuron is discussed by power spectrum analysis. Figure 4 illustrates that how the relative alpha band power of pyramidal neuron changes when the parameter is varied in the range of 0.025–0. The relative alpha band power is defined as the mean of the relative power density within alpha band, where the relative power density is obtained by the FFT-based power spectral technique (Moretti et al. 2004; Cantero et al. 2009). From this figure, one can observe that upon decreasing the relative power within alpha band drops continually until is about 0.005, after which the relative alpha band power does not fall anymore but fluctuates at a relative smaller level. That is to say, the alpha rhythm of pyramidal neuron is reduced by the decrease of excitatory NMDA type synaptic connection In order to show the above phenomenon in more detail, the corresponding peak of relative power density within alpha band for some synaptic strength (for example = 0.025, 0.02, 0.015, 0.01, 0.005, 0.0001) are further illustrated in Fig. 5A. Meanwhile, the corresponding peak deviation between the peak of relative power density and their mean is also displayed in Fig. 5B. It is obvious that the smaller the synaptic coupling strength , the lower the peak of relative power density in alpha band, which is consistent with the decreased trend of the relative alpha band power shown in Fig. 4. Here the decrease of synapse strength simulates the glutamatergic synapse loss resulting from the reduction of Shank3 protein in AD patients, thus the diminished alpha rhythm of the pyramidal neuron induced by the decrease of in the DG-CA3 network model accords with the electrophysiological experiment of EEG that there is a decrease of alpha rhythm in AD patients (Dauwels et al. 2010; Jeong 2004; John et al. 2018).
Fig. 4.
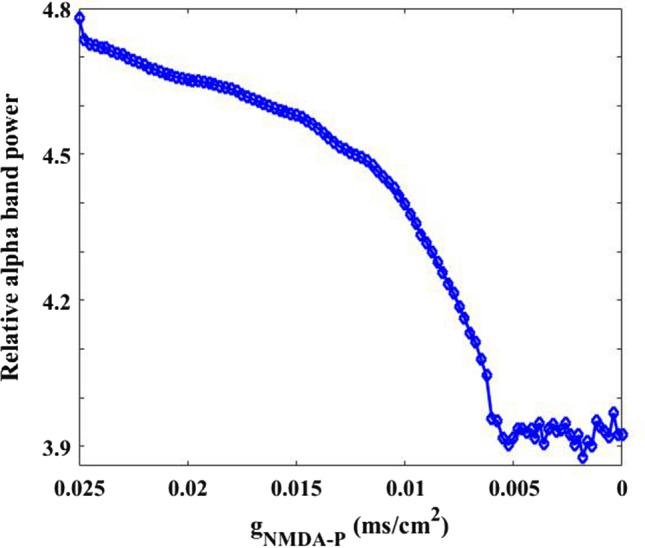
Dependence of the relative alpha band power of pyramidal neuron on synapse strength . It can be seen an obvious decrease in the relative alpha band power upon decreasing parameter
Fig. 5.
The peak of relative power density within alpha band (A) and the corresponding peak deviation between the peak of relative power density and their mean (B) for some synaptic strength : 0.025, 0.02, 0.015, 0.01, 0.005, 0.0001. There is an obvious decrease in the peak of relative alpha band power density upon decreasing parameter
Case 2: taking AMPA type synaptic strength as control variable
The results of Case 1 suggest that NMDA type synapses loss plays a destructive role in the firing rhythm of pyramidal neuron. One may wonder that whether the AMPA type synapse loss from mossy cell to pyramidal neuron has similar effect on the firing rhythm of pyramidal neuron. This section takes the excitatory AMPA type synaptic connection as control variable to regulate glutamate receptors concentration from presynaptic mossy cell to postsynaptic pyramidal neuron. The other parameters include different synaptic connections and stimulating currents in the DG-CA3 network are regulated by the values of Case2 in Table 1. The influence of glutamatergic synapse loss on the firing rhythm of pyramidal neuron is discussed by decreasing the synaptic strength .
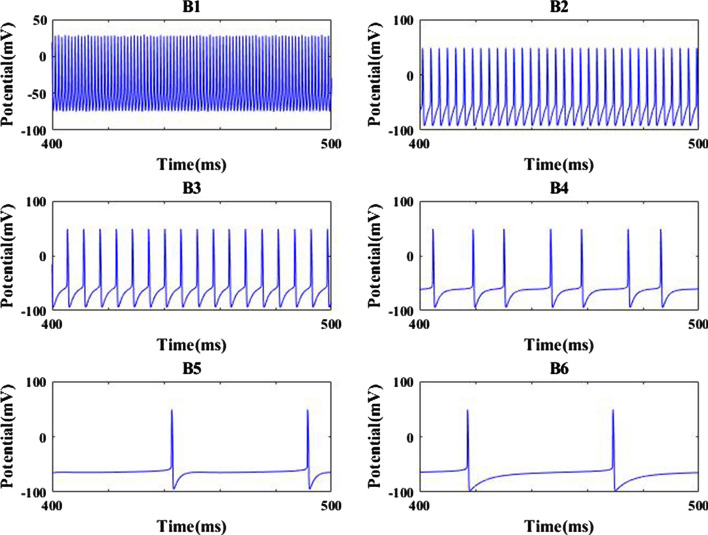
Firstly, the dependence of firing rate on the synaptic strength is depicted in Fig. 6 so as to illustrate how the AMPA type synaptic connection affects the excitability of pyramidal neuron. The simulation result demonstrates as the synaptic strength is decreased from 0.25, the firing rate gradually decreases until it arrives at a relatively smaller value when is about 0.01, then the firing rate of pyramidal neuron basically remains at this smaller value. This result indicates that the excitability of pyramidal neuron is greatly reduced due to the decrease of synaptic strength . For further clarification, this phenomenon is confirmed by some membrane potential of pyramidal neuron in Fig. 7. From B1–B6 the parameter is successively chosen as = 0.25, 0.025, 0.015, 0.012, 0.01 and 0.0001. The results of Fig. 7 show that the output firing trains of pyramid neuron seem quite frequent for large AMPA type synaptic connection strength (please see panels B1–B3), on the contrary, the spiking series becomes very rare for weak synaptic connection strength (please see panels B4–B6). Obviously, these results imply that the excitability of pyramid neuron is significantly diminished by the AMPA-type glutamatergic synapse loss resulting from the reduction of Shank3 protein.
Fig. 6.
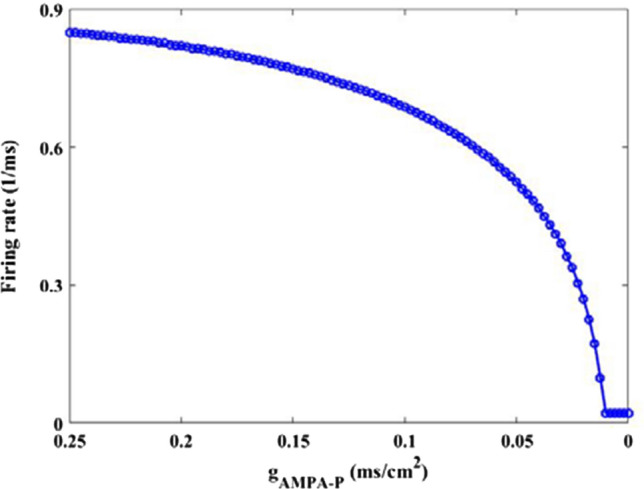
Dependence of firing rate of pyramidal neuron on synapse strength . There is an obvious decrease in the firing rate upon decreasing parameters
Fig. 7.
Some membrane potential of pyramidal neuron for different strength : a0.25(B1), 0.025(B2), 0.015(B3), 0.012(B4), 0.01(B5), 0.0001(B6)
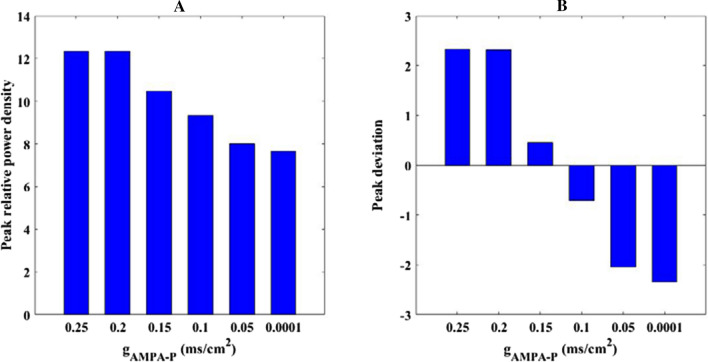
Secondly, how the excitatory AMPA type synaptic connection influences the firing rhythm of pyramid neuron is investigated by using power spectrum analysis within alpha band. The variation of relative alpha band power of pyramidal neuron with the parameter in the range of 0.25–0 is depicted in Fig. 8. Clearly, one can observe that the relative power within alpha band decreases gradually until the parameter is about 0.01, thereafter, the relative alpha band power does not decrease but fluctuates slightly instead. This result implies that the alpha rhythm of pyramid neuron is diminished by the decrease of excitatory AMPA type synaptic connection To show the phenomena more detailedly, Fig. 9A illustrate the peak relative power density within alpha band for some typical synaptic strength (for example = 0.25, 0.2, 0.15, 0.1, 0.05, 0.0001). Meanwhile, the corresponding peak deviation between the peak of relative power density and their mean is also displayed in Fig. 9B. From this figure, we can see that the peak of relative power density in alpha band is degraded by the decrease of synaptic coupling strength , which coincides with the decreased trend of the relative alpha band power displayed in Fig. 8. In this subsection, the glutamatergic synapse loss induced by the reduction of Shank3 protein in AD patients is imitated by the decrease of synapse strength from presynaptic mossy cell to postsynaptic pyramidal neuron, thus the decreased alpha rhythm of the pyramid neuron due to the decrease of in the DG-CA3 network model is consistent with the electrophysiological experimental result of EEG that the alpha rhythm is diminished in AD patients(Dauwels et al. 2010; Jeong 2004; John et al. 2018).
Fig. 8.
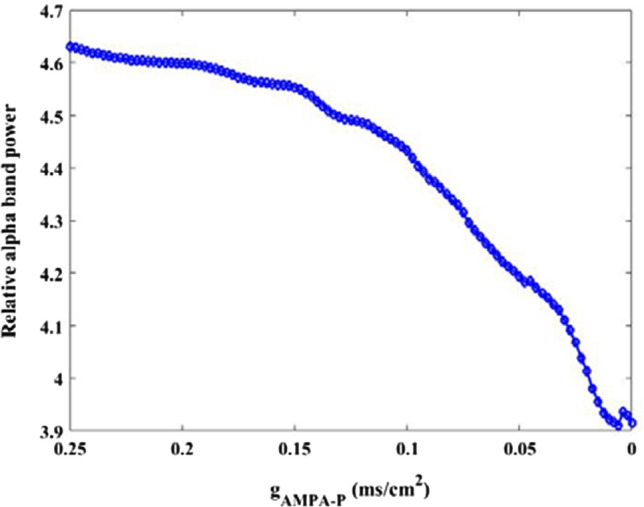
Dependence of relative alpha band power of pyramidal neuron on synapse strength . There is an obvious decrease in the relative alpha band power upon decreasing parameters
Fig. 9.
The peak of relative power density within alpha band (A) and the corresponding peak deviation between the peak of relative power density and their mean (B) for some synaptic strength : 0.25, 0.2, 0.15, 0.1, 0.05, 0.0001. There is an obvious decrease in the peak of relative alpha band power density upon decreasing parameter
Case 3: taking AMPA type synaptic strength as control variable
According to the results of Case 1 and Case 2, one can conclude that glutamatergic excitatory synapse loss has a destructive role on the firing rhythm of pyramidal neuron. Specifically, the loss of glutamatergic synapse can significantly reduce the excitability and the rhythmic activity of alpha band in pyramidal neuron. Based on the above results, one may wonder whether glutamatergic excitatory synapse in the DG-CA3 model have similar effects on other neurons in CA3 region such as O-LM cell. Therefore, defining the parameters include different synaptic connections and stimulating currents in the DG-CA3 network as what is showed in Case3 in Table 1, this section takes the excitatory AMPA type synaptic connection as control variable to regulate glutamate receptors concentration from presynaptic pyramidal neuron to postsynaptic O-LM cell. The effect of glutamatergic synapse loss on the firing rhythm of O-LM cell is investigated by decreasing the synaptic strength .
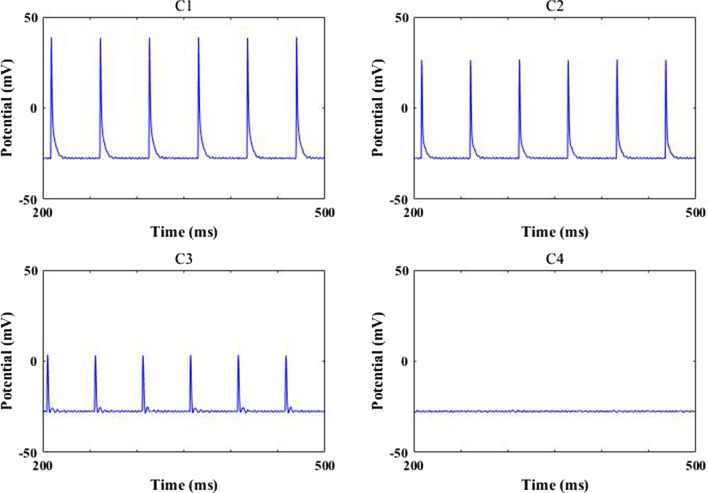
How synaptic strength influences the excitability of O-LM cell is firstly depicted in Fig. 10. Simulation results show that the firing rate has no distinct change with the beginning decrease of synaptic strength , however, it suddenly decreases to zero when synaptic strength reaches about 0.008, after that the firing rate of O-LM cell basically remains at zero. Obviously, the excitability of O-LM cell diminishes greatly due to the decrease of synaptic strength To further illustrate this phenomenon, Fig. 11 shows the evolution of membrane potential for some synapse strength, where the parameter 0.05, 0.03, 0.01, 0.0001 is successively decreasing from Fig. 11 C1–C4. More intuitively, the O-LM cell transfers from firing state to non-firing state as the synapse coupling strength is decreased. These results demonstrate that the excitability of O-LM cell is significantly diminished by the loss of AMPA-type glutamatergic synapse caused by the reduction of Shank3 protein.
Fig. 10.
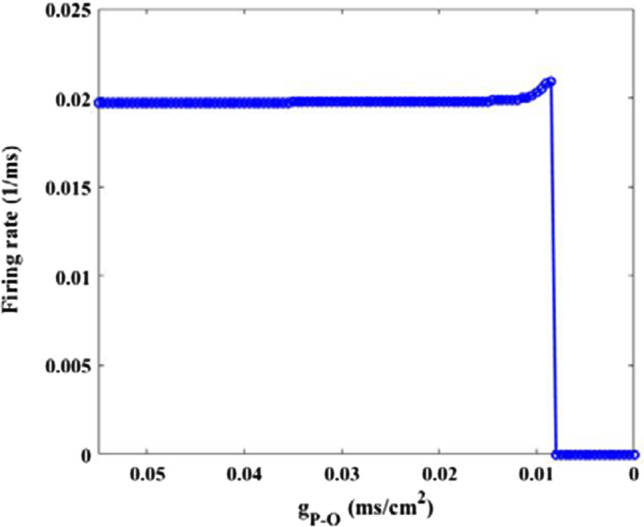
Dependence of firing rate of O-LM cell on synapse strength . There is an obvious decrease in the firing rate upon decreasing parameter
Fig. 11.
Some typical membrane potential of O-LM cell for different strength : 0.05(C1), 0.03(C2), 0.01(C3), 0.0001(C4)
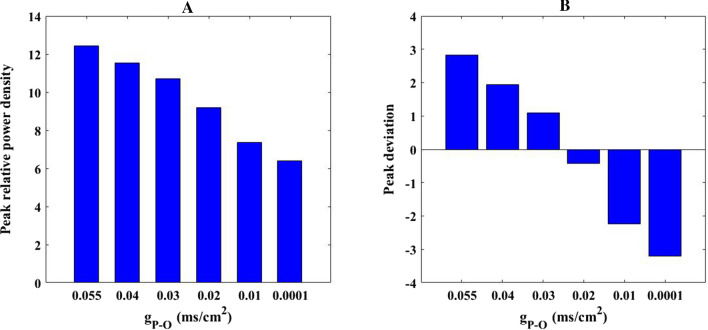
The above study has indicated that the AMPA-type synaptic connection from pyramidal neuron to O-LM cell plays a crucial role in decreasing the firing rate of O-LM cell. Inspired by this fact, effect of this AMPA-type synaptic connection on the alpha rhythm of O-LM cell is further discussed. Figure 12 illustrates how the relative alpha band power of O-LM cell changes as the parameter is varied in the range of 0.055–0. From this figure, it can be clearly seen that the relative power of alpha band does not change significantly as parameter is initially decrease, but it gradually decreases as parameter continues to decrease. To visualize this result, the corresponding peak of relative power density within alpha band for some synaptic strength (for example = 0.055, 0.04, 0.03, 0.02, 0.01, 0.0001) are displayed in Fig. 13A. Meanwhile, the corresponding peak deviation between the peak of relative power density and their mean is also displayed in Fig. 13B. It can be intuitively seen that the smaller the synaptic coupling strength , the lower the peak of relative power density in alpha band. Note that the glutamatergic synapse loss resulting from the reduction of Shank3 protein in AD patients in this part is mimicked by the decrease of synapse strength from presynaptic pyramidal neuron to postsynaptic O-LM cell. Therefore, the diminished alpha rhythm of the O-LM cell due to the decrease of in the DG-CA3 network model accords with the electrophysiological experimental result of EEG that there is decrease of alpha rhythm in AD patients (Dauwels et al. 2010; Jeong 2004; John et al. 2018).
Fig. 12.
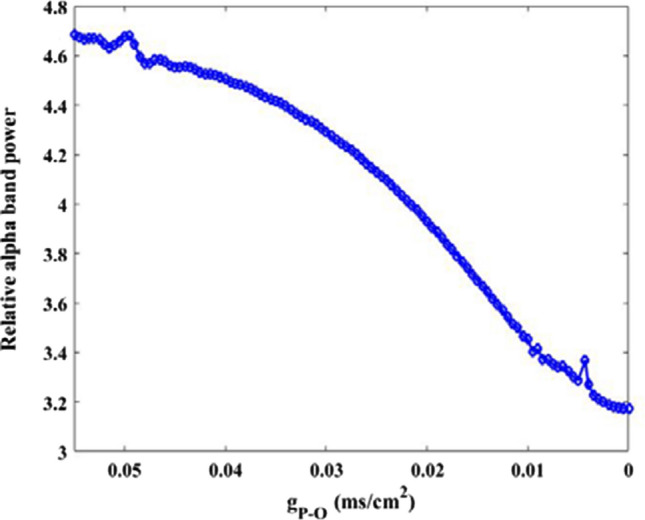
Dependence of alpha band relative power of O-LM cell on synapse strength . There is an obvious decrease in the relative alpha band power upon decreasing parameter
Fig. 13.
The peak of relative power density within alpha band (A) and the corresponding peak deviation between the peak of relative power density and their mean (B) for some synaptic strength : 0.055, 0.04, 0.03, 0.02, 0.01, 0.0001. There is an obvious decrease in the peak of relative alpha band power density upon decreasing parameter
Conclusion and discussion
As indicated in the Introduction, Shank3 protein is critical to support glutamate receptor, whose reduction can lead to glutamatergic synapse loss and synapse dysfunction. Previous studies have examined that Shank3 protein is remarkably reduced in AD patients. Moreover, the hippocampus is one of important pathogenic brain area of AD. Motivated by these findings, this work aims to investigate how glutamatergic excitatory synapse loss induced by the reduction of Shank3 protein affects the firing rhythm of hippocampus neurons, where the hippocampus region is mathematically modeled by a DG-CA3 network (Zhang et al. 2017). The neuropathological state of glutamatergic synapse loss resulting from the reduction of Shank3 protein in AD patients is simulated by decreasing NMDA/AMPA type synapse strength in this DG-CA3 network model. Using the power spectral analysis and dynamics method, numerical results show that glutamatergic excitatory synapse loss is closely related to the abnormality of firing rhythm in CA3 neurons including pyramidal neuron and O-LM cell. Specifically, NMDA or AMPA type synapse loss from presynaptic mossy cell to postsynaptic pyramidal neuron has a destructive role on the excitability and alpha rhythmic activity of pyramidal neuron, i.e., the firing rate, the relative alpha band power as well as the peak of relative power within alpha band is significantly degraded by the decrease of NMDA or AMPA type synapse strength. On the other hand, the AMPA type synapse loss from presynaptic pyramidal neuron to postsynaptic O-LM cell can also lead to a decrease in alpha rhythm of O-LM cell, on the same time, the excitability of O-LM cell is strongly diminished by AMPA type synapse loss. We hope that these results regarding glutamatergic synapse loss induced abnormal firing rhythm are significant to understand the neuronal mechanism associated with AD. In addition, these results are helpful to clarify the importance of the reduction of Shank3 protein in AD pathology.
At last, we point out that the traditional excitatory trisynaptic pathway in the hippocampus is EC–DG–CA3–CA1–EC (Deng et al. 2010). In detail, firstly the axons of layer II neurons in the EC region project to the DG region by the perforant pathway. The DG sends projections to the pyramidal neurons in CA3 by mossy fibres. Then, the CA3 pyramidal neurons relay the information to the CA1 pyramidal neurons by Schaffer collaterals. Finally, the CA1 pyramidal neurons send back-projections into deep-layer neurons of the EC. It is reasonable to predict that a full computational model comprising the trisynaptic pathway of EC–DG–CA3–CA1–EC is better to explore the hippocampus neuronal mechanism related with AD. Thus, constructing a complete hippocampus computational model including not only the DG and CA3 region but also the CA1 and EC region is desirable, which is our next work in the near future. In addition, the glutamatergic synapse loss resulting from the reduction of Shank3 protein in AD patients is simulated by decreasing glutamatergic excitatory synapse strength in this DG-CA3 network. At present, this work only focuses the point that Shank3 protein is related to the synthesis of glutamate synaptic receptors, which in turn affects the transmission of glutamate synaptic information. The biochemical process of Shank3 protein in the synaptic loss is not explicitly included in the network model. Incorporating the effect of the Shank3 protein explicitly in DG-CA3 model could vividly depict the biochemical process of this protein, which is also our next work in the near future.
Acknowledgements
This work is partially supported by the National Natural Science Foundation of China (Grant No. 11972217), the Fundamental Funds Research for the Central Universities
(Grant Nos. GK201901008).
Appendix
Based on the work of Zhang et al. (2017), the local neuron models and the synaptic connectivity models can be described as follows. As stated in the Model preparation, the models for pyramidal neuron, GABAergic interneuron, O-LM cell and granule cell are all simulated by Hodgkin Huxley (H–H) type models. The mossy cell model is imitated on the basis of a two-compartment model proposed by Pinsky and Rinzel. The mathematical expression of the synaptic model from neuron i to neuron j is described as (Kopell et al. 2010)
where is the synaptic reversal potential, denotes the conductance strength, is the membrane potential of neuron j, and denotes the gating variable. The synaptic gating variable associated with the presynaptic neuron i is defined as and obeys the following rule
where is the membrane potential and represents the Heaviside function, and are the rise and decay time constants, respectively. The parameters are = 0.1, = 3 and = 60 for AMPA receptor-mediated synapses originating from the pyramidal neuron and the granule cell. The parameters are = 0.3, = 9, = − 80 and = 0.2, = 20, = − 80 for receptor-mediated synapses originating from the GABAergic interneuron and O-LM cell, respectively.
As for the NMDA receptor-mediated synapses and the AMPA receptor-mediated synapses that originate from the mossy cell, the synapse model on the basis of previous work (Pinsky and Rinzel 1994)
Granule cell model
The Granule cell model is based on the work of Yuen and Durand (1991), whose governing equations are as follows:
| Channel | Definition | Explicit expression |
|---|---|---|
|
|
||
|
|
||
|
|
|
where , , , and denote capacitance density, external electrical stimulus for the granule cell, membrane potential, time, and conductance density, respectively. The units of the above variables are , , mV, ms, and . The parameters are , , F = 96,485.33289, w = 0.2, z = 2, , . F is the Faraday constant, w is the depth of the shell, and z is the valence of the calcium ion. is the calcium removal rate. As for the synaptic coupling of Granule cell, it receives AMPA and NMDA type synaptic coupling from the dendrite of mossy cell. It also receives type synaptic coupling from interneurons in DG. The synaptic current form of Granule cell is denoted by , which is described as follows:
| Synaptic current | Synaptic type | Explicit expression |
|---|---|---|
|
|
|
|
CA3 and DG GABAergic interneuron
The CA3 and DG GABAergic interneuron model are based on the work of Wang (1996), whose governing equations are as follows:
| Channel | Definition | Explicit expression |
|---|---|---|
|
/(
/(
|
||
|
/(
|
||
The parameters are . As for the synaptic coupling of CA3 GABAergic interneuron, it receives AMPA type synaptic coupling from Pyramidal neuron and type synaptic coupling from O-LM cell. The synaptic current form of CA3 GABAergic interneuron is denoted by , which is described as follows:
| Synaptic current | Synaptic type | Explicit expression |
|---|---|---|
As for the synaptic coupling of DG GABAergic interneuron, it receives AMPA and NMDA type synaptic coupling from the dendrite of mossy cell. It also receives AMPA type synaptic coupling from Granule cell. The synaptic current form of DG GABAergic interneuron is denoted by , which is described as follows:.
| Synaptic current | Synaptic type | Explicit expression |
|---|---|---|
|
|
|
|
Pyramidal neuron
The pyramidal neuron model is based on the work of Olufsen et al. (2003), whose governing equations are as follows:
| Channel | Definition | Explicit expression |
|---|---|---|
|
/(
|
||
|
|
||
|
|
The parameters are . As for the synaptic coupling of pyramidal neuron, it receives AMPA and NMDA type synaptic coupling from the dendrite of mossy cell. It also receives type synaptic coupling from interneurons in CA3 and O-LM cell. The synaptic current of pyramidal neuron is denoted by , which is described as follows:
| Synaptic current | synaptic type | Explicit expression |
|---|---|---|
|
|
||
|
|
O-LM cell
The O-LM cell model is based on the work of Tort et al. (2008), whose governing equations are as follows:
| Channel | Definition | Explicit expression |
|---|---|---|
|
/(
|
||
|
/(
|
||
|
|
||
|
|
||
The parameters are . As for the synaptic coupling of O-LM cell, it receives AMPA type synaptic coupling from Pyramidal neuron and type synaptic coupling from CA3 GABAergic interneuron. The synaptic current form of O-LM cell is denoted by , which is described as follows:
| Synaptic current | Synaptic type | Explicit expression |
|---|---|---|
Mossy cell model
The Mossy cell model is based on the work of Pinsky and Rinzel (1994), whose governing equations are as follows:
| Channel | Definition | Explicit expression |
|---|---|---|
|
|
||
|
for
for
|
The parameters are ,, , which represents the percentage of total area in the soma-like compartment. As for the synaptic coupling of soma of the mossy cell, it receives AMPA type synaptic coupling from Pyramidal neuron and Granule cell. It also receives type synaptic coupling from DG GABAergic interneuron. The synaptic current form of the soma of the mossy cell is denoted by , which is described as follows:
| Synaptic current | Synaptic type | Explicit expression |
|---|---|---|
For all the above synaptic models .
Declaration
Conflict of interest
We declare that we have no conflict of interest.
Footnotes
Publisher's Note
Springer Nature remains neutral with regard to jurisdictional claims in published maps and institutional affiliations.
References
- Adeli H, Ghosh-Dastidar S, Dadmehr N. Alzheimer’s disease and models of computation: imaging, classification, and neural models. J Alzheimer’s Dis. 2005;7:187–199. doi: 10.3233/JAD-2005-7301. [DOI] [PubMed] [Google Scholar]
- Amaral DG, Scharfman HE, Lavenex P. The dentate gyrus: fundamental neuromical organization (dentate gyrus for dummies) Prog Brain Res. 2007;163:3–22. doi: 10.1016/S0079-6123(07)63001-5. [DOI] [PMC free article] [PubMed] [Google Scholar]
- Barage SH, Sonawane KD. Amyloid cascade hypothesis: pathogenesis and therapeutic strategies in Alzheimer’s disease. Neuropeptides. 2015;52:1–18. doi: 10.1016/j.npep.2015.06.008. [DOI] [PubMed] [Google Scholar]
- Basso M, Yang J, Warren L, MacAvoy MG, Varma P, Bronen RA. Volumetry of amygdala and hippocampus and memory performance in Alzheimer’s disease. Psychiat Res Neuroim. 2006;146:251–261. doi: 10.1016/j.pscychresns.2006.01.007. [DOI] [PubMed] [Google Scholar]
- Cantero JL, Atienza M, Cruz-Vadell A, Suarez-Gonzalez A, Gil-Neciga AE. Increased synchronization and decreased neural complexity underlie thalamocortical oscillatory dynamics in mild cognitive impairment. Neuroimage. 2009;46:938–948. doi: 10.1016/j.neuroimage.2009.03.018. [DOI] [PubMed] [Google Scholar]
- Clare R, King VG, Wirenfeldt M, Vinters HV. Synapse loss in dementias. J Neurosci Res. 2010;88:2083–2090. doi: 10.1002/jnr.22392. [DOI] [PMC free article] [PubMed] [Google Scholar]
- Dauwels J, Vialatte F, Cichocki A. Diagnosis of Alzheimer’s disease from EEG signals: where are we standing. Curr Alzheimer Res. 2010;7:1–43. doi: 10.2174/1567210204558652050. [DOI] [PubMed] [Google Scholar]
- Davies CA, Mann DMA, Sumpter PQ, Yates PO. A quantitative morphometric analysis of the neuronal and synaptic content of the frontal and temporal cortex in patients with Alzheimer’s disease. J Neurol Sci. 1987;78:151–164. doi: 10.1016/0022-510X(87)90057-8. [DOI] [PubMed] [Google Scholar]
- Deng W, Aimone JB, Gage FH. New neurons and new memories: how does adult hippocampal neurogenesis affect learning and memory? Nat Rev Neurosci. 2010;11(5):339–350. doi: 10.1038/nrn2822. [DOI] [PMC free article] [PubMed] [Google Scholar]
- Fan DG, Zheng YH, Yang ZC, Wang QY. Improving control effects of absence seizures using single-pulse alternately resetting stimulation (SARS) of corticothalamic circuit. Appl Math Mech-Engl Ed. 2020;41:1287–1302. doi: 10.1007/s10483-020-2644-8. [DOI] [Google Scholar]
- Felice FGD, Vieira MNN, Bomfim TR, Decker H, Velasco PT, Lambert MP. Protection of synapses against Alzheimer’s-linked toxins: insulin signaling prevents the pathogenic binding of Aβ oligomers. P Natl Acad Sci USA. 2009;106:1971–1976. doi: 10.1073/pnas.0809158106. [DOI] [PMC free article] [PubMed] [Google Scholar]
- Golomb D, Yue CY, Yaari Y. Contribution of persistent Na+ current and M-type K+ current to somatic bursting in CA1 pyramidal cells: combined experimental and modeling study. J Neurophysiol. 2006;96:1912–1926. doi: 10.1152/jn.00205.2006. [DOI] [PubMed] [Google Scholar]
- Hardingham GE, Bading H. Synaptic versus extrasynaptic NMDA receptor signalling: implications for neurodegenerative disorders. Nat Rev Neurosci. 2010;11:682–696. doi: 10.1038/nrn2911. [DOI] [PMC free article] [PubMed] [Google Scholar]
- Jeong J. EEG dynamics in patients with Alzheimer’s disease. Clin Neurophysiol. 2004;115:1490–1505. doi: 10.1016/j.clinph.2004.01.001. [DOI] [PubMed] [Google Scholar]
- Jiang PH, Yang XL, Sun ZK. Dynamics analysis of the hippocampal neuronal model subjected to cholinergic action related with Alzheimer’s disease. Cogn Neurodyn. 2020;14:483–500. doi: 10.1007/s11571-020-09586-6. [DOI] [PMC free article] [PubMed] [Google Scholar]
- John TN, Puthankattil SD, Menon R. Analysis of long range dependence in the EEG signals of Alzheimer patients. Cogn Neurodyn. 2018;12:183–199. doi: 10.1007/s11571-017-9467-8. [DOI] [PMC free article] [PubMed] [Google Scholar]
- Kopell N, Borgers C, Pervouchine DD, Malerba P (2010) Gamma and theta rhythms in biophysical models of hippocampal circuits. Hippocampal microcircuits, pp 423–457
- Lambert MP, Velasco PT, Chang L, Viola KL, Fernandez S, Lacor PN. Monoclonal antibodies that target pathological assemblies of Aβ. J Neurochem. 2007;100:23–35. doi: 10.1111/j.1471-4159.2006.04157.x. [DOI] [PubMed] [Google Scholar]
- Lee DY, Lee JH, Ju YS, Lee KU, Kim KW, Jhoo JH. The prevalence of dementia in older people in an urban population of Korea: the seoul study. J Am Geriatr Soc. 2002;50:1233–1239. doi: 10.1046/j.1532-5415.2002.50310.x. [DOI] [PubMed] [Google Scholar]
- Marr D. Simple Memory: A theory for archicortex. Phil Trans R Soc Lond B. 1971;262:23–81. doi: 10.1098/rstb.1971.0078. [DOI] [PubMed] [Google Scholar]
- Moretti DV, Babiloni C, Binetti G, Cassetta E, Forno GD, Ferreric F. Individual analysis of EEG frequency and band power in mild Alzheimer’s disease. Clin Neurophysiol. 2004;115:299–308. doi: 10.1016/S1388-2457(03)00345-6. [DOI] [PubMed] [Google Scholar]
- Olufsen MS, Whittington MA, Camper M, Kopell N. New roles for the gamma rhythm: population tuning and preprocessing for the beta rhythm. J Comput Neurosci. 2003;14:33–54. doi: 10.1023/A:1021124317706. [DOI] [PubMed] [Google Scholar]
- Peng YP, Wang J, Zheng CX. Study on dynamic characteristics’ change of hippocampal neuron reduced models caused by the Alzheimer’s disease. J Biol Dyn. 2016;10:250–262. doi: 10.1080/17513758.2016.1162856. [DOI] [PubMed] [Google Scholar]
- Pinsky PF, Rinzel J. Intrinsic and network rhythmogenesis in a reduced traub model for CA3 neurons. J Comput Neurosci. 1994;1:39–60. doi: 10.1007/BF00962717. [DOI] [PubMed] [Google Scholar]
- Samura T, Hattori M, Ishizaki S. Sequence disambiguation and pattern completion by cooperation between autoassociative and heteroassoeiative memories of functionally divided hippocampal CA3. Neurocomputing. 2008;71(16–18):3176–3183. doi: 10.1016/j.neucom.2008.04.026. [DOI] [Google Scholar]
- Selkoe DJ. Defining molecular targets to prevent Alzheimer’s disease. Arch Neurol. 2005;62:192–195. doi: 10.1001/archneur.62.2.192. [DOI] [PubMed] [Google Scholar]
- Squire LR. Memory and the hippocampus: a synthesis from findings with rats, monkeys, and humans. Psychol Rev. 1992;99:195–231. doi: 10.1037/0033-295X.99.2.195. [DOI] [PubMed] [Google Scholar]
- Tateno K, Hayashi H, Ishizuka S. Synchronized spike selection in a hippocampal dentate gyrus network model in the theta frequency range. Int Congr Ser. 2007;1301:79–82. doi: 10.1016/j.ics.2006.12.027. [DOI] [Google Scholar]
- Taxidis J, Coombes S, Mason R, Owen MR. Modeling sharp wave-ripple complexes through a CA3-CA1 network model with chemical synapses. Hippocampus. 2011;22:995–1017. doi: 10.1002/hipo.20930. [DOI] [PubMed] [Google Scholar]
- Tort ABL, Kramer MA, Thorn C, Gibson DJ, Kubota Y, Graybiel AM. Dynamic cross-frequency couplings of local field potential oscillations in rat striatum and hippocampus during performance of a T-maze task. P Natl Acad Sci USA. 2008;105:20517–20522. doi: 10.1073/pnas.0810524105. [DOI] [PMC free article] [PubMed] [Google Scholar]
- Traub RD. Simulation of intrinsic bursting in CA3 hippocampal neurons. Neuroscience. 1982;7:1233–1242. doi: 10.1016/0306-4522(82)91130-7. [DOI] [PubMed] [Google Scholar]
- Wang XJ, Buzsaki G. Gamma oscillation by synaptic inhibition in hippocampal interneuronal network model. J Neurosci. 1996;16:6402–6413. doi: 10.1523/JNEUROSCI.16-20-06402.1996. [DOI] [PMC free article] [PubMed] [Google Scholar]
- Wilcock DM, Gharkholonarehe N, Van Nostrand WE, Davis J, Vitek MP, Colton CA. Amyloid reduction by amyloid-β vaccination also reduces mouse tau pathology and protects from neuron loss in two mouse models of Alzheimer’s disease. J Neurosci. 2009;29:7957–7965. doi: 10.1523/JNEUROSCI.1339-09.2009. [DOI] [PMC free article] [PubMed] [Google Scholar]
- Yuen GLF, Durand D. Reconstruction of hippocampal granule cell electrophysiology by computer simulation. Neuroscience. 1991;41:411–423. doi: 10.1016/0306-4522(91)90337-N. [DOI] [PubMed] [Google Scholar]
- Zhang LY, Fan DG, Wang QY. Transition dynamics of a Dentate Gyrus-CA3 neuronal network during Temporal Lobe Epilepsy. Front Comput Neurosci. 2017;11:61. doi: 10.3389/fncom.2017.00061. [DOI] [PMC free article] [PubMed] [Google Scholar]
- Zou X, Coyle D, Wong-Lin KF, Maguire L. Beta-amyloid induced changes in A-type current can alter hippocampo-septal network dynamics. J Comput Neurosci. 2012;32:465–477. doi: 10.1007/s10827-011-0363-7. [DOI] [PubMed] [Google Scholar]


