

Abstract
Although visual examination (VE) is the preferred method for caries detection, the analysis of intraoral digital photographs in machine-readable form can be considered equivalent to VE. While photographic images are rarely used in clinical practice for diagnostic purposes, they are the fundamental requirement for automated image analysis when using artificial intelligence (AI) methods. Considering that AI has not been used for automatic caries detection on intraoral images so far, this diagnostic study aimed to develop a deep learning approach with convolutional neural networks (CNNs) for caries detection and categorization (test method) and to compare the diagnostic performance with respect to expert standards. The study material consisted of 2,417 anonymized photographs from permanent teeth with 1,317 occlusal and 1,100 smooth surfaces. All the images were evaluated into the following categories: caries free, noncavitated caries lesion, or caries-related cavitation. Each expert diagnosis served as a reference standard for cyclic training and repeated evaluation of the AI methods. The CNN was trained using image augmentation and transfer learning. Before training, the entire image set was divided into a training and test set. Validation was conducted by selecting 25%, 50%, 75%, and 100% of the available images from the training set. The statistical analysis included calculations of the sensitivity (SE), specificity (SP), and area under the receiver operating characteristic (ROC) curve (AUC). The CNN was able to correctly detect caries in 92.5% of cases when all test images were considered (SE, 89.6; SP, 94.3; AUC, 0.964). If the threshold of caries-related cavitation was chosen, 93.3% of all tooth surfaces were correctly classified (SE, 95.7; SP, 81.5; AUC, 0.955). It can be concluded that it was possible to achieve more than 90% agreement in caries detection using the AI method with standardized, single-tooth photographs. Nevertheless, the current approach needs further improvement.
Keywords: caries diagnostics, caries assessment, visual examination, clinical evaluation, convolutional neural networks, deep learning
Introduction
One of the recurring tasks in dentistry is the recording of dental status and the detection and diagnosis of pathological findings, including caries. This assessment eventually results in individual recommendations for preventive and operative management (Schwendicke, Splieth, et al. 2019). From a clinical point of view, visual examination (VE) is the preferred method, as it can be performed easily and achieve acceptable accuracy after tooth cleaning and drying (Ekstrand et al. 1997, 2018; Nyvad et al. 1999; Ekstrand 2004; Kühnisch et al. 2009, 2011; Pitts 2009; World Health Organization [WHO] 2013; Gimenez et al. 2015). Although diagnostic studies have shown that trained dentists are generally able to achieve good intra- and interexaminer reproducibility (e.g., Litzenburger et al. 2018), there are repeatedly situations observed in daily clinical practice in which different dentists make contradictory diagnoses. Therefore, independent verification through artificial intelligence (AI) methods may be desirable (Schwendicke, Golla, et al. 2019; Schwendicke, Samek, et al. 2020). In the case of the visual assessment of teeth, the analysis of intraoral photographs in machine-readable form can be considered equivalent to VE and provide pictorial information, which means they are the basic requirement for automated analysis. The first studies were published recently using deep learning with convolutional neural networks (CNNs) to detect caries on dental X-rays (Bejnordi et al. 2018; Lee et al. 2018a, 2018b; Park and Park 2018; Moutselos et al. 2019; Cantu et al. 2020; Geetha et al. 2020; Khan et al. 2020) or near-infrared light transillumination images (Casalegno et al. 2019; Schwendicke, Elhennawy, et al. 2020). However, a few attempts have been made to use intraoral images for automatic, AI-based caries detection (Askar et al. 2021). Therefore, this diagnostic study focused on caries detection and categorization with a CNN (the test method) and compared the diagnostic performance with respect to expert evaluation (the reference standard) on intraoral photographs. In detail, it was expected that a diagnostic accuracy of at least 90% would be reached.
Materials and Methods
This study was approved by the Ethics Committee of the Medical Faculty of the Ludwig-Maximilians-University of Munich (project number 020-798). The reporting of this investigation followed the recommendations of the Standard for Reporting of Diagnostic Accuracy Studies (STARD) steering committee (Bossuyt et al. 2015) and topic-related recommendations (Schwendicke et al. 2021).
Photographic Images
All the images were taken in the context of previous studies as well as for documentation or teaching purposes by an experienced dentist (JK). In detail, all the images were photographed with a professional single-reflex lens camera (Nikon D300, D7100, or D7200 with a Nikon Micro 105-mm lens) and Macro Flash EM-140 DG (Sigma) after tooth cleaning and drying. Molar teeth were photographed indirectly using intraoral mirrors (Reflect-Rhod; Hager & Werken) heated before positioning in the oral cavity to prevent condensation on the mirror surface.
To ensure the best possible image quality, inadequate photographs (e.g., out-of-focus images or images with saliva contamination) were excluded. Furthermore, duplicated photos from identical teeth or surfaces were removed from the data set. With this selection step, it was ensured that equal clinical photographs were included once only. All jpeg images (RGB format, resolution 1,200 × 1,200 pixel, no compression) were cropped to an aspect ratio of 1:1 and/or rotated in a standard manner using professional image editing software (Affinity Photo; Serif) until, finally, the tooth surface filled most of the frame. With respect to the study aim, only images of healthy teeth or carious surfaces were included. Photographs with (additional) noncarious hard tissue defects (e.g., enamel hypomineralization, hypoplasia, erosion or tooth wear, fissure sealants, and direct and indirect restorations) were excluded to rule out potential evaluation bias. Finally, 2,417 anonymized, high-quality clinical photographs from 1,317 permanent occlusal surfaces and 1,100 permanent smooth surfaces (anterior teeth and canines = 734; posterior teeth = 366) were included.
Caries Evaluation on All the Images (Reference Standard)
Each image was examined on a PC aimed at detecting and categorizing caries lesions in agreement with widely accepted classification systems: the WHO standard (WHO 2013), International Caries Detection and Assessment System (Pitts 2009, http://www.icdas.org), and Universal Visual Scoring System (Kühnisch et al. 2009, 2011). All the images were labeled by an experienced examiner (JK, >20 y of clinical practice and scientific experience), who was also aware of the patients’ history and overall dental status, into the following categories: 0, surfaces with no caries; 1, surfaces with signsof a noncavitated caries lesion (first signs, established lesion, localized enamel breakdown); and 2, surfaces with caries-related cavitation (dentin exposure, large cavity). Both caries thresholds are of clinical relevance and also commonly used in caries diagnostic studies (Schwendicke, Splieth, et al. 2019; Kapor et al. 2021). Each diagnostic decision—1 per image—served as a reference standard for cyclic training and repeated evaluation of the deep learning–based CNN. The annotator’s (JK) intra- and interexaminer reproducibility was published earlier as a result of different training and calibration sessions. The κ values showed at least a substantial capability for caries detection and diagnostics: 0.646/0.735 and 0.585/ 0.591 (UniViSS; Kühnisch et al. 2011) and 0.93 to 1.00 (DMF index and UniViSS; Heitmüller et al. 2013).
Programming and Configuration of the Deep Learning–Based CNN for Caries Detection and Categorization (Test Method)
The CNN was trained using a pipeline of several established methods, mainly image augmentation and transfer learning. Before training, the entire image set (2,417 images/853 healthy tooth surfaces/1,086 noncavitated carious lesions/431 cavitations/47 automatically excluded images during preprocessing) was divided into a training set (N = 1,891/673/870/348) and a test set (N = 479/180/216/83). The latter was never made available to the CNN as training material and served as an independent test set.
Image augmentation was used to provide a large number of variable images to the CNN on a recurring basis. For this purpose, the randomly selected images (batch size = 16) were multiplied by a factor of ~3, altered by image augmentation (random center and margin cropping by up to 20% each, random rotation by up to 30°), and resized (224 × 224 pixel) by using torchvision (version 0.6.1, https://pytorch.org) in connection with the PyTorch library (version 1.5.1, https://pytorch.org). In addition, all the images were normalized to compensate for under- and overexposure.
MobileNetV2 (Sandler et al. 2018) was used as the basis for the continuous adaptation of the CNN for caries detection and categorization. This architecture uses inverted residual blocks, whose skip connections allow access to previous activations, and enables the CNN to achieve high performance with low complexity (Bianco et al. 2018). The model architecture was mainly chosen for better inference time and improved usability in clinical settings. When training the CNN, backpropagation was used, aiming at determining the gradient for learning. Backpropagation was repeated iteratively over images and labels using the abovementioned batch size and parameters. Overfitting was prevented, first, by selecting a low learning rate (0.001). Second, dropout (rate 0.2) on final linear layers was used as a regularization technique (Srivastava et al. 2014). To train the CNN, this step was repeated for 50 epochs. Moreover, cross-entropy loss as an error function and Adam optimizer (betas 0.9 and 0.999, epsilon 1e−8) were applied. A learning rate scheduler was included to monitor the training effects. In the case of no training, progress over 5 epochs reduced the learning rate (factor 0.1).
To accelerate the training process of the CNN, an open-source neural network with pretrained weights was used (MobileNetV2 pretrained on ImageNet, Stanford Vision and Learning Lab, Stanford University). This step enabled the transfer of existing learning to recognize basic structures in the existing image set more efficiently. The training of the CNN was performed on a server at the university-based data center with the following specifications: Tesla GPU V100 SXM2 16 GB (Nvidia), Xeon CPU E5-2630 (Intel Corp.), and 24 GB RAM.
Determination of the Diagnostic Performance
The training of the CNN was repeated 4 times. In each run, 25%, 50%, 75%, and 100% of the training data were used (random selection), and each time, the resulting model was evaluated on the test set. This allowed an evaluation of the model performance in relation to the amount of training data. It is noteworthy that the independent test set of images was always available for evaluating the diagnostic performance.
Statistical Analysis
The data were analyzed using R (http://www.r-project.org) and Python (http://www.python.org, version 3.7). The overall diagnostic accuracy (ACC = (TN + TP) / (TN + TP + FN + FP)) was determined by calculating the number of true positives (TPs), false positives (FPs), true negatives (TNs), and false negatives (FNs) after using 25%, 50%, 75%, and 100% images of the training data set. Furthermore, the sensitivity (SE), specificity (SP), positive and negative predictive values (PPV and NPV, respectively), and the area under the receiver operating characteristic (ROC) curve (AUC) were computed for the selected types of teeth and surfaces (Matthews and Farewell 2015). In addition, saliency maps were plotted to identify image areas that were of importance for the CNN to make an individual decision. We calculated the saliency maps (Simonyan et al. 2014) by backpropagating the prediction of the CNN and visualized the gradient of the input on the resized images (224 × 224 pixels).
Results
In the present work, it was shown that the CNN was able to correctly classify caries in 92.5% of the images when all the included images were considered (Table 1). For caries-related cavitation detection, 93.3% of all tooth surfaces could be correctly classified (Table 2). In addition, diagnostic performance was calculated for each of the caries classes (Table 3); here it was shown that the accuracy was found to be highest for caries-free surfaces (accuracy of 90.6%), followed by noncavitated caries lesions (85.2%) and cavitated caries lesions (79.5%).
Table 1.
Overview of the Model Performance of the Convolutional Neural Network When the Independent Test Set (n = 479 with 180 Healthy Tooth Surfaces, 216 Noncavitated Carious Lesions, and 83 Cavitations) Was Used for Overall Caries Detection.
| True Positives | True Negatives | False Positives | False Negatives | Diagnostic Performance | ||||||||||
|---|---|---|---|---|---|---|---|---|---|---|---|---|---|---|
| Overall Caries Detection | n | % | n | % | n | % | n | % | ACC | SE | SP | NPV | PPV | AUC |
| Results from all the included teeth and surfaces (n = 479 test images) | ||||||||||||||
| 25% of the images | 156 | 32.6 | 258 | 53.8 | 24 | 5.0 | 41 | 8.6 | 86.4 | 79.2 | 91.5 | 86.7 | 86.3 | 0.924 |
| 50% of the images | 148 | 30.9 | 280 | 58.4 | 32 | 6.7 | 19 | 4.0 | 89.4 | 88.6 | 89.7 | 82.2 | 93.6 | 0.950 |
| 75% of the images | 159 | 33.2 | 276 | 57.6 | 21 | 4.4 | 23 | 4.8 | 90.8 | 87.4 | 92.9 | 88.3 | 92.3 | 0.955 |
| 100% of the images | 163 | 34.0 | 280 | 58.5 | 17 | 3.5 | 19 | 4.0 | 92.5 | 89.6 | 94.3 | 90.6 | 93.6 | 0.964 |
| Results from anterior surfaces—incisors/canines (n = 153 test images) | ||||||||||||||
| 25% of the images | 63 | 41.2 | 65 | 42.5 | 4 | 2.6 | 21 | 13.7 | 83.7 | 75.0 | 94.2 | 94.0 | 75.6 | 0.911 |
| 50% of the images | 59 | 38.6 | 79 | 51.6 | 8 | 5.2 | 7 | 4.6 | 90.2 | 89.4 | 90.8 | 88.1 | 91.9 | 0.953 |
| 75% of the images | 64 | 41.8 | 73 | 47.7 | 3 | 2.0 | 13 | 8.5 | 89.5 | 83.1 | 96.1 | 95.5 | 84.9 | 0.947 |
| 100% of the images | 64 | 41.8 | 80 | 52.3 | 3 | 2.0 | 6 | 3.9 | 94.1 | 91.4 | 96.4 | 95.5 | 93.0 | 0.965 |
| Results from posterior surfaces—molars/premolars (n = 326 test images) | ||||||||||||||
| 25% of the images | 93 | 28.6 | 193 | 59.2 | 20 | 6.1 | 20 | 6.1 | 87.7 | 82.3 | 90.6 | 82.3 | 90.6 | 0.932 |
| 50% of the images | 89 | 27.3 | 201 | 61.6 | 24 | 7.4 | 12 | 3.7 | 89.0 | 88.1 | 89.3 | 78.8 | 94.4 | 0.945 |
| 75% of the images | 95 | 29.1 | 203 | 62.3 | 18 | 5.5 | 10 | 3.1 | 91.4 | 90.5 | 91.9 | 84.1 | 95.3 | 0.961 |
| 100% of the images | 99 | 30.4 | 200 | 61.3 | 14 | 4.3 | 13 | 4.0 | 91.7 | 88.4 | 93.5 | 87.6 | 93.9 | 0.964 |
| Results from vestibular and oral surfaces—anterior/posterior teeth (n = 225 test images) | ||||||||||||||
| 25% of the images | 65 | 28.9 | 126 | 56.0 | 8 | 3.6 | 26 | 11.5 | 84.9 | 71.4 | 94.0 | 89.0 | 82.9 | 0.910 |
| 50% of the images | 62 | 27.6 | 143 | 63.5 | 11 | 4.9 | 9 | 4.0 | 91.1 | 87.3 | 92.9 | 84.9 | 94.1 | 0.954 |
| 75% of the images | 67 | 29.8 | 137 | 60.9 | 6 | 2.7 | 15 | 6.6 | 90.7 | 81.7 | 95.8 | 91.8 | 90.1 | 0.952 |
| 100% of the images | 67 | 29.8 | 142 | 63.1 | 6 | 2.7 | 10 | 4.4 | 92.9 | 87.0 | 95.9 | 91.8 | 93.4 | 0.964 |
| Results from occlusal surfaces—molars/premolars (n = 253 test images) | ||||||||||||||
| 25% of the images | 91 | 36.0 | 131 | 51.8 | 16 | 6.3 | 15 | 5.9 | 87.7 | 85.8 | 89.1 | 85.0 | 89.7 | 0.943 |
| 50% of the images | 86 | 34.0 | 136 | 53.7 | 21 | 8.3 | 10 | 4.0 | 87.7 | 89.6 | 86.6 | 80.4 | 93.2 | 0.949 |
| 75% of the images | 92 | 36.4 | 138 | 54.5 | 15 | 5.9 | 8 | 3.2 | 90.9 | 92.0 | 90.2 | 86.0 | 94.5 | 0.961 |
| 100% of the images | 96 | 37.9 | 137 | 54.2 | 11 | 4.3 | 9 | 3.6 | 92.1 | 91.4 | 92.6 | 89.7 | 93.8 | 0.968 |
The calculations were performed for different types of teeth, surfaces, and training steps, which resulted in different subsamples.
ACC, accuracy; AUC, area under the receiver operating characteristic curve; SE, sensitivity; SP, specificity; NPV, negative predictive value; PPV, positive predictive value.
Table 2.
Overview of the Model Performance of the Convolutional Neural Network When the Independent Test Set (n = 479 with 180 Healthy Tooth Surfaces, 216 Noncavitated Carious Lesions, and 83 Cavitations) Was Used for Detection of Cavitations.
| True Positives | True Negatives | False Positives | False Negatives | Diagnostic Performance | ||||||||||
|---|---|---|---|---|---|---|---|---|---|---|---|---|---|---|
| Detection of Cavitation | n | % | n | % | n | % | n | % | ACC | SE | SP | NPV | PPV | AUC |
| Results from all the included teeth and surfaces (n = 479 test images) | ||||||||||||||
| 25% of the images | 382 | 79.7 | 53 | 11.1 | 14 | 2.9 | 30 | 6.3 | 90.8 | 92.7 | 79.1 | 96.5 | 63.9 | 0.916 |
| 50% of the images | 381 | 79.6 | 61 | 12.7 | 15 | 3.1 | 22 | 4.6 | 92.3 | 94.5 | 80.3 | 96.2 | 73.5 | 0.931 |
| 75% of the images | 382 | 79.8 | 61 | 12.7 | 14 | 2.9 | 22 | 4.6 | 92.5 | 94.6 | 81.3 | 96.5 | 73.5 | 0.948 |
| 100% of the images | 381 | 79.5 | 66 | 13.8 | 15 | 3.1 | 17 | 3.6 | 93.3 | 95.7 | 81.5 | 96.2 | 79.5 | 0.955 |
| Results from anterior surfaces—incisors/canines (n = 153 test images) | ||||||||||||||
| 25% of the images | 106 | 69.3 | 23 | 15.0 | 7 | 4.6 | 17 | 11.1 | 84.3 | 86.2 | 76.7 | 93.8 | 57.5 | 0.887 |
| 50% of the images | 108 | 70.6 | 29 | 18.9 | 5 | 3.3 | 11 | 7.2 | 89.5 | 90.8 | 85.3 | 95.6 | 72.5 | 0.916 |
| 75% of the images | 109 | 71.2 | 27 | 17.7 | 4 | 2.6 | 13 | 8.5 | 88.9 | 89.3 | 87.1 | 96.5 | 67.5 | 0.932 |
| 100% of the images | 109 | 71.2 | 33 | 21.6 | 4 | 2.6 | 7 | 4.6 | 92.8 | 94.0 | 89.2 | 96.5 | 82.5 | 0.951 |
| Results from posterior surfaces—molars/premolars (n = 326 test images) | ||||||||||||||
| 25% of the images | 276 | 84.7 | 30 | 9.2 | 7 | 2.1 | 13 | 4.0 | 93.9 | 95.5 | 81.1 | 97.5 | 69.8 | 0.941 |
| 50% of the images | 273 | 83.7 | 32 | 9.8 | 10 | 3.1 | 11 | 3.4 | 93.6 | 96.1 | 76.2 | 96.5 | 74.4 | 0.932 |
| 75% of the images | 273 | 83.7 | 34 | 10.4 | 10 | 3.1 | 9 | 2.8 | 94.2 | 96.8 | 77.3 | 96.5 | 79.1 | 0.967 |
| 100% of the images | 272 | 83.4 | 33 | 10.1 | 11 | 3.4 | 10 | 3.1 | 93.6 | 96.5 | 75.0 | 96.1 | 76.7 | 0.957 |
| Results from vestibular and oral surfaces—anterior/posterior teeth (n = 225 test images) | ||||||||||||||
| 25% of the images | 155 | 68.9 | 39 | 17.3 | 12 | 5.3 | 19 | 8.5 | 86.2 | 89.1 | 76.5 | 92.8 | 67.2 | 0.884 |
| 50% of the images | 156 | 69.3 | 43 | 19.1 | 11 | 4.9 | 15 | 6.7 | 88.4 | 91.2 | 79.6 | 93.4 | 74.1 | 0.923 |
| 75% of the images | 160 | 71.1 | 41 | 18.2 | 7 | 3.1 | 17 | 7.6 | 89.3 | 90.4 | 85.4 | 95.8 | 70.7 | 0.937 |
| 100% of the images | 159 | 70.7 | 47 | 20.9 | 8 | 3.5 | 11 | 4.9 | 91.6 | 93.5 | 85.5 | 95.2 | 81.0 | 0.943 |
| Results from occlusal surfaces—molars/premolars (n = 253 test images) | ||||||||||||||
| 25% of the images | 227 | 89.7 | 13 | 5.1 | 2 | 0.8 | 11 | 4.4 | 94.9 | 95.4 | 86.7 | 99.1 | 54.2 | 0.939 |
| 50% of the images | 225 | 88.9 | 17 | 6.7 | 4 | 1.6 | 7 | 2.8 | 95.7 | 97.0 | 81.0 | 98.3 | 70.8 | 0.914 |
| 75% of the images | 222 | 87.7 | 19 | 7.5 | 7 | 2.8 | 5 | 2.0 | 95.3 | 97.8 | 73.1 | 96.9 | 79.2 | 0.962 |
| 100% of the images | 222 | 87.7 | 18 | 7.1 | 7 | 2.8 | 6 | 2.4 | 94.9 | 97.4 | 72.0 | 96.9 | 75.0 | 0.966 |
The calculations were performed for different types of teeth, surfaces, and training steps, which resulted in different subsamples.
ACC, accuracy; AUC, area under the receiver operating characteristic curve; SE, sensitivity; SP, specificity; NPV, negative predictive value; PPV, positive predictive value.
Table 3.
Overview of the Model Performance of the Convolutional Neural Network in Relation to the Main Diagnostic Classes from the Independent Test Set (n = 479).
| True Positives | True Negatives | False Positives | False Negatives | Diagnostic Performance | ||||||||||
|---|---|---|---|---|---|---|---|---|---|---|---|---|---|---|
| Detection of Cavitation | n | % | n | % | n | % | n | % | ACC | SE | SP | NPV | PPV | AUC |
| Results from caries-free teeth or surfaces (n = 180 test images) | ||||||||||||||
| 25% of the images | 156 | 86.7 | 0 | 0.0 | 0 | 0.0 | 24 | 13.3 | 86.7 | 86.7 | UC | 0.0 | 100.0 | UC |
| 50% of the images | 148 | 82.2 | 0 | 0.0 | 0 | 0.0 | 32 | 17.8 | 82.2 | 82.2 | UC | 0.0 | 100.0 | UC |
| 75% of the images | 159 | 88.3 | 0 | 0.0 | 0 | 0.0 | 21 | 11.7 | 88.3 | 88.3 | UC | 0.0 | 100.0 | UC |
| 100% of the images | 163 | 90.6 | 0 | 0.0 | 0 | 0.0 | 17 | 9.4 | 90.6 | 90.6 | UC | 0.0 | 100.0 | UC |
| Results from noncavitated caries lesions (n = 216 test images) | ||||||||||||||
| 25% of the images | 170 | 78.7 | 0 | 0.0 | 0 | 0.0 | 46 | 21.3 | 78.7 | 78.7 | UC | 0.0 | 100.0 | UC |
| 50% of the images | 187 | 86.6 | 0 | 0.0 | 0 | 0.0 | 29 | 13.4 | 86.6 | 86.6 | UC | 0.0 | 100.0 | UC |
| 75% of the images | 183 | 84.7 | 0 | 0.0 | 0 | 0.0 | 33 | 15.3 | 84.7 | 84.7 | UC | 0.0 | 100.0 | UC |
| 100% of the images | 184 | 85.2 | 0 | 0.0 | 0 | 0.0 | 32 | 14.8 | 85.2 | 85.2 | UC | 0.0 | 100.0 | UC |
| Results from cavitated caries lesions (n = 83 test images) | ||||||||||||||
| 25% of the images | 53 | 63.9 | 0 | 0.0 | 0 | 0.0 | 30 | 36.1 | 63.9 | 63.9 | UC | 0.0 | 100.0 | UC |
| 50% of the images | 61 | 73.5 | 0 | 0.0 | 0 | 0.0 | 22 | 26.5 | 73.5 | 73.5 | UC | 0.0 | 100.0 | UC |
| 75% of the images | 61 | 73.5 | 0 | 0.0 | 0 | 0.0 | 22 | 26.5 | 73.5 | 73.5 | UC | 0.0 | 100.0 | UC |
| 100% of the images | 66 | 79.5 | 0 | 0.0 | 0 | 0.0 | 17 | 20.5 | 79.5 | 79.5 | UC | 0.0 | 100.0 | UC |
The calculations included all types of teeth or surfaces, which were classified into each diagnostic category by the independent expert evaluation. As the reference standard served as selection criteria, true-negative and false-positive rates appear as zero values and, in consequence, SP and AUC became uncalculable.
ACC, accuracy; AUC, area under the receiver operating characteristic curve; SE, sensitivity; SP, specificity; NPV, negative predictive value; PPV, positive predictive value; UC, uncalculable.
The following results can be seen when comparing the model metrics. First, the CNN was able to achieve a high model performance in the detection of caries and cavities; this situation is particularly evident in the high AUC values (Tables 1–3 and Fig. 1), which were found to be more favorable for overall caries detection. Second, in the case of caries detection, the SP values were mostly higher than the SE values (Table 1), whereas this tendency could not be confirmed in the case of cavitation detection (Table 2). Third, the diagnostic parameters varied slightly according to the considered tooth surfaces or groups of teeth. Fourth, the correct classification of healthy surfaces performed better in comparison to diseased ones (Table 3).
Figure 1.
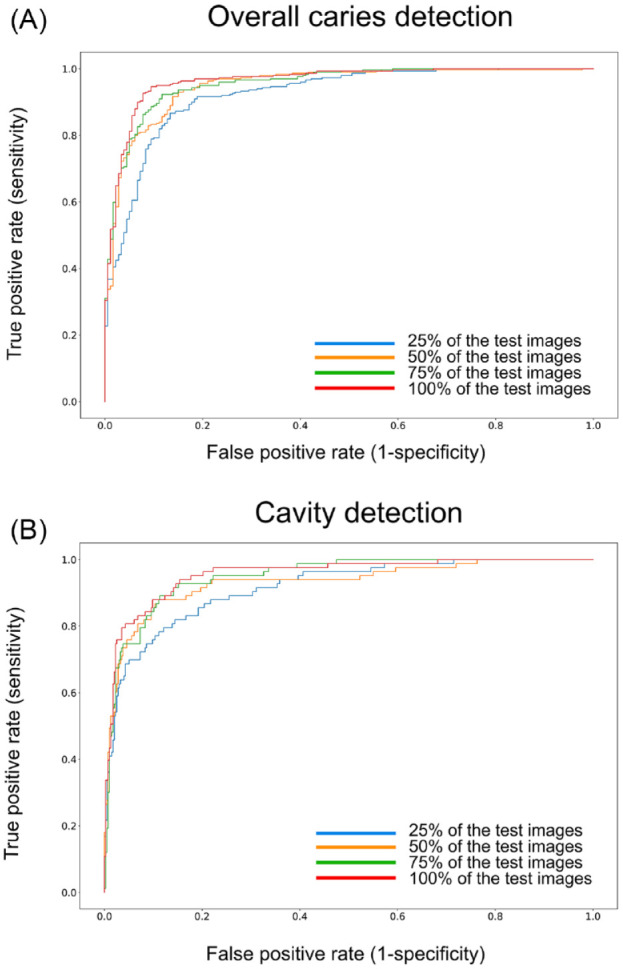
The receiver operating characteristic curves (ROC) illustrate the model performance of the convolutional neural network. Performance is shown for overall caries detection (A) and cavity detection (B) when 25%, 50%, 75%, and 100% of all training images were used. This figure is available in color online.
When viewing the result of interim evaluations for 25%, 50%, 75%, or 100% of all the available images (Tables 1–3), it became obvious that an overall agreement of approximately 80% could be achieved with 25% of the available training data. By using half of the available images, the parameters of the diagnostic performance could generally be increased to approximately 90%. The inclusion of the remaining images was accompanied by smaller improvements (Tables 1–3). The saliency maps (Fig. 2) illustrate which image areas the CNN used for decision making. Interestingly, in most of the randomly selected cases, the CNN predominately used thecaries-affected sites.
Figure 2.
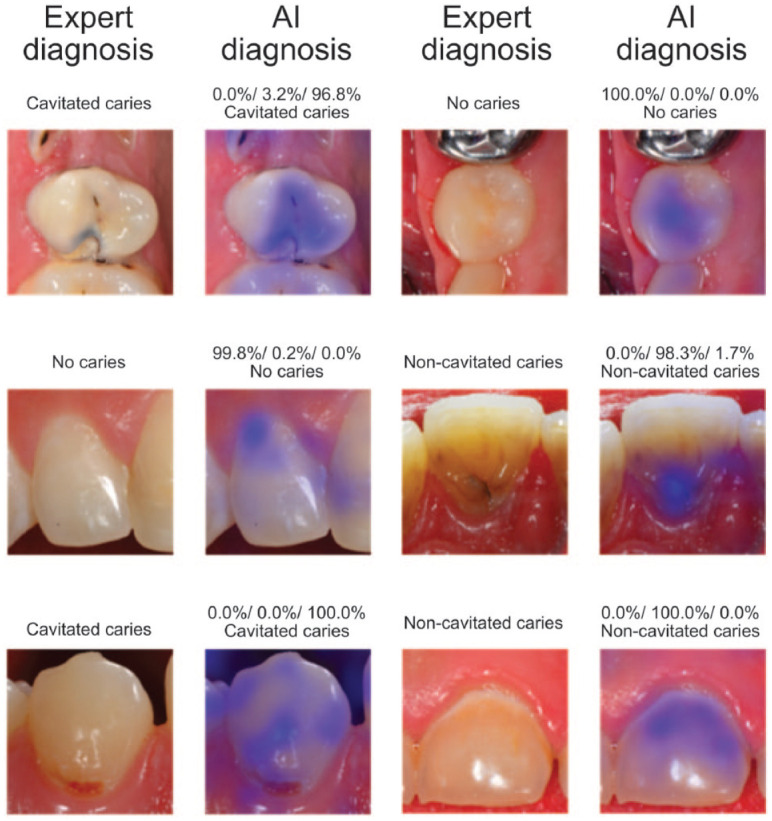
Example clinical images and the corresponding test results by the artificial intelligence (AI) algorithms. Furthermore, the illustration includes saliency maps that visualize those image areas (in blue) that were used for decision-making by the convolutional neural network. This figure is available in color online.
Discussion
In the present diagnostic study, it was demonstrated that AI algorithms are able to detect caries and caries-related cavities on machine-readable intraoral photographs with an accuracy of at least 90%. Thus, the intended study goal was achieved. In addition, a web tool for independent evaluation of the AI algorithm by dental researchers was developed. Our approach also offers interesting potential for future clinical applications: carious lesions could be captured with intraoral cameras and evaluated almost simultaneously and independently from dentists to provide additional diagnostic information.
The present work is part of the latest efforts to evaluate diagnostic images automatically using AI methods. The most advanced AI method seems to be caries detection on dental X-rays. Lee et al. (2018b) evaluated 3,000 apical radiographs using a deep learning–based CNN and achieved accuracies of well over 80%, and their AUC values varied between 0.845 and 0.917. Cantu et al. (2020) assessed 3,293 bitewing radiographs and reached a diagnostic accuracy of 80%. If these data were compared with the methodology and results of the present study (Tables 1–3), both the number of images used and the documented diagnostic performance were essentially identical.
Nevertheless, the results achieved (Tables 1–3, Figs. 1 and 2) must be critically evaluated. It should be highlighted that our study provided data for the caries and cavitation detection level (Tables 1 and 2). Both categories are of clinical relevance in daily routine and linked with divergent management strategies (Schwendicke, Splieth, et al. 2019). Another unique feature was the determination of the diagnostic accuracy for each of the included categories (Table 3). Here, it became obvious that especially cavities were detected with a lower accuracy by the CNN in comparison to healthy tooth surfaces or noncavitated caries lesions. This detail could not be taken from the overall analysis (Tables 1 and 2) and justified its consideration. Another methodological issue needs to be discussed: the use of standardized, high-quality, single-tooth photographs that will not be typically captured under daily routines. It can be hypothesized that the use of different image types with divergent resolutions, compression rates, or formats may affect the diagnostic outcome (Dodge and Karam 2016; Dziugaite et al. 2016; Koziarski and Cyganek 2018). In addition, it must be mentioned that the image material used included only healthy tooth surfaces and caries of various lesion stages. Cases with developmental defects, fissure sealants, fillings, or indirect restorations were excluded in this project phase to allow unbiased learning by the CNN. Consequently, these currently excluded dental conditions need to be trained separately. Furthermore, the high quality of the usable image material certainly had a positive influence on the results achieved. All the included photographs were free of plaque, calculus, and saliva and were not over- or underexposed. Therefore, these methodological requirements, which are also in line with fundamental demands on an errorless clinical examination (Pitts 2009), led to a valid evaluation of the diagnostic accuracy efficacy (Fryback and Thornbury 1991) and probably contributed to the encouraging results (Figs. 1 and 2). Conversely, it needs to be mentioned that the AI algorithm requires further development under the inclusion of differential diagnoses and regular evaluation aiming at optimizing and documenting its quality, respectively. In addition, its potential application under clinical conditions needs to be critically discussed in relation to the simple facts that perfect examination conditions cannot be consistently safeguarded in daily dental practice and that AI-based diagnoses have to be critically judged by professionals. The remaining and important tasks—risk and activity assessment, consideration of possible treatment options, and consenting an individual health care strategy with the patient—still need clinical evaluations and can hardly be replaced by AI algorithms so far. Nevertheless, a future real-time diagnostic assistance system may be beneficial for daily dental practice but requires from today’s point of view a consistent further development of the initial work.
From the methodological point of view, the choice of single-tooth pictures may benefit the optimal learning of the AI algorithm since disturbing factors such as margins or adjacent teeth were almost excluded. It is expected that the transfer of the algorithms to other image formats (e.g., images from quadrants, complete upper/lower jaws, or images captured with intraoral cameras) will be associated with a lower diagnostic accuracy. Conversely, it can be hypothetically assumed that an initially more precise CNN will later be more reliable for more complex images. Furthermore, the model performance depends on the annotator’s reference decision and cannot provide better results than the expert. This highlights the importance of the annotator’s diagnostic ability to classify dental pathologies correctly. In the present study, only 1 experienced clinical scientist made all diagnostic decisions, which must be considered a potential source of bias. This aspect can be controversially debated, especially if the inclusion of other less experienced or independent annotators can potentially increase the trustworthiness of dental decisions and the resulting model performance. Nevertheless, reliability issues are of high relevance, and we consider forming an expert panel controlling and finally consenting diagnostic decisions in future projects.
Regarding the previously mentioned aspects, it becomes clear that automated detection of caries or other pathological findings requires a methodologically well-structured approach (Schwendicke et al. 2021). In this context, it should be noted that the documented model performance increased steadily with each additional training cycle. However, at a certain point, at least ~50% of the images used in the present analysis could no longer be substantially improved with the available source of images and classification approach (Tables 1–3). This indicates that a data saturation effect does exist, and further improvements can be expected by the inclusion of an exponentially larger number of images only. Here, the overall number of included images must be considered crucial. At its best, several thousand photographs from different teeth or surfaces as well as lesion types should be available. This supports the assumption that the pool of images used represents probably the minimum amount for the training of AI algorithms. Furthermore, it needs to be referred to the class imbalance in the used image sample with an underrepresentation of cavitation, which affects the training and test set. As a result, the model metrics might be biased, which was linked to a limited training of the CNN and a lower diagnostic performance for this category in comparison to healthy surfaces or noncavitated caries lesions (Table 3). In general, this aspect supports the need to increase continuously the data set and to provide a wide range of caries lesions from all teeth, surfaces, and caries lesion types. Otherwise, the developed AI algorithms cannot be generalized. The long-term goal should be to achieve close to perfect accuracy in caries classification on the basis of several thousand intraoral photographs using an AI method.
Future strategies to improve AI-based caries detection on intraoral images should consider image segmentation as an alternative method, which has to be conducted by well-trained and calibrated dental professionals under supervision of senior experts. For this purpose, it is necessary to mark caries lesions pixel by pixel on each available image and to reassess the diagnostic accuracy. This more precise but otherwise time- and resource-intensive approach offers a detailed caries localization in comparison to the presently used classification model.
Conclusion
The clinical application of AI methods might potentially become feasible in the future but requires more fundamental research to overcome existing limitations and has to consider relevant differential diagnostic findings. Based on the present work, it can be concluded that it was possible to achieve more than 90% agreement under ideal conditions in caries detection using intraoral photographs with a trained CNN. We hypothesize that the results can be further improved, first, by inclusion of more images and, second, by use of accurate image segmentation. In addition, further pathological findings, such as developmental defects or dental restorations, must also be considered when using clinical photographs as a potential machine-readable source of information for diagnostic purposes.
Author Contributions
J. Kühnisch, O. Meyer, M. Hesenius, contributed to conception, design, data acquisition, analysis, and interpretation, drafted and critically revised the manuscript; R. Hickel, V. Gruhn, contributed to conception and data interpretation, drafted and critically revised the manuscript. All authors gave final approval and agree to be accountable for all aspects of the work.
Footnotes
The developed AI algorithm is available as a web application. Please visit https://dental-ai.de. Those interested in our software solutions should contact the author group.
Declaration of Conflicting Interests: The authors declared no potential conflicts of interest with respect to the research, authorship, and/or publication of this article.
Funding: The authors received no financial support for the research, authorship, and/or publication of this article.
ORCID iD: J. Kühnisch  https://orcid.org/0000-0003-4063-2291
References
- Askar H, Krois J, Rohrer C, Mertens S, Elhennawy K, Ottolenghi L, Mazur M, Paris S, Schwendicke F. 2021. Detecting white spot lesions on dental photography using deep learning: a pilot study. J Dent. 107:103615. [DOI] [PubMed] [Google Scholar]
- Bejnordi BE, Litjens G, van der Laak JA. 2018. Machine learning compared with pathologist assessment—reply. JAMA. 319(16):1726. [DOI] [PubMed] [Google Scholar]
- Bianco S, Cadene R, Celona L, Napoletano P. 2018. Benchmark analysis of representative deep neural network architectures. IEEE Access. 6:64270–64277. [Google Scholar]
- Bossuyt PM, Reitsma JB, Bruns DE, Gatsonis CA, Glasziou PP, Irwig L, Lijmer JG, Moher D, Rennie D, de Vet HC, et al.; STARD Group. 2015. STARD 2015: an updated list of essential items for reporting diagnostic accuracy studies. BMJ. 351:h5527. [DOI] [PMC free article] [PubMed] [Google Scholar]
- Cantu AG, Gehrung S, Krois J, Chaurasia A, Rossi JG, Gaudin R, Elhennawy K, Schwendicke F. 2020. Detecting caries lesions of different radiographic extension on bitewings using deep learning. J Dent. 100:103425. [DOI] [PubMed] [Google Scholar]
- Casalegno F, Newton T, Daher R, Abdelaziz M, Lodi-Rizzini A, Schürmann F, Krejci I, Markram H. 2019. Caries detection with near-infrared transillumination using deep learning. J Dent Res. 98(11):1227–1233. [DOI] [PMC free article] [PubMed] [Google Scholar]
- Dodge S, Karam L. 2016. Understanding how image quality affects deep neural networks. arXiv preprint: 1604.04004 [accessed 2021 July 26]; https://arxiv.org/abs/1604.04004.
- Dziugaite GK, Ghahramani Z, Roy DM. 2016. A study of the effect of JPG compression on adversarial images. arXiv preprint: 1608.00853 [accessed 2021 July 26]; https://arxiv.org/abs/1608.00853.
- Ekstrand KR. 2004. Improving clinical visual detection—potential for caries clinical trials. J Dent Res. 83(Spec No C):C67–C71. [DOI] [PubMed] [Google Scholar]
- Ekstrand KR, Gimenez T, Ferreira FR, Mendes FM, Braga MM. 2018. The international caries detection and assessment system—ICDAS: a systematic review. Caries Res. 52(5):406–419. [DOI] [PubMed] [Google Scholar]
- Ekstrand KR, Ricketts DN, Kidd EA. 1997. Reproducibility and accuracy of three methods for assessment of demineralization depth of the occlusal surface: an in vitro examination. Caries Res. 31(3):224–231. [DOI] [PubMed] [Google Scholar]
- Fryback DG, Thornbury JR. 1991. The efficacy of diagnostic imaging. Med Decis Making. 11(2):88–94. [DOI] [PubMed] [Google Scholar]
- Geetha V, Aprameya KS, Hinduja DM. 2020. Dental caries diagnosis in digital radiographs using back-propagation neural network. Health Inf Sci Syst. 8(1):8. [DOI] [PMC free article] [PubMed] [Google Scholar]
- Gimenez T, Piovesan C, Braga MM, Raggio DP, Deery C, Ricketts DN, Ekstrand KR, Mendes FM. 2015. Visual inspection for caries detection: a systematic review and meta-analysis. J Dent Res. 94(7):895–904. [DOI] [PubMed] [Google Scholar]
- Heitmüller D, Thiering E, Hoffmann U, Heinrich J, Manton D, Kühnisch J, Neumann C, Bauer CP, Heinrich-Weltzien R, Hickel R; GINIplus Study Group. 2013. Is there a positive relationship between molar-incisor-hypomineralisations and the presence of dental caries? Int J Paediatr Dent. 23:116–124. [DOI] [PubMed] [Google Scholar]
- Kapor S, Rankovic MJ, Khazaei Y, Crispin A, Schüler I, Krause F, Lussi A, Neuhaus K, Eggmann F, Michou S, et al. 2021. Systematic review and meta-analysis of diagnostic methods for occlusal surface caries. Clin Oral Invest [epub ahead of print 14 Jun 2021]. doi: 10.1007/s00784-021-04024-1 [DOI] [PMC free article] [PubMed] [Google Scholar]
- Khan HA, Haider MA, Ansari HA, Ishaq H, Kiyani A, Sohail K, Muhammad M, Khurram SA. 2020. Automated feature detection in dental periapical radiographs by using deep learning. Oral Surg Oral Med Oral Pathol Oral Radiol. 131(6):711–720. [DOI] [PubMed] [Google Scholar]
- Koziarski M, Cyganek B. 2018. Impact of low resolution on image recognition with deep neural networks: an experimental study. Int J Appl Math Comput Sci 28(4):735–744. [Google Scholar]
- Kühnisch J, Bücher K, Henschel V, Albrecht A, Garcia-Godoy F, Mansmann U, Hickel R, Heinrich-Weltzien R. 2011. Diagnostic performance of the Universal Visual Scoring System (UniViSS) on occlusal surfaces. Clin Oral Invest. 15(2):215–223. [DOI] [PubMed] [Google Scholar]
- Kühnisch J, Goddon I, Berger S, Senkel H, Bücher K, Oehme T, Hickel R, Heinrich-Weltzien R. 2009. Development, methodology and potential of the new universal visual scoring system (UniViSS) for caries detection and diagnosis. Int J Environ Res Public Health. 6(9):2500–2509. [DOI] [PMC free article] [PubMed] [Google Scholar]
- Lee JH, Kim DH, Jeong SN, Choi SH. 2018. a. Diagnosis and prediction of periodontally compromised teeth using a deep learning–based convolutional neural network algorithm. J Periodontal Implant Sci. 48(2):114–123. [DOI] [PMC free article] [PubMed] [Google Scholar]
- Lee JH, Kim DH, Jeong SN, Choi SH. 2018. b. Detection and diagnosis of dental caries using a deep learning-based convolutional neural network algorithm. J Dent. 77:106–111. [DOI] [PubMed] [Google Scholar]
- Litzenburger F, Heck K, Pitchika V, Neuhaus KW, Jost FN, Hickel R, Jablonski-Momeni A, Welk A, Lederer A, Kühnisch J. 2018. Inter-and intraexaminer reliability of bitewing radiography and near-infrared light transillumination for proximal caries detection and assessment. Dentomaxillofac Radiol. 47(3):20170292. [DOI] [PMC free article] [PubMed] [Google Scholar]
- Matthews DE, Farewell VT. 2015. Using and understanding medical statistics. 5th revised and extended edition. Oxford, UK: Karger. [Google Scholar]
- Moutselos K, Berdouses E, Oulis C, Maglogiannis I. 2019. Recognizing occlusal caries in dental intraoral images using deep learning. Annu Int Conf IEEE Eng Med Biol Soc. 2019:1617–1620. [DOI] [PubMed] [Google Scholar]
- Nyvad B, Machiulskiene V, Baelum V. 1999. Reliability of a new caries diagnostic system differentiating between active and inactive caries lesions. Caries Res. 33(4):252–260. [DOI] [PubMed] [Google Scholar]
- Park WJ, Park JB. 2018. History and application of artificial neural networks in dentistry. Eur J Dent 12(4):594–601. [DOI] [PMC free article] [PubMed] [Google Scholar]
- Pitts N. 2009. Implementation. Improving caries detection, assessment, diagnosis and monitoring. Monogr Oral Sci. 21:199–208. [DOI] [PubMed] [Google Scholar]
- Sandler M, Howard A, Zhu M, Zhmoginov A, Chen LC. 2018. Mobilenetv2: inverted residuals and linear bottlenecks. The IEEE Conference on Computer Vision and Pattern Recognition (CVPR). arXiv preprint: 1801.04381v4 [accessed 2021 July 26]; https://ieeexplore.ieee.org/document/8578572. [Google Scholar]
- Schwendicke F, Elhennawy K, Paris S, Friebertshäuser P, Krois J. 2020. Deep learning for caries lesion detection in near-infrared light transillumination images: a pilot study. J Dent. 92:103260. [DOI] [PubMed] [Google Scholar]
- Schwendicke F, Golla T, Dreher M, Krois J. 2019. Convolutional neural networks for dental image diagnostics: a scoping review. J Dent. 91:103226. [DOI] [PubMed] [Google Scholar]
- Schwendicke F, Samek W, Krois J. 2020. Artificial intelligence in dentistry: chances and challenges. J Dent Res. 99(7):769–774. [DOI] [PMC free article] [PubMed] [Google Scholar]
- Schwendicke F, Singh T, Lee JH, Gaudin R, Chaurasia A, Wiegand T, Uribe S, Krois J; IADR E-Oral Health Network and the ITU WHO Focus Group AI for Health. 2021. Artificial intelligence in dental research: checklist for authors, reviewers, readers. J Dent. 107:103610.33631303 [Google Scholar]
- Schwendicke F, Splieth C, Breschi L, Banerjee A, Fontana M, Paris S, Burrow MF, Crombie F, Page LF, Gatón-Hernández P, et al. 2019. When to intervene in the caries process? An expert Delphi consensus statement. Clin Oral Invest. 23(10):3691–3703. [DOI] [PubMed] [Google Scholar]
- Simonyan K, Vedaldi A, Zisserman A. 2014. Deep inside convolutional networks: visualising image classification models and saliency maps. arXiv preprint: 1312.6034v2 [accessed 2021 July 26]; https://arxiv.org/abs/1312.6034.
- Srivastava N, Hinton G, Krizhevsky A, Sutskever I, Salakhutdinov R. 2014. Dropout: a simple way to prevent neural networks from overfitting.J Machine Learn Res. 15:1929−1958. [Google Scholar]
- World Health Organization (WHO). 2013. Oral health surveys: basic methods. 5th ed. Geneva, Switzerland: WHO. [Google Scholar]