Abstract
In a tumour microenvironment, tumour-associated neutrophils could display two opposing differential phenotypes: anti-tumour (N1) and pro-tumour (N2) effector cells. Converting N2 to N1 neutrophils provides innovative therapies for cancer treatment. In this study, a mathematical model for N1-N2 dynamics describing the cancer survival and immune inhibition in response to TGF-β and IFN-β is considered. The effects of exogenous intervention of TGF-β inhibitor and IFN-β are examined in order to enhance N1 recruitment to combat tumour progression. Our approach employs optimal control theory to determine drug infusion protocols that could minimize tumour volume with least administration cost possible. Four optimal control scenarios corresponding to different therapeutic strategies are explored, namely, TGF-β inhibitor control only, IFN-β control only, concomitant TGF-β inhibitor and IFN-β controls, and alternating TGF-β inhibitor and IFN-β controls. For each scheme, different initial conditions are varied to depict different pathophysiological condition of a cancer patient, leading to adaptive treatment schedule. TGF-β inhibitor and IFN-β drug dosages, total drug amount, infusion times and relative cost of drug administrations are obtained under various circumstances. The control strategies achieved could guide in designing individualized therapeutic protocols.
Keywords: tumour-associated neutrophils, TGF-beta, IFN-beta, optimal control, tumour growth, mathematical model
1. Introduction
Cancer is the leading cause of death worldwide [1,2]. Various immune cells including neutrophils [3], natural killer (NK) cells [4] and macrophages [5] in tumour microenvironment (TME) play a major role in regulation of tumour growth and anti-tumour treatment in many cancers including lung cancers. Copious neutrophils in the blood constitute the first protection in innate immunity [6,7]. Approximately 1011 neutrophils are generated in the bone marrow and released into the blood circulation every day [8]. Neutrophil recruitment at sites of infection or injury is triggered by the release of pathogen- or damage-associated molecular patterns from invading microorganisms or damaged and/or dead cells, respectively [9]. The process of neutrophil extravasation comprises a complex multistep cascade that is tightly regulated by coordinated sequence of adhesive and migratory events [6,10]. Neutrophils undergo a series of mechanisms, including phagocytosis, and the development and regulation of neutrophil extracellular traps (NETs) [11]. Furthermore, neutrophils release proteinases into the surrounding tissue damaging the host [12], and produce cytokines and chemokines influencing inflammatory and immune responses [13,14].
Aside from the traditional antimicrobial functions, there is increasing evidence suggesting that tumour-associated neutrophils (TANs) play a major role in tumour progression from formation to malignant state [15–19]. Several clinical and laboratory studies have indicated that the presence of TANs has been assessed with poor prognosis in various tumours including metastatic melanoma [20], bronchoalveolar carcinoma [21], renal carcinoma [22], and head and neck squamous cell carcinoma (HNSCC) [23]. In these conditions, neutrophils exhibit a pro-tumour phenotype which is detrimental to the host. TME controls neutrophil recruitment and thus, TANs promote tumour progression. Hence, TANs display two differential phenotypes [15,16,24]: (i) an anti-tumourigenic role (called N1), and (ii) pro-tumour progression (called N2).
There is mounting evidence that the immunosuppressive cytokine TGF-β skews neutrophil differentiation towards N2 phenotype [24–26], while TGF-β inhibitor and type-1 IFN (α, β, ω) therapy are recognized to alter neutrophils toward the N1 phenotype [27,28]. Several studies have shown that IFN-β in tumour microenvironment interacts with key molecules in signalling pathways activating its functions to stimulate anti-tumour activities [29–32]. Therefore, normalization of TME by the N2→N1 transition can lead to better control of tumour growth. For example, injection of IFN-β [29,31,33–35] or TGF-β inhibitor such as galunisertib [36–40] and LY2109761 [41,42] can be a novel anti-tumour strategy due to their effective tumour killing and anti-tumour immune response [43,44].
Mathematical modelling is a valuable tool in providing information to understand the complex mechanisms and processes in cancer [45,46]. Models can generate theories and hypotheses on quantitative grounds and provide reasonable predictions that could aid scientists towards the next series of experiments [47]. Furthermore, mathematical modelling can help clinicians to evaluate tumour microenvironment and develop anti-tumour strategies [48–52]. In addition, in silico models could play a significant role in optimizing clinical trial design and patient stratification, suggesting different treatment modalities, and alter risk prognoses [53–59].
In this work, we consider the following variables in a mathematical model:
In this study, regulation of N1 and N2 TANs is explored through TGF-β inhibitor and IFN-β controls in the framework of optimal control theory having the objective of minimizing the tumour size with least drug administration cost. In particular, infusion scheme(s) accounting for the amount and frequency of administration is explored. Various initial N1 and N2 phenotypes are also considered to simulate individualized therapeutic regimen depending on current pathological conditions. Several control strategies including combination therapies are examined under different circumstances that could give the best clinical outcomes.
We found therapeutic regimen at regulating anti- and pro-tumoural neutrophil phenotypic states by means of four different administration modalities of a TGF-β inhibitor and IFN-β cytokine in lung cancer. The optimal control strategy predicts that, depending on pathological states, therapies may have to be adjusted accordingly to minimize adverse effects of drugs and its administration cost.
2. Methodology
2.1. Mathematical model
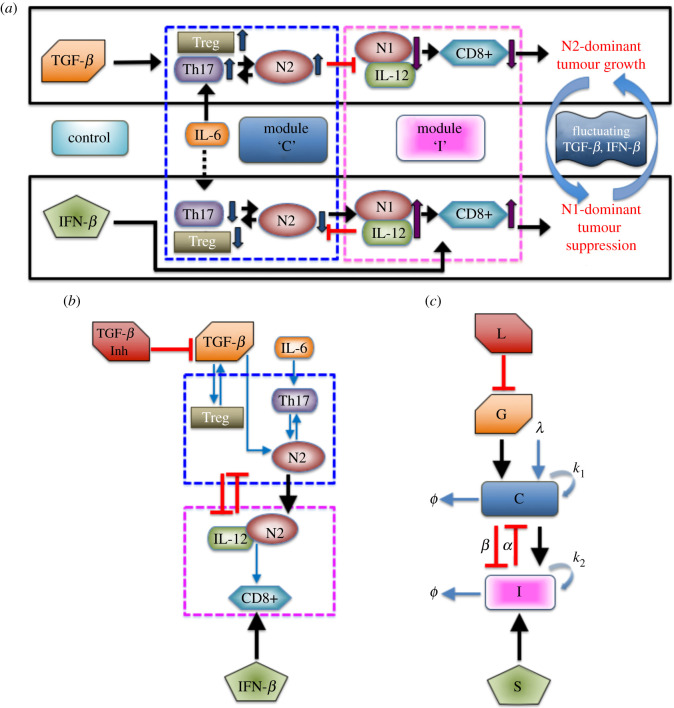
In order to understand the mutual interactions between a tumour and immune system involving tumour-associated neutrophils, a mathematical model of the signalling pathway for lung cancer is proposed in [60]. It consists of the basic network of interactions between cells, cytokines and growth factors. It was shown that IFN-β and TGF-β play a crucial function as tumour suppressor and tumour promoter (refer to figure 1a). High levels of TGF-β and low activities of IFN-β induce Treg infiltration generating inhibition of overall anti-tumour immune response of T cells. In addition, TGF-β alters the tumour microenvironment inducing polarization of neutrophil N1 into N2 type while IFN-β can polarize the N2 phenotype back to N1 phenotype [15,61]. The N2-dominant microenvironment contributes to enhance tumour growth. On the contrary, low TGF-β and high IFN-β levels reduce the neutrophil polarization toward N2 from N1 phenotype and enhance immune activities of T cells and N1 TANs, driving tumour suppression. For model simplification, the N2 regulatory network among Treg, Th17 and N2 cells is merged into one component denoted as N2 complex. On the other hand, the immunoregulatory system composed of N1 cells, interleukin IL-12 and CD8+, is incorporated into N1 complex. Further details of model development can be found in [60]. The associated dimensionless equations for complexes N2 (C), N1 (I) and tumour volume (T) is described by the following ordinary differential equations [60]:
| 2.1 |
with essential set of parameters listed in table 1. Here, two sources (IL-6, TGF-β) of the N2 complex are represented in the first and second terms in equation of C while the IFN-β-mediated source of the N1 complex is provided in the first term in equation of I. The third term in equation of C and second term in equation of I represent the mutual inhibition between N1 and N2, respectively. Tumour growth and N1-mediated tumour cell killing are represented in the first and second terms in equation of T, respectively. Finally, the decay process of the N1 and N2 complexes is represented in the last terms in equations of I and C, respectively.
Figure 1.
(a) N1 and N2 complexes regulate cancer survival and immune inhibition in the presence of TGF-β and IFN-β [60]. (b) Simplified model diagram of N1-N2 network dynamics with the inclusion of a TGF-β inhibitor acting as a control to the signalling pathway. (c) Schematic non-dimensional model including a TGF-β inhibitor (modified from [60]). Optimal control is applied to obtain appropriate L and S dosages that minimize the tumour volume with minimal costs.
Table 1.
Parameters used in the model.
| parameter | description | value | references |
|---|---|---|---|
| λ | source (IL-6) term in the N2 component | 0.01 | [60,62] |
| G | source (TGF-β) term in the N2 component | 0–1.0 | [60,63] |
| k1 | self-regulation rate in the N2 component | 4.0 | [60] |
| k3 | scaling parameter | 1.0 | [60] |
| α | suppression rate of the N2 component by the N1 component | 1.5 | [60] |
| k2 | self-regulation rate in the N1 component | 4.0 | [60] |
| k4 | scaling parameter | 1.0 | [60] |
| β | suppression rate of the N1 component by the N2 component | 1.0 | [60] |
| S | source (IFN-β) term in the N1 component | 0.2 | [60,64] |
| μ | decay rate of the N1 component | 1.0 | [65,66] |
| threshold (N2 component) | 1.81 | [60] | |
| threshold (N1 component) | 1.29 | [60] | |
| r | growth rate of tumour cells | 0.05 | [33] |
| K | scaling constant | 1.0 | [33] |
| γ1 | suppression strength in immune-mediated growth | 0.1 | [33] |
| T0 | carrying capacity of cancer cells | 100 | [33] |
| source term in the TGF-β component | 0.826 | [60] | |
| decay rate (TGF-β) | 0.826 | [5,67–69] | |
| degradation rate of TGF-β through the inhibitor | 100 | [60] | |
| decay rate (TGF-β inhibitor) | 6.6 | [36] | |
| decay rate (IFN-β) | 3.96 | [70] |
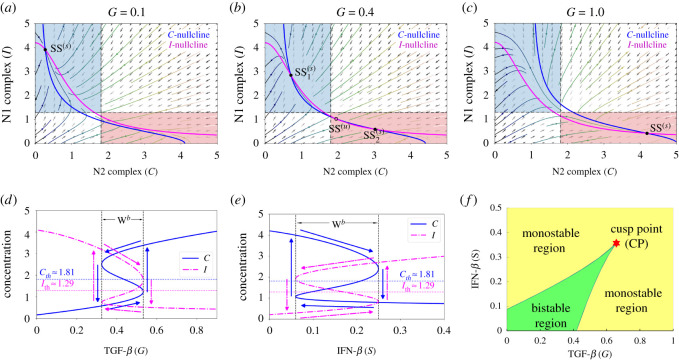
The basic dynamics of the model (2.1) is illustrated in figure 2. Different levels of TGF-β (G) signals could induce either a single stable steady state SS(s) or three steady states of which two are stable and one unstable SS(u). Here, S represents the IFN-β-induced source of the N1 module. When TGF-β is low (G = 0.1), N2 complex activities are suppressed while N1 activities are promoted yielding one SS(s) which induces an anti-tumorigenic phenotype of TANs (figure 2a). On the contrary, high level of TGF-β (G = 1.0) enhances N2 activities but decreases that of N1 complex leading to a stable SS(s) which is a tumorigenic phenotype of TANs (figure 2c). Thus, for low and high G signals, phenotypic differentiation of TANs does not depend on initial status of N1 and N2 complexes. However, an intermediate TGF-β signal (G = 0.4) leads to two SS(s) and one SS(u) generating bistability in the system. The initial conditions of N1 and N2 complex influence the induction of either anti- or pro-tumour TANs (figure 2b). Due to the dichotomous behaviour of TANs with respect to signals of TGF-β, an associated hysteresis diagram is expected (figure 2d). The bistability window Wb ≈ [0.33, 0.53] provides the limit points for which the system jumps from one stable state to the other. The system is not only G-dependent but also S-dependent. That is, varying levels of IFN-β signals also promotes bistability and hysteresis as shown in figure 2e, where the bistability window with respect to S is Wb ≈ [0.06, 0.25]. Note that the domain of bistability is dependent on key parameters and may progressively shrink for some parameter sets. Figure 2f depicts the bistable and monostable region under varying G and S simultaneously. Starting at a limit point obtained from one-parameter bifurcation (G), a cusp point (CP) is achieved by computing a fold continuation. Then, two key parameters G and S are increased (or decreased) at the same time along the trajectory of a limit point for equilibrium curve at the corresponding value of S. This resulted to a codim 2 bifurcation. The cusp point yields the threshold values and . MatCont was used for numerical continuation and bifurcation analysis [71]. In this study, the effects of exogenous intervention of TGF-β inhibitor and IFN-β on tumour progression are further investigated. Figure 1a illustrates the response of N1 and N2 complexes to the TGF-β inhibitor and IFN-β, acting as regulatory controls to the system. Note that N2-polarization by TGF-β can be blocked by using inhibitor (TGF-β Inh) and/or IFN-β promoting N1-dominant microenvironment. As depicted, both controls could downregulate N2 complex which activates N1 complex leading to tumour-suppression. Note that IL-6 is a protein-coding gene that induces Treg and others (upward arrow), which promotes N2 phenotype resulting in tumour growth. The dashed arrow indicates that withdrawal of IL-6 activity downregulates Treg and others (hence, downward arrow), leading to N1 phenotype suppressing tumours. Figure 1b shows the schematic diagram of the simplified model while figure 1c is the dimensionless form; N1 and N2 complexes are grouped as module C and I, respectively.
Figure 2.
(a–c) Nullclines of model (2.1) in the C−I phase plane in response to (a) low, G = 0.1, (b) intermediate, G = 0.4, and (c) high, G = 1 levels of TGF-β showing the corresponding steady states where SS(s) and SS(u) denote stable, respectively, unstable steady state. Anti-tumorigenic and tumorigenic regions are marked in blue and pink boxes in (a–c). (d,e) Hysteresis diagram with respect to varying signals of TGF-β and IFN-β promoting N1-N2 on–off switch activation. (f) Codimension 2 bifurcation for different G and S levels depicting division of bistable and monostable region and a cusp point (CP).
The non-dimensional set of differential equations describing the model is as follows:
| 2.2 |
where and denote the exogenous infusion rate of TGF-β inhibitor and IFN-β, respectively, and T is the tumour volume.
The current modelling approach uses optimal control theory to identify therapeutic infusion protocol of TGF-β inhibitor and IFN-β that could lead to N1-polarization suppressing tumour progression. In particular, we aim to determine appropriate drug injection rates and/or minimizing tumour volume and associated administrative infusion cost. The controls and represent dosages of TGF-β inhibitor and an IFN-β drug, respectively. These controls are assumed to be bounded and Lebesgue integrable. That is, the control set is defined as
| 2.3 |
where and are the maximum tolerated TGF-β inhibitor and an IFN-β drug doses, respectively, which could be administered in a given treatment period. These upper bounds may also be viewed as the maximum amounts a patient can financially afford. The lower bounds for and correspond to no treatment. Furthermore, we intend to administer precisely the amount of treatment to be given to the patient over the given time interval [t0, t1], which is within safety limits (isoperimetric constraint). That is, we have
| 2.4 |
where A1 and A2 are the known TGF-β inhibitor and IFN-β drug amounts, respectively. Considering the bounds for and , the choices for A1 and A2 satisfy
The following optimal control problems (OCPs) are formulated to examine different therapeutic strategies. Here, the control costs are modelled by linear combination of quadratic terms, where the weight factors B1 and B2 denote the relative cost of minimizing tumour volume T(t) and administering TGF-β inhibitor and/or IFN-β drug infusions over a certain time period, respectively. The quadratic form of the cost functional with respect to the controls ensures that the associated Hamiltonian becomes strictly convex and has a unique minimizer, thus making the mathematical problem more tractable. The use of such quadratic functionals is not commonly motivated by biological phenomena making its simplifying assumptions questionable [72]. However, its use in order to incorporate the nonlinearity of the problem has produced qualitatively significant results [73,74]. It should be noted that the quadratic controls in the cost function model the adverse effects of using too much drugs, as used in several works [73,75–79]. An isoperimetric optimal control has been applied to cancer immunotherapy [80–82].
-
1. TGF-β inhibitor control only. In this scheme, we want to investigate the anti-tumour effect of TGF-β inhibitor on tumour growth. In particular, we want to minimize the tumour size (T) and dose of TGF-β inhibitor while keeping the same IFN-β supply. Thus, the OCP is to minimize the cost functional
subject to (2.2) where S is assumed constant (i.e. S = 0.2, dS/dt = 0) with .2.5 -
2. IFN-β control only. We consider the anti-tumour efficacy of IFN-β infusion. In particular, we want to minimize the tumour size (T) and dose of IFN-β in the absence of IFN-β inhibitor. Thus, the problem is formulated as minimizing the cost functional
subject to (2.2) with constant TGF-β and no inhibitor present (i.e. G = 0.45, dG/dt = 0, L = 0, dL/dt = 0) with .2.6 -
3. Concomitant TGF-β inhibitor and IFN-β controls. In this approach, the anti-tumour efficacy of both controls is examined assuming that TGF-β inhibitor and IFN-β can be administered simultaneously. Specifically, we want to minimize the tumour size (T) and doses of both TGF-β inhibitor and IFN-β. Hence, the OCP is to minimize
subject to (2.2) and isoperimetric constraints (2.4).2.7 -
4. Alternating TGF-β inhibitor and IFN-β controls. In order to avoid drug complications such as risk of killing healthy cells and overdose, we propose a strategy of administering drugs alternately. Specifically, we want to minimize the tumour size (T) and doses of both TGF-β inhibitor and IFN-β in an alternating injection scheme. Thus, the OCP can then be formulated as minimizing the cost functional
subject to (2.2) and isoperimetric constraints (2.4) within an appropriate time interval.2.8
Our goal is to find optimal infusion regimen for TGF-β inhibitor and/or IFN-β, such that
| 2.9 |
where is the set of all square integrable functions and over a specified interval given in (2.3). By using standard results in control theory, the existence of optimal controls is guaranteed [83]. In this optimal control problem (OCP), the integrand of the objective functional satisfies the necessary convexity, in which Pontryagin’s maximum principle can be applied [84]. In solving the OCP, an iterative method is used where initial conditions for the state variables and terminal conditions for the adjoints constitute a two-point boundary value problem. State equations are solved forward in time using the given initial conditions and the corresponding adjoint equations are solved backward in time starting with the transversality conditions. This is known as the forward–backward sweep method (FBSM). Numerical simulations can be obtained using Euler scheme or fourth-order iterative Runge–Kutta method. We use adapted FBSM [85,86] with adapted scheme [87] for isoperimetric constraints.
3. Results and discussion
In this section, we present the numerical results obtained from different control strategies. The weight parameters B1 = B2 = 1 are used as default values. Four different initial conditions, Qi := (C0,i, I0,i), i = 1, …, 4, are considered in order to resemble diverse phenotypical state of N1 and N2 complexes. The polarization of the microenvironment is N2-dominant if and , otherwise, N1-dominant when and . We include the following conditions:
-
—
Q1 = (3, 2): low-risk state, high levels of both C and I above their corresponding threshold values;
-
—
Q2 = (1, 2): risk-free state, low (high) level of C (I) below (above) the threshold value;
-
—
Q3 = (1, 0.5): low-risk state, low levels of C and I below their corresponding threshold values; and
-
—
Q4 = (4, 0.3): high-risk state, high (low) level of C (I) above (below) the threshold value.
An important phenotypic marker is
| 3.1 |
3.1. TGF-β inhibitor control only
In this therapeutic strategy, we assume that there is a constant source of IFN-β and that the system can be regulated by exogenously administering TGF-β inhibitor. The goal is to obtain optimal infusion protocol with the least cost of TGF-β inhibitor infusion, i.e. that represses the N2-dominant phenotype leading to tumour-suppression. We consider that the total dose of TGF-β inhibitor which can be administered in a day is 1 unit, and thus, A1 = 1. Also, we presume that this drug can only be administered every other day as in experiments [37] taking into account its toxicity to healthy tissue. The adapted FBSM is applied for (a maximum of) one day if condition (3.1) is not satisfied (i.e. either or or both inequalities hold) to obtain the optimal control profile for that period. It is expected that C will decrease since TGF-β inhibitor blocks the TGF-β promoting N2 phenotype which would in turn, upregulate N1 activities. Then, a day of no infusion follows letting the TGF-β inhibitor take effect. The activities of C and I are simultaneously monitored. At the time when condition (3.1) holds, infusion is stopped or no control is applied. Continuous monitoring of C and I profiles will be crucial in determining the next TGF-β inhibitor infusion. This routine suggests a TGF-β inhibitor control.
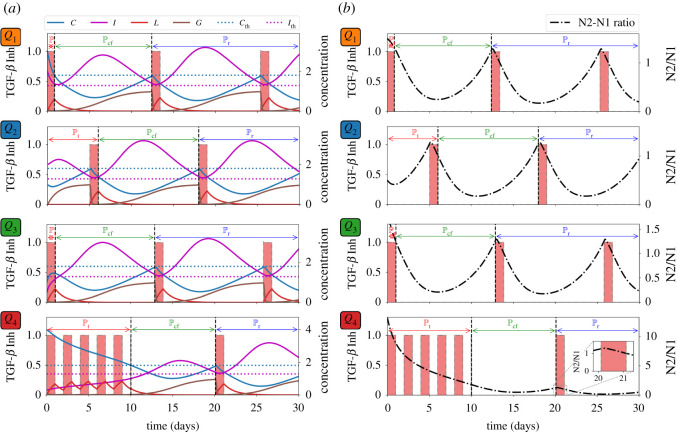
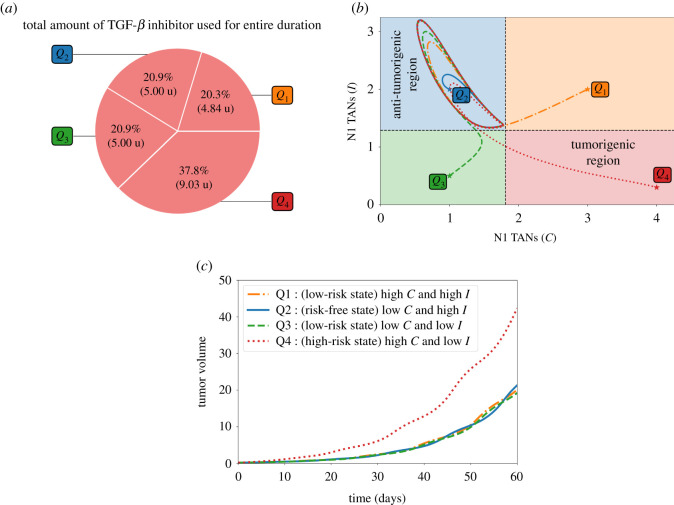
We consider the treatment period to be the time when initial control infusion is administered until condition (3.1) fails. Then cancer-free period is shortly achieved when condition (3.1) is satisfied. Before C crosses from below (I crosses from above), optimal control is again applied proposing the specific time of TGF-β inhibitor administration, and that commences the relapse period . Figure 3a depicts the control scheme, the corresponding profile of TGF-β inhibitor (L) and its effect on TGF-β (G), and the concentration profiles of C and I with different initial conditions Q1, Q2, Q3, Q4. For instance, if one considers Q4 as initial values of C and I, TGF-β inhibitor control is applied every other day until C crosses which is about 10 days, duration of . Then follows until around day 20 when TGF-β inhibitor administration is again needed. The remaining time period covers . Note also that starting at risk-free, anti-tumorigenic region Q2 satisfies condition (3.1). Thus, initial TGF-β inhibitor infusion commences (later) at around day 5. Figure 3b illustrates that administration of TGF-β inhibitor is needed to reduce the N2/N1 ratio (shown in black, dash-dotted curve). It is expected that when the initial condition is at high-risk, tumorigenic region Q4, the total amount of TGF-β inhibitor to be used for entire medication period (60 days) is the largest. This is shown in figure 4a. The C−I dynamics obtained from the TGF-β inhibitor control protocol at different initial conditions are illustrated in figure 4b. Observe that all the trajectories converge to the anti-tumorigenic region. Time courses of tumour volume in these four cases illustrate the relatively poor anti-tumour efficacy when the initial condition is in the tumorigenic region Q4 (figure 4c), despite the highest cost (figure 4a).
Figure 3.
TGF-β inhibitor administration schedule under different initial conditions Q1, Q2, Q3, Q4 and corresponding dynamics of (a) C, I, L, G, and (b) N2/N1 levels. Administration of TGF-β inhibitor decreases the N2/N1 levels.
Figure 4.
(a) Proportion of the amount of TGF-β inhibitor used for the entire treatment duration, (b) dynamics of the N1-N2 system and (c) tumour dynamics under TGF-β inhibitor control starting at different initial conditions Q1, Q2, Q3, Q4.
3.2. IFN-β control only
Let us consider a scenario when TGF-β inhibitor cannot be administered due to adverse drug reactions, high cost, etc., and assume that only IFN-β can be used for treatment purposes. Taking into account that IFN-β is a noxious drug [29,88,89], it can be administered only every other day in increasing amount as illustrated in experimental system [29,33,44]. In this strategy, we let the minimum and maximum IFN-β amount be 2 and 10 units, respectively (i.e. , ). As in the first control strategy, both C and I are assessed. If condition (3.1) fails, then immediate administration of IFN-β is needed. This is done by using adapted FBSM for a day to fully utilize the minimum amount followed by a period of no infusion (maximum of a day) where both C and I are concurrently monitored. If condition (3.1) still does not hold, application of control routine is carried out where IFN-β amount is increased by 2 units. This infusion scheme with increasing amount of IFN-β per administration is implemented until condition (3.1) is not satisfied. The period from first IFN-β control administration until the last infusion where at least one of the inequalities in condition (3.1) no longer holds is what we refer to as the treatment period . Then a critical period follows where both C and I should be carefully monitored and strategic IFN-β infusion is necessary. Subsequently, C and I levels will be below and above their threshold values and IFN-β can be regularly administered at minimum amount. This period is considered as the maintenance period .
Figure 5a illustrates the IFN-β infusion control scheme, the corresponding IFN-β concentration profiles, and dynamics of C and I. It is shown that starting at Q4 entails an increasing rate and amount of IFN-β infusion, and longer . It is interesting to note that with initial condition at Q3, the second infusion rate during is 2 units but it can be verified that the amount of IFN-β < 2. It can be observed in figure 5b that IFN-β infusion decreases the N2/N1 ratio levels.
Figure 5.
IFN-β administration schedule under different initial conditions Q1, Q2, Q3, Q4 and corresponding dynamics of (a) C, I, S and (b) N2/N1 levels. Administration of IFN-β lowers the N2/N1 levels.
It is depicted in figure 6a that the total amount of IFN-β needed for the entire medication duration for 60 days is the least when (C, I) is initially at anti-tumorigenic region Q2 as opposed to starting at tumorigenic region Q4. In figure 6b, the dynamics of C−I with different initial conditions under the IFN-β control are steered towards the anti-tumorigenic region. Relatively efficient treatment results starting from anti-tumorigenic sector Q2 and poor outcomes starting from tumorigenic status Q4 are reflected in time courses of tumour volumes in figure 6c.
Figure 6.
(a) Proportion of the amount of IFN-β used for the entire treatment duration, (b) dynamics of the N1-N2 system and (c) tumour dynamics under IFN-β control starting at different initial conditions Q1, Q2, Q3, Q4.
3.3. Concomitant TGF-β inhibitor and IFN-β controls
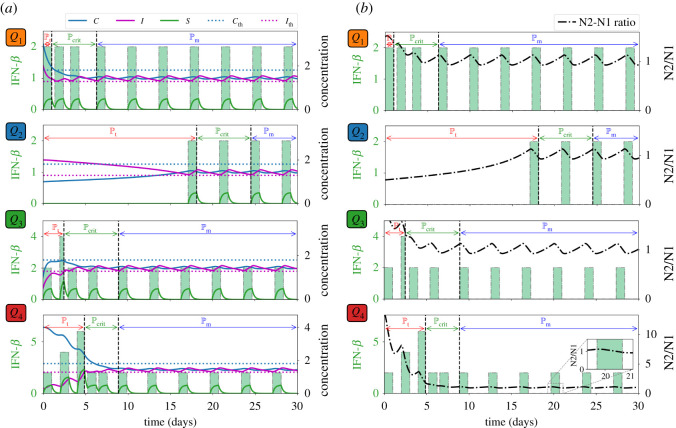
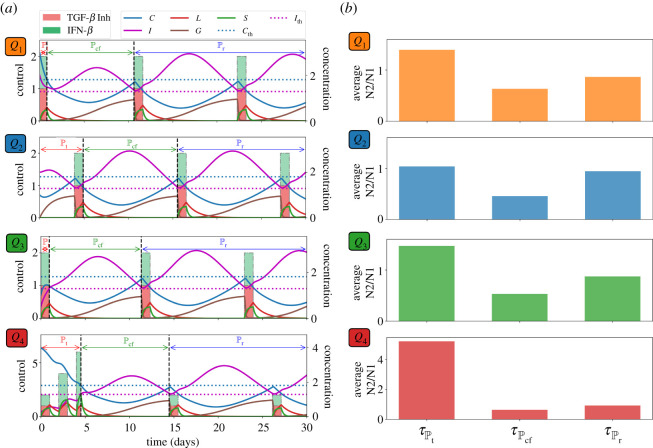
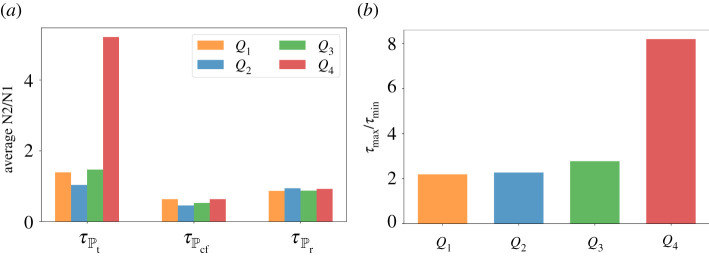
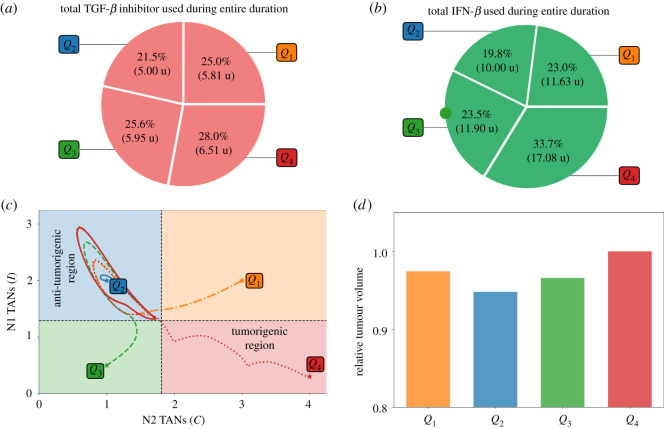
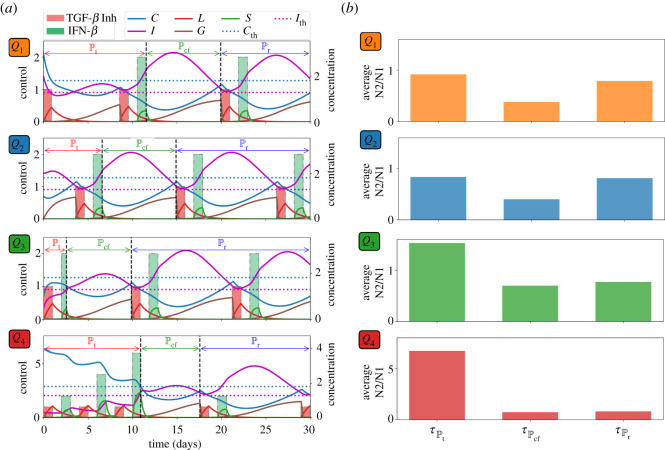
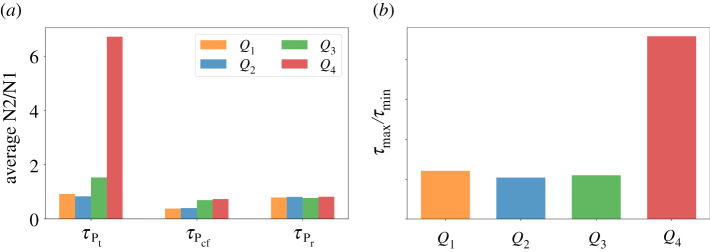
Now let us assume that both TGF-β inhibitor and IFN-β can be administered concurrently. As in the previous strategies, drug infusions can be done every other day where IFN-β can be administered at an increasing amount. Both drugs are concomitantly administered until condition (3.1) is satisfied which spans the treatment period . After the infusions, C and I will decrease and increase, respectively, for some time. Before C and I cross their corresponding threshold value from below and above, respectively, simultaneous drug administration should be carried out. This duration covers the cancer-free period . Then continuous monitoring of C and I profiles are necessary to determine the time for next concomitant administrations of TGF-β inhibitor and IFN-β. These period is referred to as the relapse period . Concomitant infusion scheme, corresponding TGF-β inhibitor and IFN-β concentrations, and dynamics of the state variables starting at different initial conditions are depicted in figure 7a. The average levels of N2/N1 ratio for each regimen denoted by , , under various scenarios are depicted in figure 7b. Figure 8a shows a better comparison of the average amount of N1/N2 levels for each medication period under different conditions while figure 8b illustrates the ratio of the maximum (τmax) and minimum (τmin) N2/N1 levels for each condition. Obviously, τmax/τmin is highest at high-risk state Q4.
Figure 7.
(a) Profiles of concomitant TGF-β inhibitor and IFN-β infusion protocol and corresponding concentration dynamics of C, I, L, G, S, and (b) average levels of N2/N1 (τ) for each period starting at different initial conditions Q1, Q2, Q3, Q4.
Figure 8.
(a) Comparison of the average N2/N1 levels (τ) for each medication period and (b) ratio of the maximum (τmax) and minimum (τmin) N2/N1 levels for each condition Q1, Q2, Q3, Q4 under concomitant TGF-β inhibitor and IFN-β scheme.
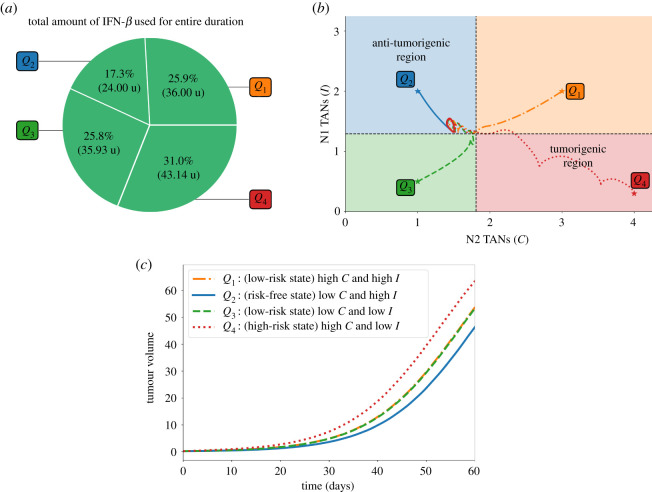
The total amount of TGF-β inhibitor and IFN-β drugs administered for the entire medication duration of 60 days are depicted in figure 9a,b, respectively. It can be observed that starting at Q4 needs more infusions and thus more drug amount used. On the contrary, less administration and drug amount is needed when (C, I) is initially at risk-free state Q2. Figure 9c shows the C−I dynamics starting at different initial conditions. Administration of concomitant controls will drive all the trajectories to the anti-tumorigenic region. Scaled tumour volumes (Q4 bar in figure 6d) and elongated path from the initial TAN distribution in the tumorigenic zone Q4 (red dotted curve in figure 6c) also indicate the relatively worst outcome in decreasing the tumour size in the presence of a N2-dominant tumour microenvironment.
Figure 9.
Proportion of the amount of TGF-β inhibitor (a) and IFN-β (b) used for the entire treatment duration, (c) dynamics of the N1-N2 system and (d) tumour volume relative to the high-risk state at the end simulation time under concomitant TGF-β inhibitor and IFN-β controls starting at different initial conditions Q1, Q2, Q3, Q4.
3.4. Alternating TGF-β inhibitor and IFN-β controls
Suppose that TGF-β inhibitor and IFN-β cannot be administered simultaneously due to toxicity, adverse drug reactions, etc. Here, we examine the scheme where drug infusion can be carried out alternately and every other day. Control scheme is obtained by analogously following the protocol and condition laid out in the previous strategies. The drug infusion protocol, its concentrations and state dynamics starting with different initial conditions are illustrated in figure 10a and the average levels of N2/N1 ratio , , under different conditions are illustrated in figure 10b. It is interesting to note that with initial condition at Q1, IFN-β infusion is not necessary a day after the first TGF-β inhibitor administration. Also, starting at Q3 needs lesser amount of IFN-β for its first infusion. Figure 11a shows a comparison of the average amount of N1/N2 levels for each medication period under different conditions while figure 11b illustrates the ratio of the maximum (τmax) and minimum (τmin) N2/N1 levels for each condition under alternating administration of TGF-β inhibitor and IFN-β. As expected, τmax/τmin is highest at high-risk state Q4.
Figure 10.
(a) Profiles of alternating TGF-β inhibitor and IFN-β infusion protocol and corresponding concentration dynamics of C, I, L, G, S, and (b) average levels of N2/N1 (τ) for each treatment period starting at different initial conditions Q1, Q2, Q3, Q4.
Figure 11.
(a) Comparison of the average N2/N1 levels (τ) for each medication period and (b) ratio of the maximum (τmax) and minimum (τmin) N2/N1 levels for each condition Q1, Q2, Q3, Q4 under alternating TGF-β inhibitor and IFN-β scheme.
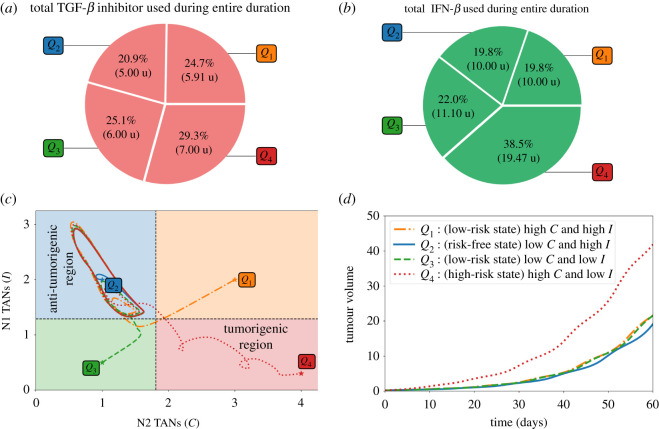
The proportion and the total amount of TGF-β inhibitor and IFN-β used for the entire duration of 60 days are depicted in figure 12a,b, respectively. As expected, starting at Q4 needs more drug infusions and hence more drug amount compared with other initial conditions. Trajectories of the C−I dynamics with different initial conditions towards the anti-tumorigenic region under the alternating control scheme are illustrated in figure 12c. Time courses of tumour volumes in four cases (figure 12d) show the worst outcome in decreasing the tumour size with the initial TAN distribution in the tumorigenic zone Q4, indicating the critical role of the N1/N2 immune conditions. It is important to note that, in order to satisfy condition (3.1), the initial drug administration and infusion duration vary with different initial conditions. This in turn, influences the drug amount to be used within a specific period. Starting at Q2, for instance, showed that drug infusion is not carried out during the first day. On the other hand, starting at Q4 demands several drug administrations to meet the condition (3.1).
Figure 12.
(a) Proportion of the amount of TGF-β inhibitor, (b) IFN-β used for the entire treatment duration, (c) dynamics of the N1-N2 system and (d) tumour dynamics under alternating TGF-β inhibitor and IFN-β controls starting at different initial conditions Q1, Q2, Q3, Q4.
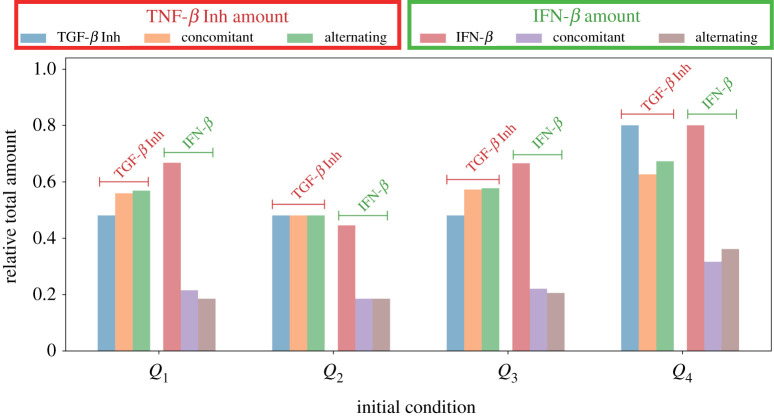
Figure 13 compares the relative total amount of TGF-β inhibitor and IFN-β used in the proposed therapeutic strategies starting at different initial conditions. Across the various schemes, starting at Q4 needs a bigger amount to bring C below and keep I above their respective threshold values.
Figure 13.
Relative amount of TGF-β inhibitor and IFN-β used among different control strategies.
4. Conclusion
The exact role of immune cells such as NK cells [4] and TANs in tumour growth is still poorly understood. Several studies have reported that neutrophils are cytotoxic to tumour cells. On the contrary, a growing clinical evidence supports that neutrophils can promote tumour progression by enhancing proliferation and angiogenesis, and inducing cell migration and metastasis [20,21,23]. Hence, TANs can display two different phenotypes: an anti-tumour (N1) and pro-tumour (N2) effector cells [15,16,24]. The current study investigates a regulatory model between N1 and N2 TANs. In this work, optimal control theory is employed to determine the amount, infusion times and cost of TGF-β inhibitor and IFN-β administrations to activate N1 leading to tumour suppression. This framework has been utilized to identify treatment schedules and anti-invasion therapy for glioblastoma [90,91]. Both single and combination drug therapies are considered under various phenotypical conditions of N1 and N2. An important aspect of determining treatment protocol is the patients’ pathophysiological condition. We identified therapeutic regimen for promoting anti-tumoural TANs and suppressing pro-tumoural neutrophil phenotypic states through four different administration of the TGF-β inhibitor and IFN-β in lung cancer. The optimal control scheme predicts that, depending on relative states of N1 and N2 phenotypes, therapy schedules may have to be adjusted properly to minimize adverse effects of these drugs and its administration cost in addition to maximizing anti-tumour efficacy.
Proper diagnosis of N1 and N2 activities are important tools in order to have an adaptive and individualized drug infusion protocol [60]. Converting N2 TANs to N1 could provide new therapeutic options for cancer treatment. Our work essentially can provide a general framework of optimally controlled injection schedules of anti-cancer drugs such as TGF-β inhibitors and IFN-β through immune control, i.e. a critical transition between N1 and N2 TANs. Immune cells in a tumour microenvironment play such a critical role in regulation of tumour growth and anti-cancer therapies [4], having two faces of anti-tumour and tumour-promoting roles. The mathematical framework in this work may be adapted for optimal results of anti-cancer therapies as far as appropriate patient-specific data in clinics are provided.
Our study has four limitations:
-
—
The current work does not consider the role of other factors in TME such as intracellular pathways such as STAT1/STAT3/JAK [92] in response to IFN-β, TGF-β, and other stimuli [93], neutrophil elastase (NE) in the presence [94] and absence [95,96] of LPS, tumour-promoting or -suppressive immune response of NK cells [4,97], tumour-associated fibroblasts (TAFs) [67,98–100], ECM remodelling [69,101–103], angiogenesis from blood vessels [104–106], or growth factors such as EGF [107,108] and CSF-1 [5,109]. NK cells were shown to mediate dual roles of neutrophils in metastatic colonization [110,111]. For example, neutrophils can enhance extravasation of circulating tumour cells by suppressing NK cells [111]. Depletion or adjuvant therapy of NK cells was shown to increase anti-tumour efficacy in a combination therapy (OV-bortezomib-NK) relative to control, showing nonlinear behaviour of immune system [4]. These factors may play major roles in regulation of N1 → N2 transition, thus cancer progression. In particular, we focused on the effect of TGF-β inhibitor and IFN-β on TANs in this study, but it would be important to see the effect of those two inhibitors on NK cells and TAFs in future work. For example, TGF-β and its inhibitor [98,99,112] and IFNs [112–115] play an important role in regulation of tumour-associated fibroblasts in cancer progression. We plan to include those players in a future optimal-control model.
-
—
NET and NE were shown to promote tumour growth and invasion [116] by turning on the multiple signalling pathways including PI3K in lung cancer cells [117]. For example, upregulated NET activities near tumour sections induce the transformation of B cells [118], contributing to cancer progression [119]. In particular, mathematical models [116] and experimental data [120] suggest that NET can mediate the critical metastatic process [121,122] to stabilize the circulating tumour cells in the bloodstream and help extravasation of these cancerous cells. However, NET was also suggested to suppress tumour growth in colonic adenocarcinoma [123]. In our study, we did not take into account these critical influence of NETs in a spatial domain. We plan to develop an optimal control approach in a new framework of the partial differential equations of NETs in order to improve the therapeutic, anti-invasion strategies.
-
—
Unforeseen microenvironmental factors may limit bi-lateral switches between N1 and N2 TANs. In our study, optimal control was applied only to IFN-β and TGF-β inhibitors. We plan to investigate the specific role and optimization of these stimuli in TME for better understanding of the role of TANs (either promotion [124–127] or suppression of tumour progression [123]). A new optimal control method has to be developed for a possible triple combination therapy, i.e. TGF-β + TGF-β inhibitor + immune agents [128]. We plan to develop an optimal control of the TAN’s plasticity of the possibly continuous spectrum of the N1 → N2 switches, which requires better understanding and experiments of the biological system as well as advanced optimal control theory.
-
—
It has been reported that a more realistic clinical situation employs linear cost functions. These types of problems have been used in several works devoted to the administration of single and combination therapies to treat different types of tumours [129–133]. On the contrary, a study by Glick & Mastroberardino [74] concluded that quadratic control yields continuous, low doses of the therapeutic drug producing a better outcome in the eradication of the solid tumour. Several researches on optimal control approaches for cancer treatment still favour quadratic controls [77–79]. Under certain circumstances, both linear and quadratic controls obtain qualitatively similar results [76,81,134]. It is true that profiles of treatment strategies depend on the landscape of the cost functionals. These differences show the importance of carefully defining an objective functional that most accurately reflects the toxicities of a particular drug along with the objective of the treatment strategy, for instance, decreasing the tumour mass at the end of the treatment interval, reducing the overall tumour burden over the treatment interval, and some other clinically relevant criteria [73]. It is therefore suggested that further model iterations should include exhaustive investigations on linear controls to have holistic treatment strategies for cancer treatment. Further analysis of models with other types of objective functionals should also be pursued. Varying results should then be presented to the medical practitioner for them to decide which solutions best fit the biological situation and can be used for practical implementation, if any [134].
This work, however, provides a general framework of optimal control approach for the fundamental transition from N2 to N1 TANs, thus inhibiting tumour growth, in response to known key players.
Typical lifespan of neutrophils is usually under tight control for maintenance of tissue homeostasis due to their potential toxicity [135], leading to short half-life in blood circulation after leaving the bone marrow. However, there exist multiple cellular and molecular factors such as smoking and reactive oxygen species (ROS) [136–138] that can influence their longevity [139,140], altered signalling pathways and neutrophil apoptosis in TME [136,137,141,142]. For example, ROS production is shown to be decreased in the absence of endogenous IFN-β, inducing cellular delays in apoptosis of TANs [143]. Since these factors may affect a complex imbalance between N1 and N2 TANs, an optimal control framework of such N1/N2 system with time delays [144,145] is needed in order to control the aggressive promotion of aggressive tumour growth.
Building a mathematical model does not entail all important details of a life process, rather, distil key elements that could provide insight into the underlying mechanisms and generate novel hypotheses for experimentation [45]. Since no model is perfect, and is lacking some aspects of reality, a symbiotic approach incorporating in vivo, in vitro and in silico techniques could be proven to be beneficial [146,147]. Despite several caveats and limitations, mathematical modelling will still be instrumental in understanding cancer biology and treatment [47]. Further design of experiments and development of computational techniques for verification and validation should be carried out using experimental data. Various types of mathematical models were suggested for better understanding of tumour biology: (i) ordinary differential equations [60,91,148–152], (ii) delay differential equations [60,148,153], (iii) partial differential equations [4,5,67,68,101,103,116,154–160], (iv) immersed boundary method [161,162], (v) individual-based models [163–165], and (vi) multi-scale hybrid model [69,100,166–173]. See [174] for a review of cell-based approaches. These mathematical approaches have been applied to investigation of various aspects of signalling network of oncogenes and tumour suppressors, tumour growth, cellular invasion, angiogenesis, recurrence, interaction with tumour microenvironment including chemokines/cytokines, stromal cells, immune cells, metastasis and development of anti-cancer strategies. In particular, multi-scale mathematical models [69,100,166,167,169–173,175,176] could be used to address dynamical changes in inter- and intra-cellular signalling pathways at the microscale level and integrate cellular process at the cellular level. We hope to address these issues in future work.
Supplementary Material
Acknowledgements
A.D.L.R.V. acknowledges the support of the Institute of Mathematics, University of the Philippines Diliman and the Institute for Basic Science (IBS-R029-C3).
Data accessibility
We deposited all codes and data within the Dryad Digital Repository: https://doi.org/10.5061/dryad.g79cnp5r0. We have two files: (1) README.txt (2) data_RSOS-210705.zip. Here, the zip file contains all codes and data.
Competing interests
The authors declare that they have no competing interests.
Funding
This work was supported by the National Research Foundation of Korea (NRF) grant funded by the Korea government (MSIT) (No. 2021R1A2C1010891) (Y.K.).
References
- 1.Siegel RL, Miller KD, Jemal A. 2019. Cancer statistics, 2019. CA Cancer J. Clin. 69, 7-34. ( 10.3322/caac.21551) [DOI] [PubMed] [Google Scholar]
- 2.Ferlay J, Colombet M, Soerjomataram I, Mathers C, Parkin DM, Piñeros M, Znaor A, Bray F. 2019. Estimating the global cancer incidence and mortality in 2018: GLOBOCAN sources and methods. Int. J. Cancer 144, 1941-1953. ( 10.1002/ijc.31937) [DOI] [PubMed] [Google Scholar]
- 3.Jaillon S, Ponzetta A, Mitri DD, Santoni A, Bonecchi R, Mantovani A. 2020. Neutrophil diversity and plasticity in tumour progression and therapy. Nat. Rev. Cancer 20, 485-503. ( 10.1038/s41568-020-0281-y) [DOI] [PubMed] [Google Scholar]
- 4.Kim Y, Yoo JY, Lee TJ, Liu J, Yu J, Caligiuri MA, Kaur B, Friedman A. 2018. Complex role of NK cells in regulation of oncolytic virus-bortezomib therapy. Proc. Natl Acad. Sci. USA 115, 4927-4932. ( 10.1073/pnas.1715295115) [DOI] [PMC free article] [PubMed] [Google Scholar]
- 5.Kim Y, Jeon H, Othmer H. 2017. The role of the tumor microenvironment in glioblastoma: a mathematical model. IEEE Trans. Biomed. Eng. 64, 519-527. [DOI] [PMC free article] [PubMed] [Google Scholar]
- 6.Choi EY, Santoso S, Chavakis T. 2009. Mechanisms of neutrophil transendothelial migration. Front. Biosci. (Landmark edition) 14, 1596-1605. ( 10.2741/3327) [DOI] [PMC free article] [PubMed] [Google Scholar]
- 7.Borregaard N. 2010. Neutrophils, from marrow to microbes. Immunity 33, 657-670. ( 10.1016/j.immuni.2010.11.011) [DOI] [PubMed] [Google Scholar]
- 8.Voisin MB, Nourshargh S. 2013. Neutrophil transmigration: emergence of an adhesive cascade within venular walls. J. Innate Immun. 5, 336-347. ( 10.1159/000346659) [DOI] [PMC free article] [PubMed] [Google Scholar]
- 9.Bianchi ME. 2007. DAMPs, PAMPs and alarmins: all we need to know about danger. J. Leukoc. Biol. 81, 1-5. ( 10.1189/jlb.0306164) [DOI] [PubMed] [Google Scholar]
- 10.Park SA, Hyun YM. 2016. Neutrophil extravasation cascade: what can we learn from two-photon intravital imaging? Immune Netw. 16, 317-321. ( 10.4110/in.2016.16.6.317) [DOI] [PMC free article] [PubMed] [Google Scholar]
- 11.Kolaczkowska E, Kubes P. 2013. Neutrophil recruitment and function in health and inflammation. Nat. Rev. Immunol. 13, 159-175. ( 10.1038/nri3399) [DOI] [PubMed] [Google Scholar]
- 12.Pham CTN. 2006. Neutrophil serine proteases: specific regulators of inflammation. Nat. Rev. Immunol. 6, 541-550. ( 10.1038/nri1841) [DOI] [PubMed] [Google Scholar]
- 13.Scapini P, Lapinet-Vera JA, Gasperini S, Calzetti F, Bazzoni F, Cassatella MA. 2000. The neutrophil as a cellular source of chemokines. Immunol. Rev. 177, 195-203. ( 10.1034/j.1600-065X.2000.17706.x) [DOI] [PubMed] [Google Scholar]
- 14.Tecchio C, Scapini P, Pizzolo G, Cassatella MA. 2013. On the cytokines produced by human neutrophils in tumors. Semin. Cancer Biol. 23, 159-170. The dichotomy of neutrophil granulocytes in cancer. ( 10.1016/j.semcancer.2013.02.004) [DOI] [PubMed] [Google Scholar]
- 15.Shaul ME, et al. 2016. Tumor-associated neutrophils display a distinct N1 profile following TGFβ modulation: a transcriptomics analysis of pro- vs. antitumor TANs. OncoImmunology 5, e1232221. ( 10.1080/2162402X.2016.1232221) [DOI] [PMC free article] [PubMed] [Google Scholar]
- 16.Hagerling C, Werb Z. 2016. Neutrophils: critical components in experimental animal models of cancer. Semin. Immunol. 28, 197-204. ( 10.1016/j.smim.2016.02.003) [DOI] [PMC free article] [PubMed] [Google Scholar]
- 17.Sionov RV, Fridlender ZG, Granot Z. 2015. The multifaceted roles neutrophils play in the tumor microenvironment. Cancer Microenviron. 8, 125-158. ( 10.1007/s12307-014-0147-5) [DOI] [PMC free article] [PubMed] [Google Scholar]
- 18.Swierczak A, Mouchemore KA, Hamilton JA, Anderson RL. 2015. Neutrophils: important contributors to tumor progression and metastasis. Cancer Metastasis Rev. 34, 735-751. ( 10.1007/s10555-015-9594-9) [DOI] [PubMed] [Google Scholar]
- 19.Liang W, Ferrara N. 2016. The complex role of neutrophils in tumor angiogenesis and metastasis. Cancer Immunol. Res. 4, 83-91. ( 10.1158/2326-6066.CIR-15-0313) [DOI] [PubMed] [Google Scholar]
- 20.Schmidt H, Bastholt L, Geertsen P, Christensen IJ, Larsen S, Gehl J, Von Der Maase H. 2005. Elevated neutrophil and monocyte counts in peripheral blood are associated with poor survival in patients with metastatic melanoma: a prognostic model. Br. J. Cancer 93, 273-278. ( 10.1038/sj.bjc.6602702) [DOI] [PMC free article] [PubMed] [Google Scholar]
- 21.Bellocq A, et al. 1998. Neutrophil alveolitis in bronchioloalveolar carcinoma: induction by tumor-derived interleukin-8 and relation to clinical outcome. Am. J. Pathol. 152, 83-92. [PMC free article] [PubMed] [Google Scholar]
- 22.Atzpodien J, Reitz M. 2008. Peripheral blood neutrophils as independent immunologic predictor of response and long-term survival upon immunotherapy in metastatic renal-cell carcinoma. Cancer Biotherapy Radiopharm. 23, 129-134. ( 10.1089/cbr.2007.0429) [DOI] [PubMed] [Google Scholar]
- 23.Trellakis S, et al. 2011. Polymorphonuclear granulocytes in human head and neck cancer: enhanced inflammatory activity, modulation by cancer cells and expansion in advanced disease. Int. J. Cancer 129, 2183-2193. ( 10.1002/ijc.25892) [DOI] [PubMed] [Google Scholar]
- 24.Fridlender ZG, Sun J, Kim S, Kapoor V, Cheng G, Ling L, Worthen GS, Albelda SM. 2009. Polarization of tumor-associated neutrophil phenotype by TGF-β: ‘N1’ versus ‘N2’ TAN. Cancer Cell 16, 183-194. ( 10.1016/j.ccr.2009.06.017) [DOI] [PMC free article] [PubMed] [Google Scholar]
- 25.Saha S, Biswas S. 2016. Tumor-associated neutrophils show phenotypic and functional divergence in human lung cancer. Cancer Cell 30, 11-13. ( 10.1016/j.ccell.2016.06.016) [DOI] [PubMed] [Google Scholar]
- 26.Shen L, Smith JM, Shen Z, Eriksson M, Sentman C, Wira CR. 2007. Inhibition of human neutrophil degranulation by transforming growth factor-beta1. Clin. Exp. Immunol. 149, 155-161. ( 10.1111/j.1365-2249.2007.03376.x) [DOI] [PMC free article] [PubMed] [Google Scholar]
- 27.Andzinski L, et al. 2016. Type I IFNs induce anti-tumor polarization of tumor associated neutrophils in mice and human. Int. J. Cancer 138, 1982-1993. ( 10.1002/ijc.29945) [DOI] [PubMed] [Google Scholar]
- 28.Jablonska J, Leschner S, Westphal K, Lienenklaus S, Weiss S. 2010. Neutrophils responsive to endogenous IFN-β regulate tumor angiogenesis and growth in a mouse tumor model. J. Clin. Invest. 120, 1151-1164. ( 10.1172/JCI37223) [DOI] [PMC free article] [PubMed] [Google Scholar]
- 29.Studeny M, Marini FC, Dembinski JL, Zompetta C, Cabreira-Hansen M, Bekele BN, Champlin RE, Andreeff M. 2004. Mesenchymal stem cells: potential precursors for tumor stroma and targeted-delivery vehicles for anticancer agents. JNCI: J. Natl Cancer Inst. 96, 1593-1603. ( 10.1093/jnci/djh299) [DOI] [PubMed] [Google Scholar]
- 30.Takaoka A, et al. 2003. Integration of interferon-α/β signalling to p53 responses in tumour suppression and antiviral defence. Nature 424, 516-523. ( 10.1038/nature01850) [DOI] [PubMed] [Google Scholar]
- 31.Zhang F, Sriram S. 2009. Identification and characterization of the interferon-β-mediated p53 signal pathway in human peripheral blood mononuclear cells. Immunology 128, e905-e918. ( 10.1111/j.1365-2567.2009.03104.x) [DOI] [PMC free article] [PubMed] [Google Scholar]
- 32.Garcia-Diaz A, et al. 2017. Interferon receptor signaling pathways regulating PD-L1 and PD-L2 expression. Cell Rep. 19, 1189-1201. ( 10.1016/j.celrep.2017.04.031) [DOI] [PMC free article] [PubMed] [Google Scholar]
- 33.Catani JPP, et al. 2016. Intratumoral immunization by p19Arf and interferon-β gene transfer in a heterotopic mouse model of lung carcinoma. Transl. Oncol. 9, 565-574. ( 10.1016/j.tranon.2016.09.011) [DOI] [PMC free article] [PubMed] [Google Scholar]
- 34.Chiantore MV, et al. 2012. Interferon-β induces cellular senescence in cutaneous human papilloma virus-transformed human keratinocytes by affecting p53 transactivating activity. PLoS ONE 7, e36909. ( 10.1371/journal.pone.0036909) [DOI] [PMC free article] [PubMed] [Google Scholar] [Retracted]
- 35.Takaoka A, et al. 2003. Integration of interferon-alpha/beta signalling to p53 responses in tumour suppression and antiviral defence. Nature 424, 516-523. ( 10.1038/nature01850) [DOI] [PubMed] [Google Scholar]
- 36.Herbertz S, et al. 2015. Clinical development of galunisertib (LY2157299 monohydrate), a small molecule inhibitor of transforming growth factor-beta signaling pathway. Drug Design, Dev. Therapy 9, 4479-4499. ( 10.2147/DDDT.S86621) [DOI] [PMC free article] [PubMed] [Google Scholar]
- 37.Holmgaard RB, et al. 2018. Targeting the TGFβ pathway with galunisertib, a TGFβRI small molecule inhibitor, promotes anti-tumor immunity leading to durable, complete responses, as monotherapy and in combination with checkpoint blockade. J. Immunother Cancer 6, 47. ( 10.1186/s40425-018-0356-4) [DOI] [PMC free article] [PubMed] [Google Scholar]
- 38.Yingling JM, et al. 2017. Preclinical assessment of galunisertib (LY2157299 monohydrate), a first-in-class transforming growth factor-β receptor type I inhibitor. Oncotarget 9, 6659-6677. ( 10.18632/oncotarget.23795) [DOI] [PMC free article] [PubMed] [Google Scholar]
- 39.Serova M, et al. 2015. Effects of TGF-beta signalling inhibition with galunisertib (LY2157299) in hepatocellular carcinoma models and in ex vivo whole tumor tissue samples from patients. Oncotarget 6, 21 614-21 627. ( 10.18632/oncotarget.4308) [DOI] [PMC free article] [PubMed] [Google Scholar]
- 40.Wick A, et al. 2020. Phase 1b/2a study of galunisertib, a small molecule inhibitor of transforming growth factor-beta receptor I, in combination with standard temozolomide-based radiochemotherapy in patients with newly diagnosed malignant glioma. Invest. New Drugs 38, 1570-1579. ( 10.1007/s10637-020-00910-9) [DOI] [PMC free article] [PubMed] [Google Scholar]
- 41.He X, Guo X, Zhang H, Kong X, Yang F, Zheng C. 2017. Mechanism of action and efficacy of LY2109761, a TGF-β receptor inhibitor, targeting tumor microenvironment in liver cancer after TACE. Oncotarget 9, 1130-1142. ( 10.18632/oncotarget.23193) [DOI] [PMC free article] [PubMed] [Google Scholar]
- 42.Melisi D, Ishiyama S, Sclabas GM, Fleming JB, Xia Q, Tortora G, Abbruzzese JL, Chiao PJ. 2008. LY2109761, a novel transforming growth factor β receptor type I and type II dual inhibitor, as a therapeutic approach to suppressing pancreatic cancer metastasis. Mol. Cancer Ther. 7, 829-840. ( 10.1158/1535-7163.MCT-07-0337) [DOI] [PMC free article] [PubMed] [Google Scholar]
- 43.Ghosh D, Parida P. 2016. Interferon therapy in lung cancer: current perspectives. Curr. Cancer Therapy Rev. 12, 237-245. ( 10.2174/1573394713666170316124158) [DOI] [Google Scholar]
- 44.Patel MR, et al. 2015. Vesicular stomatitis virus expressing interferon-β is oncolytic and promotes antitumor immune responses in a syngeneic murine model of non-small cell lung cancer. Oncotarget 6, 33 165-33 177. ( 10.18632/oncotarget.5320) [DOI] [PMC free article] [PubMed] [Google Scholar]
- 45.Anderson ARA, Quaranta V. 2008. Integrative mathematical oncology. Nat. Rev. Cancer 8, 227-234. ( 10.1038/nrc2329) [DOI] [PubMed] [Google Scholar]
- 46.Byrne HM. 2010. Dissecting cancer through mathematics: from the cell to the animal model. Nat. Rev. Cancer 10, 221-230. ( 10.1038/nrc2808) [DOI] [PubMed] [Google Scholar]
- 47.Altrock PM, Liu LL, Michor F. 2015. The mathematics of cancer: integrating quantitative models. Nat. Rev. Cancer 15, 730-745. ( 10.1038/nrc4029) [DOI] [PubMed] [Google Scholar]
- 48.Hoffmann K, et al. 2020. Integration of mathematical model predictions into routine workflows to support clinical decision making in haematology. BMC Med. Inform. Decis. Mak. 20, 28. ( 10.1186/s12911-020-1039-x) [DOI] [PMC free article] [PubMed] [Google Scholar]
- 49.Fors J, Strydom N, Fox WS, Keizer RJ, Savic RM. 2020. Mathematical model and tool to explore shorter multi-drug therapy options for active pulmonary tuberculosis. PLoS Comput. Biol. 16, e1008107. ( 10.1371/journal.pcbi.1008107) [DOI] [PMC free article] [PubMed] [Google Scholar]
- 50.Hamis S, Powathil GG, Chaplain MAJ. 2020. Blackboard to bedside: a mathematical modeling bottom-up approach toward personalized cancer treatments. JCO Clin. Cancer Inform. 3, 1-11. ( 10.1200/CCI.18.00068) [DOI] [PubMed] [Google Scholar]
- 51.Agur Z, Vuk-Pavlović S. 2012. Mathematical modeling in immunotherapy of cancer: personalizing clinical trials. Mol. Ther. 20, 1-2. ( 10.1038/mt.2011.272) [DOI] [PMC free article] [PubMed] [Google Scholar]
- 52.Eletreby R, Zhuang Y, Carley KM, Yagan O, Poor HV. 2020. The effects of evolutionary adaptations on spreading processes in complex networks. Proc. Natl Acad. Sci. USA 117, 5664-5670. ( 10.1073/pnas.1918529117) [DOI] [PMC free article] [PubMed] [Google Scholar]
- 53.Bekisz S, Geris L. 2020. Cancer modeling: from mechanistic to data-driven approaches, and from fundamental insights to clinical applications. J. Comput. Sci. 46, 101198. ( 10.1016/j.jocs.2020.101198) [DOI] [Google Scholar]
- 54.Bozic I, et al. 2013. Evolutionary dynamics of cancer in response to targeted combination therapy. eLife 2, e00747. ( 10.7554/eLife.00747) [DOI] [PMC free article] [PubMed] [Google Scholar]
- 55.Komarova NL, Wodarz D. 2005. Drug resistance in cancer: principles of emergence and prevention. Proc. Natl Acad. Sci. USA 102, 9714-9719. ( 10.1073/pnas.0501870102) [DOI] [PMC free article] [PubMed] [Google Scholar]
- 56.Leder K, Pitter K, LaPlant Q, Hambardzumyan D, Ross BD, Chan TA, Holland EC, Michor F. 2014. Mathematical modeling of PDGF-driven glioblastoma reveals optimized radiation dosing schedules. Cell 156, 603-616. ( 10.1016/j.cell.2013.12.029) [DOI] [PMC free article] [PubMed] [Google Scholar]
- 57.Lenaerts T, Pacheco JM, Traulsen A, Dingli D. 2010. Tyrosine kinase inhibitor therapy can cure chronic myeloid leukemia without hitting leukemic stem cells. Haematologica 95, 900-907. ( 10.3324/haematol.2009.015271) [DOI] [PMC free article] [PubMed] [Google Scholar]
- 58.Sanga S, Sinek JP, Frieboes HB, Ferrari M, Fruehauf JP, Cristini V. 2006. Mathematical modeling of cancer progression and response to chemotherapy. Expert Rev. Anticancer Ther. 6, 1361-1376. ( 10.1586/14737140.6.10.1361) [DOI] [PubMed] [Google Scholar]
- 59.Sherratt JA, Nowak MA. 1992. Oncogenes, anti-oncogenes and the immune response to cancer: a mathematical model. Proc. R. Soc. Lond. B 248, 261-271. ( 10.1098/rspb.1992.0071) [DOI] [PubMed] [Google Scholar]
- 60.Kim Y, Lee D, Lee J, Lee S, Lawler S. 2019. Role of tumor-associated neutrophils in regulation of tumor growth in lung cancer development: a mathematical model. PLoS ONE 14, 1-40. ( 10.1371/journal.pone.0211041) [DOI] [PMC free article] [PubMed] [Google Scholar]
- 61.Powell DR, Huttenlocher A. 2016. Neutrophils in the tumor microenvironment. Trends Immunol. 37, 41-52. ( 10.1016/j.it.2015.11.008) [DOI] [PMC free article] [PubMed] [Google Scholar]
- 62.Yan B, et al. 2013. IL-6 cooperates with G-CSF to induce protumor function of neutrophils in bone marrow by enhancing STAT3 activation. J. Immunol. 190, 5882-5893. ( 10.4049/jimmunol.1201881) [DOI] [PubMed] [Google Scholar]
- 63.Serizawa M, Takahashi T, Yamamoto N, Koh Y. 2013. Combined treatment with erlotinib and a transforming growth factor-β type I receptor inhibitor effectively suppresses the enhanced motility of erlotinib-resistant non-small-cell lung cancer cells. J. Thorac. Oncol. 8, 259-269. ( 10.1097/JTO.0b013e318279e942) [DOI] [PubMed] [Google Scholar]
- 64.Deng L, Liang H, Xu M, Yang X, Burnette B, Arina A, Li XD, Mauceri H, Beckett M, Darga T, Huang X. 2014. STING-dependent cytosolic DNA sensing promotes radiation-induced type I interferon-dependent antitumor immunity in immunogenic tumors. Immunity 41, 843-852. ( 10.1016/j.immuni.2014.10.019) [DOI] [PMC free article] [PubMed] [Google Scholar]
- 65.Steinbach KH, et al. 1979. Estimation of kinetic parameters of neutrophilic, eosinophilic, and basophilic granulocytes in human blood. Blut 39, 27-38. ( 10.1007/BF01008072) [DOI] [PubMed] [Google Scholar]
- 66.Dale DC, Liles WC, Llewellyn C, Rodger E, Price TH. 1998. Neutrophil transfusions: kinetics and functions of neutrophils mobilized with granulocyte-colony-stimulating factor and dexamethasone. Transfusion 38, 713-721. ( 10.1046/j.1537-2995.1998.38898375509.x) [DOI] [PubMed] [Google Scholar]
- 67.Kim Y, Wallace J, Li F, Ostrowski M, Friedman A. 2010. Transformed epithelial cells and fibroblasts/myofibroblasts interaction in breast tumor: a mathematical model and experiments. J. Math. Biol. 61, 401-421. ( 10.1007/s00285-009-0307-2) [DOI] [PubMed] [Google Scholar]
- 68.Kim Y, Friedman A. 2010. Interaction of tumor with its microenvironment: a mathematical model. Bull. Math. Biol. 72, 1029-1068. ( 10.1007/s11538-009-9481-z) [DOI] [PubMed] [Google Scholar]
- 69.Kim Y, Othmer HG. 2013. A hybrid model of tumor-stromal interactions in breast cancer. Bull. Math. Biol. 75, 1304-1350. ( 10.1007/s11538-012-9787-0) [DOI] [PMC free article] [PubMed] [Google Scholar]
- 70.Salmon P, Le Cotonnec JY, Galazka A, Abdul-AhadA A, Darragh A. 1996. Pharmacokinetics and pharmacodynamics of recombinant human interferon-β in healthy male volunteers. J. Interferon Cytokine Res. 16, 759-764. ( 10.1089/jir.1996.16.759) [DOI] [PubMed] [Google Scholar]
- 71.Dhooge A, Govaerts W, Kuznetsov YA. 2004. MATCONT: a Matlab package for numerical bifurcation analysis of ODEs. SIGSAM Bull. 38, 21-22. ( 10.1145/980175.980184) [DOI] [Google Scholar]
- 72.Swan GW. 1988. General applications of optimal control theory in cancer chemotherapy. Math. Med. Biol.: A J. IMA 5, 303-316. ( 10.1093/imammb/5.4.303) [DOI] [PubMed] [Google Scholar]
- 73.Fister KR, Panetta JC. 2003. Optimal control applied to competing chemotherapeutic cell-kill strategies. SIAM J. Appl. Math. 63, 1954-1971. ( 10.1137/S0036139902413489) [DOI] [Google Scholar]
- 74.Glick AE, Mastroberardino A. 2017. An optimal control approach for the treatment of solid tumors with angiogenesis inhibitors. Mathematics 5, 49. ( 10.3390/math5040049) [DOI] [Google Scholar]
- 75.de Pillis LG, Fister KR, Gu W, Head T, Maples K, Neal T, Murugan A, Kozai K. 2008. Optimal control of mixed immunotherapy and chemotherapy of tumors. J. Biol. Syst. 16, 51-80. ( 10.1142/S0218339008002435) [DOI] [Google Scholar]
- 76.de Pillis LG, Gu W, Fister KR, Head TA, Maples K, Murugan A, Neal T, Yoshida K. 2007. Chemotherapy for tumors: an analysis of the dynamics and a study of quadratic and linear optimal controls. Math. Biosci. 209, 292-315. ( 10.1016/j.mbs.2006.05.003) [DOI] [PubMed] [Google Scholar]
- 77.Malinzi J, Ouifki R, Eladdadi A, Torres DFM, White KAJ. 2018. Enhancement of chemotherapy using oncolytic virotherapy: mathematical and optimal control analysis. Math. Biosci. Eng. 15, 1435-1463. ( 10.3934/mbe.2018066) [DOI] [PubMed] [Google Scholar]
- 78.Sabir S, Raissi N, Serhani M. 2020. Chemotherapy and immunotherapy for tumors: a study of quadratic optimal control. Int. J. Appl. Comput. Math. 6, 81. ( 10.1007/s40819-020-00838-x) [DOI] [Google Scholar]
- 79.Sharma S, Samanta GP. 2016. Analysis of the dynamics of a tumor–immune system with chemotherapy and immunotherapy and quadratic optimal control. Differ. Equ. Dyn. Syst. 24, 149-171. ( 10.1007/s12591-015-0250-1) [DOI] [Google Scholar]
- 80.Elmouki I, Saadi S. 2016. BCG immunotherapy optimization on an isoperimetric optimal control problem for the treatment of superficial bladder cancer. Int. J. Dyn. Control 4, 339-345. ( 10.1007/s40435-014-0106-5) [DOI] [Google Scholar]
- 81.Elmouki I, Saadi S. 2016. Quadratic and linear controls developing an optimal treatment for the use of BCG immunotherapy in superficial bladder cancer. Opt. Control Appl. Methods 37, 176-189. ( 10.1002/oca.2161) [DOI] [Google Scholar]
- 82.Hamdache A, Elmouki I, Saadi S. 2014. Optimal control with an isoperimetric constraint applied to cancer immunotherapy. Int. J. Comput. Appl. 94, 31-37. ( 10.5120/16421-6073) [DOI] [Google Scholar]
- 83.Fleming WH, Rishel RW. 1975. Deterministic and stochastic optimal control, vol. 1, Stochastic modelling and applied probability, 1st edn. New York, NY: Springer. [Google Scholar]
- 84.Pontryagin LS. 1987. Mathematical theory of optimal processes. Classics of Soviet Mathematics. London, UK: Routledge Taylor & Francis. [Google Scholar]
- 85.Hackbusch W. 1978. A numerical method for solving parabolic equations with opposite orientations. Computing 20, 229-240. ( 10.1007/BF02251947) [DOI] [Google Scholar]
- 86.McAsey M, Mou L, Han W. 2012. Convergence of the forward-backward sweep method in optimal control. Comput. Optim. Appl. 53, 207-226. ( 10.1007/s10589-011-9454-7) [DOI] [Google Scholar]
- 87.Lenhart S, Workman JT. 2007. Optimal control applied to biological models. Mathematical and Computational Biology. New York, NY: Chapman and Hall/CRC. [Google Scholar]
- 88.Jonasch E, Haluska FG. 2001. Interferon in oncological practice: review of interferon biology, clinical applications, and toxicities. Oncologist 6, 34-55. ( 10.1634/theoncologist.6-1-34) [DOI] [PubMed] [Google Scholar]
- 89.Tavakoli M, Manshadi SMP, Naderi N, Dehghan A, Azizi S. 2012. Unusual side effects of interferon Beta-1a in patient with multiple sclerosis. Mater. Sociomed. 24, 203-205. ( 10.5455/msm.2012.24.203-205) [DOI] [PMC free article] [PubMed] [Google Scholar]
- 90.de los Reyes V A, Jung E, Kim Y. 2015. Optimal control strategies of eradicating invisible glioblastoma cells after conventional surgery. J. R. Soc. Interface 12, 20141392. ( 10.1098/rsif.2014.1392) [DOI] [PMC free article] [PubMed] [Google Scholar]
- 91.Jung E, Pumares KJA, Kim Y. 2019. Strategies in regulating glioblastoma signaling pathways and anti-invasion therapy. PLoS ONE 14, e0215547. ( 10.1371/journal.pone.0215547) [DOI] [PMC free article] [PubMed] [Google Scholar]
- 92.Lee J, Lee D, Kim Y. 2021. Mathematical model of STAT signalling pathways in cancer development and optimal control approaches. R. Soc. Open Sci. 8, 210594. ( 10.1098/rsos.210594) [DOI] [PMC free article] [PubMed] [Google Scholar]
- 93.Grimes M, et al. 2018. Integration of protein phosphorylation, acetylation, and methylation data sets to outline lung cancer signaling networks. Sci. Signal 11, pii. eaaq1087. ( 10.1126/scisignal.aaq1087) [DOI] [PMC free article] [PubMed] [Google Scholar]
- 94.Hattar K, et al. 2014. Interactions between neutrophils and non-small cell lung cancer cells- enhancement of tumor proliferation and inflammatory mediator synthesis. Cancer Immunol. Immunother. 63, 1297-306. ( 10.1007/s00262-014-1606-z) [DOI] [PMC free article] [PubMed] [Google Scholar]
- 95.Moroy G, Alix AJ, Sapi J, Hornebeck W, Bourguet E. 2012. Neutrophil elastase as a target in lung cancer. Anticancer Agents Med. Chem. 12, 565-79. ( 10.2174/187152012800617696) [DOI] [PubMed] [Google Scholar]
- 96.Gong L, et al. 2013. Promoting effect of neutrophils on lung tumorigenesis is mediated by CXCR2 and neutrophil elastase. Mol. Cancer 12, 154. ( 10.1186/1476-4598-12-154) [DOI] [PMC free article] [PubMed] [Google Scholar]
- 97.Aktas ON, Ozturk AB, Erman B, Erus S, Tanju S, Dilege S. 2018. Role of natural killer cells in lung cancer. J. Cancer Res. Clin. Oncol. 144, 997-1003. ( 10.1007/s00432-018-2635-3) [DOI] [PMC free article] [PubMed] [Google Scholar]
- 98.Yoon H, Tang CM, Banerjee S, Delgado AL, Yebra M, Davis J, Sicklick JK. 2021. TGF-beta-mediated transition of resident fibroblasts to cancer-associated fibroblasts promotes cancer metastasis in gastrointestinal stromal tumor. Oncogenesis 10, 13. ( 10.1038/s41389-021-00302-5) [DOI] [PMC free article] [PubMed] [Google Scholar]
- 99.Sahai E, et al. 2020. A framework for advancing our understanding of cancer-associated fibroblasts. Nat. Rev. Cancer 20, 174-186. ( 10.1038/s41568-019-0238-1) [DOI] [PMC free article] [PubMed] [Google Scholar]
- 100.Kim Y, Stolarska M, Othmer HG. 2011. The role of the microenvironment in tumor growth and invasion. Prog. Biophys. Mol. Biol. 106, 353-379. ( 10.1016/j.pbiomolbio.2011.06.006) [DOI] [PMC free article] [PubMed] [Google Scholar]
- 101.Eisenberg M, Kim Y, Li R, Ackerman WE, Kniss DA, Friedman A. 2011. Modeling the effects of myoferlin on tumor cell invasion. Proc. Natl Acad. Sci. USA 108, 20 078-20 083. ( 10.1073/pnas.1116327108) [DOI] [PMC free article] [PubMed] [Google Scholar]
- 102.Lee B, Konen J, Wilkinson S, Marcus AI, Jiang Y. 2017. Local alignment vectors reveal cancer cell-induced ECM fiber remodeling dynamics. Sci. Rep. 7, 39498. ( 10.1038/srep39498) [DOI] [PMC free article] [PubMed] [Google Scholar]
- 103.Kim Y, Lawler S, Nowicki MO, Chiocca EA, Friedman A. 2009. A mathematical model of brain tumor: pattern formation of glioma cells outside the tumor spheroid core. J. Theo. Biol. 260, 359-371. ( 10.1016/j.jtbi.2009.06.025) [DOI] [PubMed] [Google Scholar]
- 104.Revels SL, Lee JM. 2018. Anti-angiogenic therapy in nonsquamous non-small cell lung cancer (NSCLC) with tyrosine kinase inhibition (TKI) that targets the VEGF receptor (VEGFR): perspective on phase III clinical trials. J. Thorac. Dis. 10, 617-620. ( 10.21037/jtd.2018.01.105) [DOI] [PMC free article] [PubMed] [Google Scholar]
- 105.Qu J, Zhang Y, Chen X, Yang H, Zhou C, Yang N. 2017. Newly developed anti-angiogenic therapy in non-small cell lung cancer. Oncotarget 9, 10 147-10 163. ( 10.18632/oncotarget.23755) [DOI] [PMC free article] [PubMed] [Google Scholar]
- 106.Stratigos M, Matikas A, Voutsina A, Mavroudis D, Georgoulias V. 2016. Targeting angiogenesis in small cell lung cancer. Transl. Lung Cancer Res. 5, 389-400. ( 10.21037/tlcr.2016.08.04) [DOI] [PMC free article] [PubMed] [Google Scholar]
- 107.Siegelin MD, Borczuk AC. 2014. Epidermal growth factor receptor mutations in lung adenocarcinoma. Lab Invest. 94, 129-137. ( 10.1038/labinvest.2013.147) [DOI] [PubMed] [Google Scholar]
- 108.Liu X, Wang WP, Zhang C, Ma Z. 2017. Epidermal growth factor receptor (EGFR): a rising star in the era of precision medicine of lung cancer. Oncotarget 8, 50 209-50 220. ( 10.18632/oncotarget.16854) [DOI] [PMC free article] [PubMed] [Google Scholar]
- 109.Pyonteck SM, et al. 2013. CSF-1R inhibition alters macrophage polarization and blocks glioma progression. Nat. Med. 19, 1264-1272. ( 10.1038/nm.3337) [DOI] [PMC free article] [PubMed] [Google Scholar]
- 110.Li P, Lu M, Shi J, Hua L, Gong Z, Li Q, Shultz LD, Ren G. 2020. Dual roles of neutrophils in metastatic colonization are governed by the host NK cell status. Nat. Commun. 11, 4387. ( 10.1038/s41467-020-18125-0) [DOI] [PMC free article] [PubMed] [Google Scholar]
- 111.Spiegel A, et al. 2016. Neutrophils suppress intraluminal NK cell-mediated tumor cell clearance and enhance extravasation of disseminated carcinoma cells. Cancer Discov. 6, 630-49. ( 10.1158/2159-8290.CD-15-1157) [DOI] [PMC free article] [PubMed] [Google Scholar]
- 112.Grauel AL, et al. 2020. TGFβ-blockade uncovers stromal plasticity in tumors by revealing the existence of a subset of interferon-licensed fibroblasts. Nat. Commun. 11, 6315. ( 10.1038/s41467-020-19920-5) [DOI] [PMC free article] [PubMed] [Google Scholar]
- 113.Broad RV, Jones SJ, Teske MC, Wastall LM, Hanby AM, Thorne JL, Hughes TA. 2021. Inhibition of interferon-signalling halts cancer-associated fibroblast-dependent protection of breast cancer cells from chemotherapy. Br. J. Cancer 124, 1110-1120. ( 10.1038/s41416-020-01226-4) [DOI] [PMC free article] [PubMed] [Google Scholar]
- 114.Liu T, Han C, Wang S, Fang P, Ma Z, Xu L, Yin R. 2019. Cancer-associated fibroblasts: an emerging target of anti-cancer immunotherapy. J. Hematol. Oncol. 12, 86. ( 10.1186/s13045-019-0770-1) [DOI] [PMC free article] [PubMed] [Google Scholar]
- 115.Cho C, et al. 2020. Cancer-associated fibroblasts downregulate type I interferon receptor to stimulate intratumoral stromagenesis. Oncogene 39, 6129-6137. ( 10.1038/s41388-020-01424-7) [DOI] [PMC free article] [PubMed] [Google Scholar]
- 116.Lee J, Lee D, Lawler S, Kim Y. 2021. Role of neutrophil extracellular traps in regulation of lung cancer invasion and metastasis: structural insights from a computational model. PLoS Comput. Biol. 17, e1008257. ( 10.1371/journal.pcbi.1008257) [DOI] [PMC free article] [PubMed] [Google Scholar]
- 117.Houghton AM, et al. 2010. Neutrophil elastase-mediated degradation of IRS-1 accelerates lung tumor growth. Nat. Med. 16, 219-223. ( 10.1038/nm.2084) [DOI] [PMC free article] [PubMed] [Google Scholar]
- 118.Sangaletti S, et al. 2014. Defective stromal remodeling and neutrophil extracellular traps in lymphoid tissues favor the transition from autoimmunity to lymphoma. Cancer Discov. 4, 110-129. ( 10.1158/2159-8290.CD-13-0276) [DOI] [PubMed] [Google Scholar]
- 119.Uribe-Querol E, Rosales C. 2015. Neutrophils in cancer: two sides of the same coin. J. Immunol. Res. 2015, 983698. ( 10.1155/2015/983698) [DOI] [PMC free article] [PubMed] [Google Scholar]
- 120.Park J, et al. 2016. Cancer cells induce metastasis-supporting neutrophil extracellular DNA traps. Sci. Transl. Med. 8, 361ra138. ( 10.1126/scitranslmed.aag1711) [DOI] [PMC free article] [PubMed] [Google Scholar]
- 121.Fares J, Fares MY, Khachfe HH, Salhab HA, Fares Y. 2020. Molecular principles of metastasis: a hallmark of cancer revisited. Signal Transduct. Target Ther. 5, 28. ( 10.1038/s41392-020-0134-x) [DOI] [PMC free article] [PubMed] [Google Scholar]
- 122.Das A, Monteiro M, Barai A, Kumar S, Sen S. 2017. MMP Proteolytic activity regulates cancer invasiveness by modulating integrins. Sci. Rep. 7, 14219. ( 10.1038/s41598-017-14340-w) [DOI] [PMC free article] [PubMed] [Google Scholar]
- 123.Arelaki S, et al. 2016. Gradient infiltration of neutrophil extracellular traps in colon cancer and evidence for their involvement in tumour growth. PLoS ONE 11, e0154484. ( 10.1371/journal.pone.0154484) [DOI] [PMC free article] [PubMed] [Google Scholar]
- 124.Cools-Lartigue J, Spicer J, Najmeh S, Ferri L. 2014. Neutrophil extracellular traps in cancer progression. Cell Mol. Life Sci. 71, 4179-4194. ( 10.1007/s00018-014-1683-3) [DOI] [PMC free article] [PubMed] [Google Scholar]
- 125.Demers M, Wagner DD. 2013. Neutrophil extracellular traps: a new link to cancer-associated thrombosis and potential implications for tumor progression. Oncoimmunology 2, e22946. ( 10.4161/onci.22946) [DOI] [PMC free article] [PubMed] [Google Scholar]
- 126.Wculek SK, Malanchi I. 2015. Neutrophils support lung colonization of metastasis-initiating breast cancer cells. Nature 528, 413-417. ( 10.1038/nature16140) [DOI] [PMC free article] [PubMed] [Google Scholar]
- 127.Tohme S, et al. 2016. Neutrophil extracellular traps promote the development and progression of liver metastases after surgical stress. Cancer Res. 76, 1367-1380. ( 10.1158/0008-5472.CAN-15-1591) [DOI] [PMC free article] [PubMed] [Google Scholar]
- 128.Aspirin AP, Kim Y. 2020. Polytherapeutic strategies with oncolytic virus-bortezomib and adjuvant NK cells in cancer treatment. J. R. Soc. Interface 18, 20200669. ( 10.1098/rsif.2020.0669) [DOI] [PMC free article] [PubMed] [Google Scholar]
- 129.Göllmann L, Maurer H. 2018. Optimal control problems with time delays: two case studies in biomedicine. Math. Biosci. Eng. 15, 1137-1154. ( 10.3934/mbe.2018051) [DOI] [PubMed] [Google Scholar]
- 130.Ledzewicz U, Wang S, Schättler H, André N, Heng MA, Pasquier E. 2017. On drug resistance and metronomic chemotherapy: a mathematical modeling and optimal control approach. Math. Biosci. Eng. 4, 217-235. ( 10.3934/mbe.2017014) [DOI] [PubMed] [Google Scholar]
- 131.Rihan FA, Lakshmanan S, Maurer H. 2019. Optimal control of tumour-immune model with time-delay and immuno-chemotherapy. Appl. Math. Comput. 353, 147-165. ( 10.1016/j.amc.2019.02.002) [DOI] [Google Scholar]
- 132.Rodríguez CR, Calvo GF, Ramis-Conde I, Belmonte-Beitia J. 2017. Stochastic modelling of slow-progressing tumors: analysis and applications to the cell interplay and control of low grade gliomas. Commun. Nonlinear Sci. Numer. Simul. 49, 63-80. ( 10.1016/j.cnsns.2017.02.008) [DOI] [Google Scholar]
- 133.Schättler H, Ledzewicz U. 2015. Optimal control for mathematical models of cancer therapies. In An application of geometric methods. New York, NY: Springer.
- 134.Ledzewicz U, Brown T, Schättler H. 2004. Comparison of optimal controls for a model in cancer chemotherapy with L1- and L2-type objectives. Optim. Methods Softw. 19, 339-350. ( 10.1080/10556780410001683104) [DOI] [Google Scholar]
- 135.Amulic B, Cazalet C, Hayes GL, Metzler KD, Zychlinsky A. 2012. Neutrophil function: from mechanisms to disease. Annu. Rev. Immunol. 30, 459-489. ( 10.1146/annurev-immunol-020711-074942) [DOI] [PubMed] [Google Scholar]
- 136.Xu Y, et al. 2013. Cigarette smoke (CS) and nicotine delay neutrophil spontaneous death via suppressing production of diphosphoinositol pentakisphosphate. Proc. Natl Acad. Sci. USA 110, 7726-7731. ( 10.1073/pnas.1302906110) [DOI] [PMC free article] [PubMed] [Google Scholar]
- 137.Kasahara Y, Iwai K, Yachie A, Ohta K, Konno A, Seki H, Miyawaki T, Taniguchi N. 1997. Involvement of reactive oxygen intermediates in spontaneous and CD95 (Fas/APO-1)-mediated apoptosis of neutrophils. Blood 89, 1748-1753. ( 10.1182/blood.V89.5.1748) [DOI] [PubMed] [Google Scholar]
- 138.Dibbert B, Weber M, Nikolaizik WH, Vogt P, Schöni MH, Blaser K, Simon HU. 1999. Cytokine-mediated Bax deficiency and consequent delayed neutrophil apoptosis: a general mechanism to accumulate effector cells in inflammation. Proc. Natl Acad. Sci. USA 96, 13 330-13 335. ( 10.1073/pnas.96.23.13330) [DOI] [PMC free article] [PubMed] [Google Scholar]
- 139.Gabelloni ML, Trevani AS, Sabatte J, Geffner J. 2013. Mechanisms regulating neutrophil survival and cell death. Semin. Immunopathol. 35, 423-437. ( 10.1007/s00281-013-0364-x) [DOI] [PubMed] [Google Scholar]
- 140.Ibrahim SA, Kulshrestha A, Katara GK, Beaman KD. 2017. Delayed neutrophil apoptosis is regulated by cancer associated a2 isoform vacuolar ATPase. J. Immunol. 198(1 Suppl), 76.15. [Google Scholar]
- 141.Kuijpers T, Lutter R. 2012. Inflammation and repeated infections in CGD: two sides of a coin. Cell Mol. Life Sci. 69, 7-15. ( 10.1007/s00018-011-0834-z) [DOI] [PMC free article] [PubMed] [Google Scholar]
- 142.Takeshima T, Pop LM, Laine A, Iyengar P, Hannan ESVR. 2016. Key role for neutrophils in radiation-induced antitumor immune responses: potentiation with G-CSF. Proc. Natl Acad. Sci. USA 113, 11 300-11 305. ( 10.1073/pnas.1613187113) [DOI] [PMC free article] [PubMed] [Google Scholar]
- 143.Andzinski L, Wu CF, Lienenklaus S, Kroger A, Weiss S, Jablonska J. 2015. Delayed apoptosis of tumor associated neutrophils in the absence of endogenous IFN-β. Int. J. Cancer 136, 572-583. ( 10.1002/ijc.28957) [DOI] [PubMed] [Google Scholar]
- 144.Basin M, Rodriguez-Gonzalez J, Martinez-Zuniga R. 2004. Optimal control for linear systems with time delay in control input. J. Franklin Inst. 341, 267-278. ( 10.1016/j.jfranklin.2003.12.004) [DOI] [Google Scholar]
- 145.Forde JE, Ciupe SM, Cintron-Arias A, Lenhart S. 2016. Optimal control of drug therapy in a hepatitis B model. Appl. Sci. 6, 219. ( 10.3390/app6080219) [DOI] [Google Scholar]
- 146.Jean-Quartier C, Jeanquartier F, Jurisica I, Holzinger A. 2018. In silico cancer research towards 3R. BMC Cancer 18, 408. ( 10.1186/s12885-018-4302-0) [DOI] [PMC free article] [PubMed] [Google Scholar]
- 147.Vermolen FJ, van der Meijden RP, van Es M, Gefen A, Weihs D. 2015. Towards a mathematical formalism for semi-stochastic cell-level computational modeling of tumor initiation. Ann. Biomed. Eng. 43, 1680-1694. ( 10.1007/s10439-015-1271-1) [DOI] [PMC free article] [PubMed] [Google Scholar]
- 148.Aguda BD, Kim Y, Hunter MG, Friedman A, Marsh CB. 2008. MicroRNA regulation of a cancer network: consequences of the feedback loops involving miR-17-92, E2F, and Myc. Proc. Natl Acad. Sci. USA 105, 19 678-19 683. ( 10.1073/pnas.0811166106) [DOI] [PMC free article] [PubMed] [Google Scholar]
- 149.Jenner AL, Kim PS, Frascoli F. 2019. Oncolytic virotherapy for tumours following a Gompertz growth law. J. Theor. Biol. 480, 129-140. ( 10.1016/j.jtbi.2019.08.002) [DOI] [PubMed] [Google Scholar]
- 150.Aguda BD, Kim Y, Kim HS, Friedman A, Fine H. 2011. Qualitative network modeling of the MYC-p53 control system of cell proliferation and differentiation. Biophys. J. 101, 2082-2091. ( 10.1016/j.bpj.2011.09.052) [DOI] [PMC free article] [PubMed] [Google Scholar]
- 151.Aspirin AP, Kim Y. 2021. Polytherapeutic strategies with oncolytic virus-bortezomib and adjuvant NK cells in cancer treatment. J. R. Soc. Interface 18, 20200669. ( 10.1098/rsif.2020.0669) [DOI] [PMC free article] [PubMed] [Google Scholar]
- 152.Reyes AAVL, Jung E, Kim Y. 2015. Optimal control strategies of eradicating invisible glioblastoma cells after conventional surgery. J. R. Soc. Interface 12, 20141392. ( 10.1098/rsif.2014.1392) [DOI] [PMC free article] [PubMed] [Google Scholar]
- 153.Villasana M, Radunskaya A. 2003. A delay differential equation model for tumor growth. J. Math. Biol. 47, 270-94. ( 10.1007/s00285-003-0211-0) [DOI] [PubMed] [Google Scholar]
- 154.Bernabeu MO, et al. 2020. Abnormal morphology biases hematocrit distribution in tumor vasculature and contributes to heterogeneity in tissue oxygenation. Proc. Natl Acad. Sci. USA 117, 27 811-27 819. ( 10.1073/pnas.2007770117) [DOI] [PMC free article] [PubMed] [Google Scholar]
- 155.Friedman A, Kim Y. 2011. Tumor cells proliferation and migration under the influence of their microenvironment. Math. Biosci. Eng. 8, 373-385. [DOI] [PubMed] [Google Scholar]
- 156.Kim Y, Boushaba K. 2011. An enzyme kinetics model of tumor dormancy, regulation of secondary metastases. Discrete Continuous Dyn. Syst.-S 4, 1465-1498. ( 10.3934/dcdss.2011.4.1465) [DOI] [Google Scholar]
- 157.Kim Y, Roh S, Lawler S, Friedman A. 2011. miR451 and AMPK/MARK mutual antagonism in glioma cells migration and proliferation. PLoS ONE 6, e28293. ( 10.1371/journal.pone.0028293) [DOI] [PMC free article] [PubMed] [Google Scholar]
- 158.Kim Y, Lee HG, Dmitrieva N, Kim J, Kaur B, Friedman A. 2014. Choindroitinase ABC I-mediated enhancement of oncolytic virus spread and anti-tumor efficacy: a mathematical model. PLoS ONE 9, e102499. ( 10.1371/journal.pone.0102499) [DOI] [PMC free article] [PubMed] [Google Scholar]
- 159.Kim Y, Lee J, Lee D, Othmer HG. 2019. Synergistic effects of bortezomib-OV therapy and anti-invasive strategies in glioblastoma: a mathematical model. Cancers 11, 215. ( 10.3390/cancers11020215) [DOI] [PMC free article] [PubMed] [Google Scholar]
- 160.Lee HG, Kim Y. 2016. The role of the microenvironment in regulation of CSPG-driven invasive and non-invasive tumor growth in glioblastoma. Japan J. Indust. Appl. Math. 32, 771-805. ( 10.1007/s13160-015-0188-2) [DOI] [Google Scholar]
- 161.Lee W, Lim S, Kim Y. 2017. The role of myosin II in glioma invasion: a mathematical model. PLoS ONE 12, e0171312. ( 10.1371/journal.pone.0171312) [DOI] [PMC free article] [PubMed] [Google Scholar]
- 162.Rejniak K. 2007. An immersed boundary framework for modelling the growth of individual cells: an application to the early tumour development. J. Theor. Biol. 247, 186-204. ( 10.1016/j.jtbi.2007.02.019) [DOI] [PubMed] [Google Scholar]
- 163.Macklin P, Edgerton ME, Thompson AM, Cristini V. 2012. Patient-calibrated agent-based modelling of ductal carcinoma in situ (DCIS): from microscopic measurements to macroscopic predictions of clinical progression. J. Theor. Biol. 301, 122-140. ( 10.1016/j.jtbi.2012.02.002) [DOI] [PMC free article] [PubMed] [Google Scholar]
- 164.Lambert B, MacLean AL, Fletcher AG, Combes AN, Little MH, Byrne HM. 2018. Bayesian inference of agent-based models: a tool for studying kidney branching morphogenesis. J. Math. Biol. 76, 1673-1697. ( 10.1007/s00285-018-1208-z) [DOI] [PMC free article] [PubMed] [Google Scholar]
- 165.Drasdo D, Hohme S. 2005. A single-cell-based model of tumor growth in vitro: monolayers and spheroids. Phys. Biol. 2, 133-147. ( 10.1088/1478-3975/2/3/001) [DOI] [PubMed] [Google Scholar]
- 166.Kim Y, Lee D, Lawler S. 2020. Collective invasion of glioma cells through OCT1 signalling and interaction with reactive astrocytes after surgery. Phil. Trans. R. Soc. B 375, 20190390. ( 10.1098/rstb.2019.0390) [DOI] [PMC free article] [PubMed] [Google Scholar]
- 167.Damaghi M, et al. 2021. The harsh microenvironment in early breast cancer selects for a Warburg phenotype. Proc. Natl Acad. Sci. USA 118, e2011342118. ( 10.1073/pnas.2011342118) [DOI] [PMC free article] [PubMed] [Google Scholar]
- 168.Rejniak KA, Anderson ARA. 2011. Hybrid models of tumor growth. WIRES Syst. Biol. Med. 3, 115-125. ( 10.1002/wsbm.102) [DOI] [PMC free article] [PubMed] [Google Scholar]
- 169.Kim Y, Stolarska M, Othmer HG. 2007. A hybrid model for tumor spheroid growth in vitro I: theoretical development and early results. Math. Models Methods Appl. Sci. 17, 1773-1798. ( 10.1142/S0218202507002479) [DOI] [Google Scholar]
- 170.Kim Y. 2013. Regulation of cell proliferation and migration in glioblastoma: new therapeutic approach. Front. Mol. Cellular Oncol. 3, 53. ( 10.3389/fonc.2013.00053) [DOI] [PMC free article] [PubMed] [Google Scholar]
- 171.Kim Y, Roh S. 2013. A hybrid model for cell proliferation and migration in glioblastoma. Discrete Continuous Dyn. Syst.-B 18, 969-1015. ( 10.3934/dcdsb.2013.18.969) [DOI] [Google Scholar]
- 172.Kim Y, Othmer H. 2015. Hybrid models of cell and tissue dynamics in tumor growth. Math. Biosci. Eng. 12, 1141-1156. ( 10.3934/mbe.2015.12.1141) [DOI] [PMC free article] [PubMed] [Google Scholar]
- 173.Kim Y, Powathil G, Kang H, Trucu D, Kim H, Lawler S, Chaplain M. 2015. Strategies of eradicating glioma cells: a multi-scale mathematical model with miR-451-AMPK-mTOR control. PLoS ONE 10, e0114370. ( 10.3389/fonc.2013.00053) [DOI] [PMC free article] [PubMed] [Google Scholar]
- 174.Metzcar J, Wang Y, Heiland R, Macklin P. 2019. A review of cell-based computational modeling in cancer biology. JCO Clin. Cancer Inform. 3, 1-13. ( 10.1200/CCI.18.00069) [DOI] [PMC free article] [PubMed] [Google Scholar]
- 175.Stolarska M, Kim Y, Othmer HG. 2009. Multiscale models of cell and tissue dynamics. Phil. Trans. R. Soc. A 367, 3525-3553. ( 10.1098/rsta.2009.0095) [DOI] [PMC free article] [PubMed] [Google Scholar]
- 176.Kim Y, Kang H, Powathil G, Kim H, Trucu D, Lee W, Lawler S, Chaplain M. 2018. Role of extracellular matrix and microenvironment in regulation of tumor growth and LAR-mediated invasion in glioblastoma. PLoS ONE 13, e0204865. ( 10.1371/journal.pone.0204865) [DOI] [PMC free article] [PubMed] [Google Scholar]
Associated Data
This section collects any data citations, data availability statements, or supplementary materials included in this article.
Supplementary Materials
Data Availability Statement
We deposited all codes and data within the Dryad Digital Repository: https://doi.org/10.5061/dryad.g79cnp5r0. We have two files: (1) README.txt (2) data_RSOS-210705.zip. Here, the zip file contains all codes and data.


