Abstract
Cavitation is the fundamental physical mechanism of various focused ultrasound (FUS)-mediated therapies in the brain. Accurately knowing the 3D location of cavitation in real-time can improve the targeting accuracy and avoid off-target tissue damage. Existing techniques for 3D passive transcranial cavitation detection require the use of expensive and complicated hemispherical phased arrays with 128 or 256 elements. The objective of this study was to investigate the feasibility of using four sensors for transcranial 3D localization of cavitation. Differential microbubble cavitation detection combined with the time difference of arrival algorithm was developed for the localization using the four sensors. Numerical simulation using k-Wave toolbox was performed to validate the proposed method for transcranial cavitation source localization. The sensors with a center frequency of 2.25 MHz and a 6-dB bandwidth of 1.39 MHz were used to locate cavitation generated by FUS (500 kHz) sonication of microbubbles that were injected into a tube positioned inside an ex vivo human skullcap. Cavitation emissions from the microbubbles were detected transcranially using the four sensors. Both simulation and experimental studies found that the proposed method achieved accurate 3D cavitation localization. when the cavitation source was located within 30 mm from the geometric center of the sensor network, the accuracy of the localization method with the skull was measured to be 1.9 ± 1.0 mm, which was not significantly different from that without the skull (1.7 ± 0.5 mm). The accuracy decreased as the cavitation source was away from the geometric center of the sensor network. It also decreased as the pulse length increased. Its accuracy was not significantly affected by the sensor position relative to the skull. In summary, four sensors combined with the proposed localization algorithm offer a simple approach for 3D transcranial cavitation localization.
Keywords: cavitation, transcranial localization, focused ultrasound, microbubbles
I. Introduction
The recent two decades have witnessed the fast development of focused ultrasound (FUS) techniques for neurological applications that employ cavitation as the primary physical mechanism, such as FUS combined with microbubble-mediated blood-brain barrier (BBB) disruption for targeted drug delivery [1]–[4], cavitation-enhanced nonthermal ablation [5][6], transcranial histotripsy [7][8], and FUS-enabled liquid biopsy [9]–[11]. Real-time three-dimensional (3D) transcranial cavitation localization is critical in these applications to ensure precise targeting of the FUS and avoid off-target tissue damage. However, transcranial cavitation localization faces the major challenge presented by the skull, which induces significant phase aberration and amplitude attenuation to the transcranial detected cavitation signals [12][13].
The widely used passive cavitation detection technique utilizes a single-element ultrasound sensor to detect the presence of cavitation by analyzing the spectral characteristics of the detected acoustic emissions[14]–[19]. A single element sensor can locate cavitation if a focused sensor is used; however, such sensor prone to missing cavitation events that originate from outside its focal region. A non-focused sensor has a larger sensing volume, but it cannot spatially locate the cavitation. Dual passive cavitation detectors, consisting of a pair of orthogonally and confocally aligned sensors, were developed to improve the spatial specificity in the detection of cavitation induced by shock wave lithotripsy [20], [21]. But same as the single-element sensor, the dual detectors could not precisely locate the 3D position of cavitation events. 2D passive cavitation imaging (PCI) uses commercially available ultrasound imaging probes to passively map the spatial distribution of cavitation in 2D [22]–[24]. Recently, 3D PCI using customized hemispherical phased arrays with 128 or 256 elements combined with beamforming and computed tomography (CT)-based skull aberration correction algorithms were introduced for 3D imaging of cavitation during FUS-mediated BBB disruption [25]–[27]. A 256-element hemispherical phased array was developed for mapping cavitation activity in 3D for monitoring transcranial histotripsy therapy [7]. The hemispherical phased array-based approach has the advantage that it can display the spatial distribution of cavitation activity in 3D; however, it requires expensive and customized phased arrays, which hinders the broad application of this approach.
A previous study proposed the use of three sensors combined with the time difference of arrival algorithm for 2D cavitation localization in water and ex vivo chicken-breast tissue [28]. Expanding on this previous work, the objective of the current study was to evaluate the feasibility of using a minimal set of sensors (four sensors) for 3D transcranial localization of microbubble cavitation. Four miniaturized ultrasound sensors were used for transcranial detection of cavitation signals emitted from microbubbles flowing through a tube when sonicated by a FUS transducer in a water tank. Differential microbubble cavitation signals were obtained by subtracting signals received without and with microbubbles under the same FUS sonication condition. The time differences of arrival of signals received by three sensors relative to the fourth one were then calculated by finding the maximum cross-correlation of the corresponding differential microbubble cavitation signals. The 3D cavitation location was then estimated using the time difference of arrival algorithm. The proposed transcranial cavitation localization method combined the differential microbubble cavitation signal detection with the time difference of arrival algorithm. The accuracy of the described localization method was assessed by numerical simulation and experimental evaluation using an ex vivo human skullcap.
II. METHODS
A. Sensor network design
A device for 3D cavitation localization using four sensors (S1, S2, S3, and S4) was designed and fabricated. The four sensors were identical circular-shaped planar ultrasound transducers with a center frequency of 2.25 MHz, a 6-dB bandwidth of 1.39 MHz, and an aperture of 6 mm (model V323-SM, Olympus America Inc., Waltham, MA, USA). They were distributed on a hemisphere with a radius of 90 mm.
As shown in Fig. 1(a), S2–S4 had an equally-spaced radial distribution in the horizontal plane along a circle with a radius of 78 mm. S1 was positioned along the axis of the sphere at the bottom with the vertical distance between S1 and the horizontal plane being 45 mm. The center of S1 was defined as the [0, 0, 0] coordinates, so the geometry center of the sensor network was at [0, 0, 90]. This design was chosen to allow the sensors to fit the shape of an ex vivo adult skullcap shown in Fig. 1(b). The skullcap was approximately the top half of the human skull. A cartoon illustration of the four-sensor design for transcranial cavitation localization is presented in Fig.1(c).
Fig. 1.
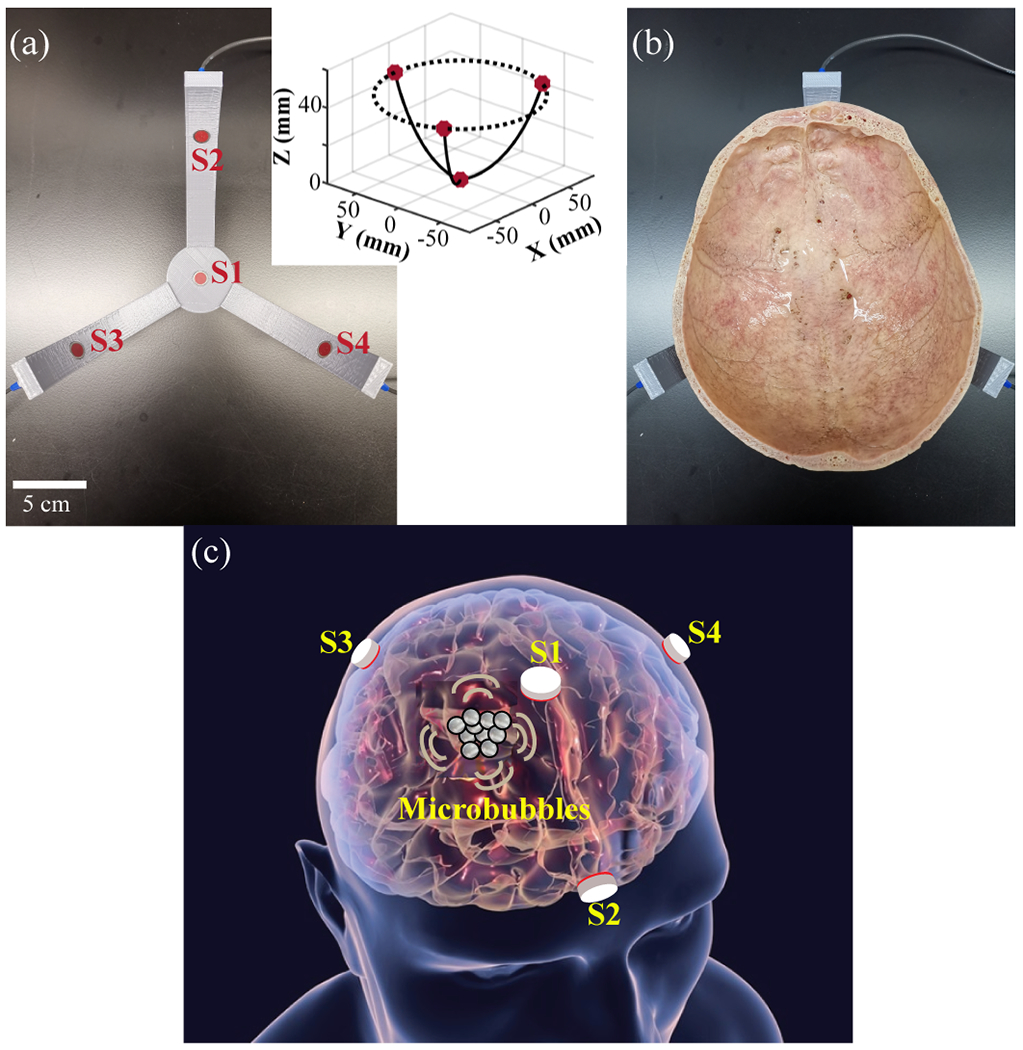
(a) Picture of the four-sensor network designed for transcranial cavitation localization. The insert shows the 3D coordinates of the sensor network. (b) Picture of the four-sensor network with an ex vivo human skullcap. (c) Cartoon illustration of the four-sensor network design for transcranial cavitation localization in human (the grey circles represent microbubbles).
B. Experimental setup
To evaluate the performance of the four-sensor network in 3D cavitation localization, we used a FUS transducer to sonicate microbubbles in a rubber tube (3 mm inner diameter and 5 mm outer diameter) positioned above the skull cavity, as shown in Fig. 2(a). The skull, which was dry from storage in air, was immersed in water and degassed for a minimum of 48 hours in a vacuum chamber at −0.1 MPa measured by a pressure gauge (Nisshin 1.6, Nisshin Seifun Group Inc., Tokyo, Japan) to eliminate air bubbles trapped in the porous bones before experiments. The sensor network, skull, and tube were placed in an acrylic tank filled with room-temperature degassed water. Home-made microbubbles, which were prepared according to a previously described protocol [29], were injected into the tube using a syringe. The size and concentration of the microbubbles were measured using an image-based cell counter (Countess™ II FL, Thermo Fisher Scientific Inc., USA) and found to be ~4.5 μm in mean diameter and ~1.0×10⁸ microbubbles/mL in concentration. The microbubbles were diluted to a concentration of ~6.0×10⁵ microbubbles/mL before injection into the tube. The FUS transducer (H204, Sonic concept, WA, USA) had a center frequency of 500 kHz, an aperture of 82.0 mm, a center opening of 56.0 mm in diameter, and a radius of curvature of 63.2 mm. Based on the hydrophone calibration, the amplitude of the side lobe is −8.3 dB of the amplitude of the main lobe. It was driven by a function generator (Model 33500B, Keysight Technologies Inc., Englewood, CO, USA) connected to a 53-dB RF power amplifier (1020L, Electronics & Innovation, Rochester, NY, USA). The pressure at the focus of the transducer was calibrated by a hydrophone (HNC-0200, Onda, Sunnyvale, CA, USA), and the reported pressure was the measured peak negative pressure. The tube was connected to the FUS transducer using a 3D-printed frame. The FUS transducer focus was aligned at the center of the tube under the guidance of ultrasound imaging. The ultrasound imaging guidance was achieved by a 128-element linear ultrasound imaging probe (ATL L7-4, Philips Healthcare) that was inserted into the central opening of the FUS transducer (Fig. 2(b)). The imaging probe was controlled by the Verasonics system (Verasonics, Inc., Redmond, WA, USA) to acquire B-mode images, and the central location of the FUS focus was marked by a cross on the B-mode images based on the hydrophone calibration of the FUS focus location (Fig. 2(c)). The position of the tube along with the FUS transducer was adjusted by a 3D positioner. The position of S1 was adjusted so that its central axis was aligned with the FUS focus under the guidance of B-mode imaging (Fig. 2(d–e)).
Fig. 2.
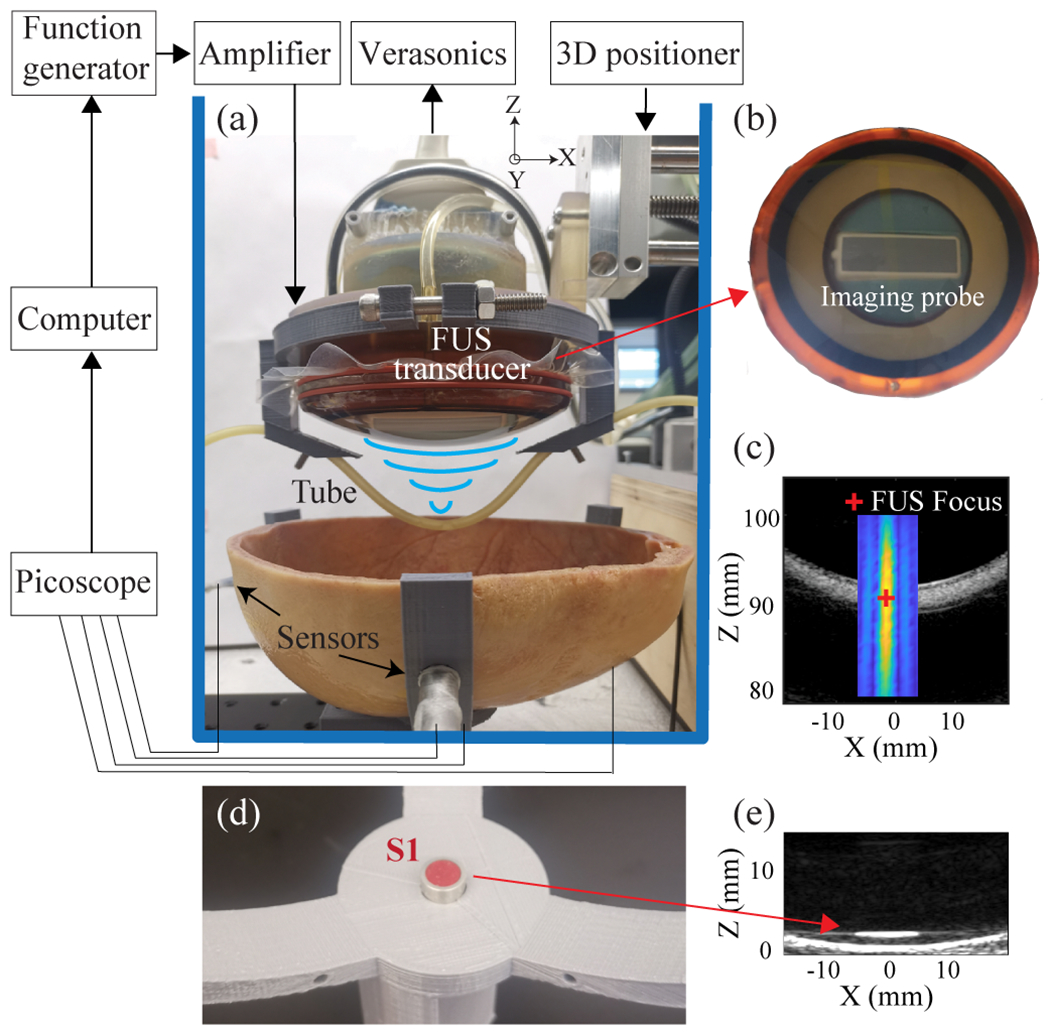
(a) Schematic of the experimental setup. (b) The ultrasound imaging probe was inserted into the central opening of the FUS transducer. (c) The B-mode image of the tube with an overlay of the 2D profile of the FUS beam. The red marker indicates the central location of FUS focus measured based on hydrophone calibration of the FUS transducer. (d) Picture of sensor 1 (S1). (e) B-mode image of S1 was used to align the center of S1 with the FUS focus.
The cavitation signals detected by the four sensors were recorded by a 14-bit digital oscilloscope (Picoscope 5442D, Pico Technology Ltd, St Neots, UK) and stored in a computer for post-processing. Fig. 3 (a) and (b) representatively show the attenuation effect of the skull on the acquired cavitation signals in time- and frequency-domain, respectively. The skull attenuation was 13.7 dB calculated based on the signals shown in Fig. 3.
Fig. 3.
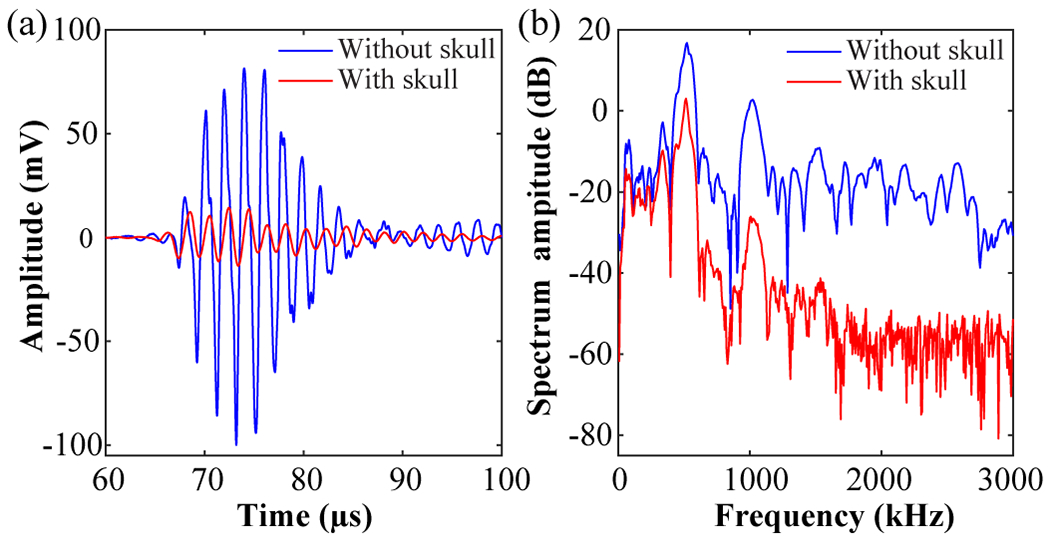
Representative cavitation signals acquired by one sensor without and with the skull in (a) time domain and (b) frequency domain.
C. 3D cavitation localization method
Differential microbubble cavitation signal detection was combined with the time difference of arrival algorithm for transcranial 3D cavitation localization.
1). Differential microbubble cavitation signal detection
In order to isolate the cavitation signals from the background noise, differential microbubble cavitation detection was performed by subtracting signals received without and with microbubbles under the same FUS sonication condition. As illustrated by Fig. 4(a), signals without and with microbubbles under FUS sonication were acquired. We then subtracted the reference signals (without microbubbles) from the signals with microbubbles to extract the acoustic emissions from the microbubbles (Fig. 4(b)).
Fig. 4.
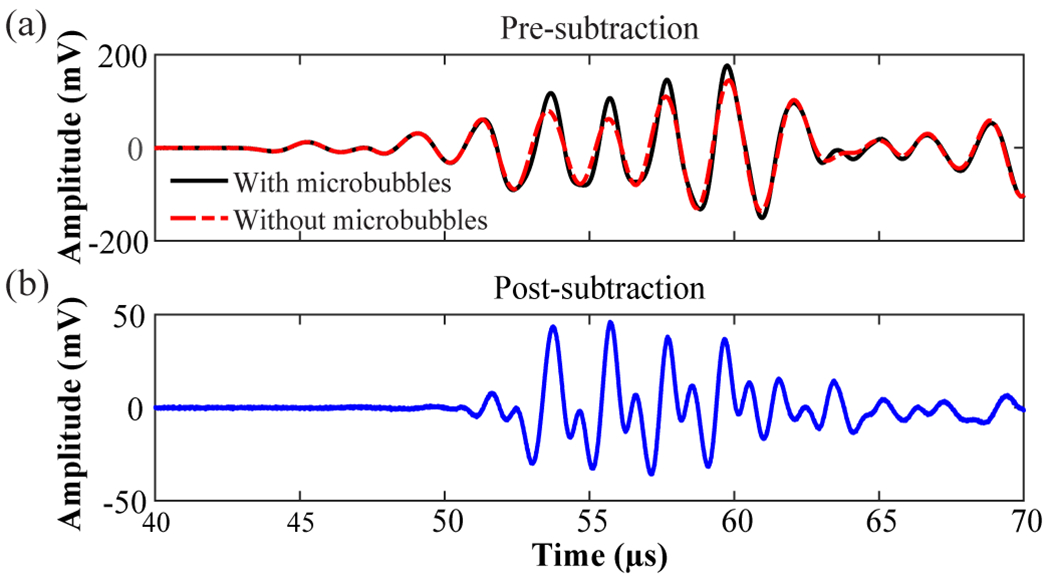
Illustration of differential microbubble cavitation signal detection acquired by S1. (a) Overlay of transcranially detected signals obtained with and without microbubbles. (b) Subtraction of the signal without microbubbles from that with microbubbles to extract the microbubble cavitation signal.
2). Time difference of arrival algorithm
The time difference of arrival algorithm relies on the assumption that the signals emitted from a source arrive at spatially separated sensors at slightly different times due to unequal source-sensor distances [30], which is the algorithm commonly used in GPS [31], sonar [32], and robotics [33] for 3D localization. The time differences of arrivals of the signals acquired by S2–S4 in reference to that obtained by S1 were calculated by finding the maximum cross-correlation of the corresponding differential microbubble cavitation signals (Fig. 5). The length of the temporal window of the cross-correlation was 110 μs, which was the length of each acquired signal.
Fig. 5.
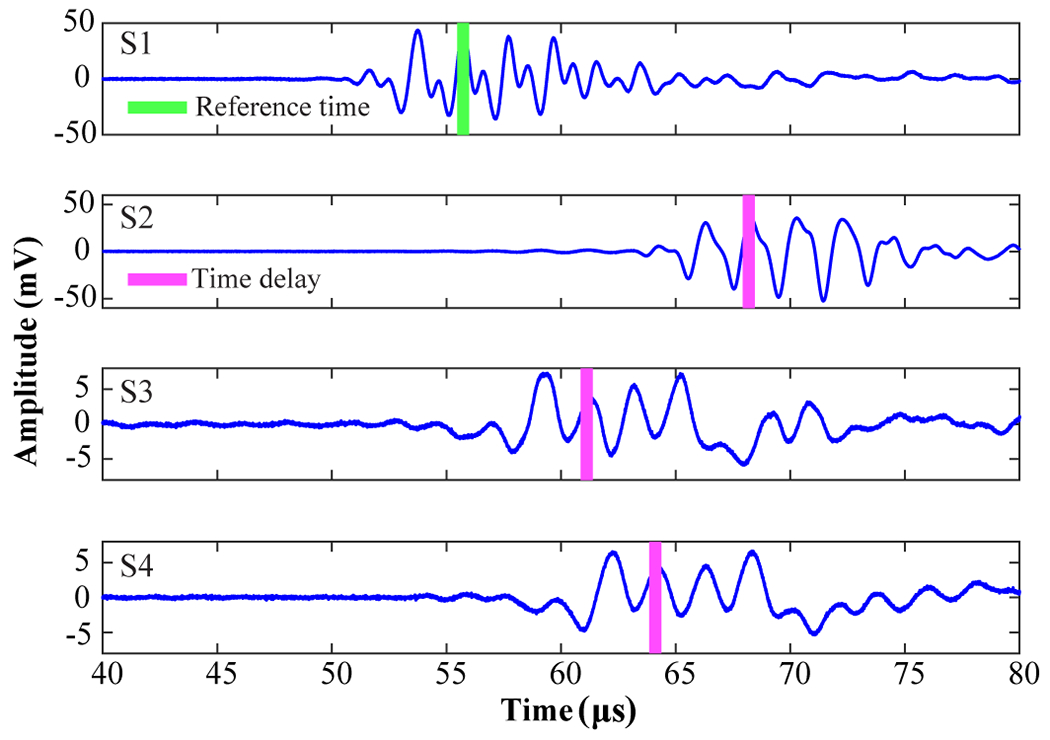
Time delays of differential microbubble cavitation signals obtained by S2–S4 relative to S1. The vertical green bar indicates the time delay of the maximum differential microbubble cavitation signal for S1. The pink bars indicate the time delays of the differential microbubble cavitation signals for S2–S4 relative to S1.
The estimated time differences of arrival were used for cavitation source location using the time difference of arrival algorithm. Here, let the source be at an unknown position and the sensors at known locations , so the squared distance between the source and sensor is
| (1) |
Where , , and can be acquired based on time-difference of arrival as , c is the speed of the water (1480 m/s). can be written as
| (2) |
Where Equation (2) can be solved by the following equation:
| (3) |
Combining (3) and (1) at obtains a quadratic equation in . Then, the substitution of the positive value of back into (3) produces the solution for the cavitation location
D. Numerical simulation
3D numerical simulation was performed to evaluate the accuracy of the proposed method using a k-space pseudo-spectral method based solver, k-Wave [34]. Cluster computing with three graphics processing units (Nvidia Tesla V100, Nvidia Corp., Santa Clara, CA, USA) was used to accelerate the 3D simulation. CT image (Fig. 6(a)) of the human skullcap shown in Fig. 1(a) was obtained using a human CT scanner (Brilliance Big Bore, Philips Healthcare, Cleveland, OH, USA). The CT images consisted of 512 × 512 × 214 voxels with a spatial resolution of 0.3359 mm in the transverse plane (XZ plane) and 1.0000 mm in the axial direction (Y axis). After linear interpolation, the voxel spacing of the images was unified and adjusted to 0.2960 mm, which was less than 1/10 of the FUS transducer’s wavelength. The density and sound speed of the skull were converted from the Hounsfield units of the CT images by the function ‘hounsfield2density’ in the k-Wave toolbox. This function uses a piecewise linear fit to the data reported by Schneider and Mast [35]. A Courant–Friedrichs–Lewy (CFL) stability factor of 0.17 was used in all the simulations.
Fig. 6.

(a) CT scan of the ex vivo human skullcap. (b) Cavitation source and sensor locations used in the k-Wave simulation. (c) Examples of the simulated signals acquired by S1 without and with the skull.
The locations of the four sensors relative to the skull in the simulation were the same as those shown in Fig. 1(a) and (b). Each sensor was modeled as a point receiver. The cavitation source was simulated as a point source emitting a 5-cycle pulse with a center frequency of 500 kHz. Simulations were performed for 19 cavitation source locations centered around the geometry center of the sensor-network at [0, 0, 90] mm (Fig. 6(b)). The setting source locations were separated by 10 mm between two adjacent points and span [−30, 30] mm along the X-axis, [−30, 30] mm along Y-axis, and [60, 120] mm along the Z-axis. The time difference of arrival algorithm was used to estimate the location of each simulated cavitation source based on the received transcranial signals by the four sensors. The signals received by the sensors were directly emitted from the simulated cavitation source; therefore, there was no need to calculate the differential microbubble cavitation signals. The localization accuracy was quantified by the Euclidean distance between the setting source locations and the corresponding estimated locations. Simulations were performed both with and without the skull to evaluate the effects of the skull on the accuracy of the proposed method.
To study the impact of incorporating skull aberration correction into the proposed localization method, we calculated the skull-induced phased delays for cavitation source located at the geometric center of the sensor network and applied these delays to the cavitation location estimation of all points (Fig. 6(c)). A similar approach was used in a previous study on 3D passive cavitation detection using a phased array [7].
The impact of noise on the proposed method was evaluated by adding random white noise of various signal-to-noise ratios (SNRs) to the simulated cavitation signals to locate the source at [0, 0, 90] mm. The function ‘awgn’ in MATLAB 2019b (The MathWorks, Inc., Natick, MA) was used, which can measure the power of input signal in dBW and add the setting power of white Gaussian noise to the input signal. The SNRs ranged from 0 to 25 dB with a step size of 1 dB and three simulations were repeated for each SNR.
The effect of the distance between the cavitation source and the skull on the localization accuracy was investigated. The source localization varied from 5 mm to 60 mm away from the inner surface of the skull along the X-, Y-, and Z-axis in a step size of 5 mm.
The impact of sensor distance from the out surface of the skull was also studied. The sensors were moved away from the out surface of the skull by 5 cm, 10 cm, and 15 cm in the radial direction.
The capability of the proposed method in locating multiple sources was also explored. Three simulated cavitation sources were spaced 1.0 to 2.0 times to the source pulse length (5 to 10 wavelengths) apart along the z-axis (Fig .7(a)). Representative signals received by the four sensors are shown in Fig. 7(b). In this case, the distance between two adjacent sources was 2.0 times to the source pulse length (10 wavelengths) along the z-axis. In order to calculate the location of the sources, the signals were divided into three segments, corresponding to the emission from the three sources, respectively. Each segment from the four sensors was processed using the proposed method to estimate the position of each cavitation source.
Fig. 7.
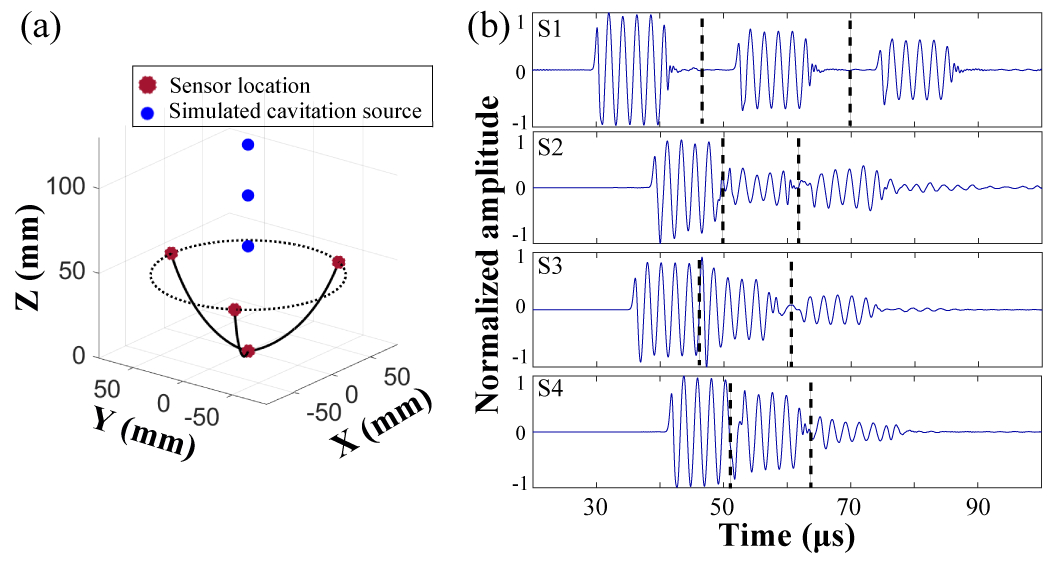
Transcranial multiple sources localization. (a) Illustration to show the locations of the three adjacent sources. (b) Representative received signals by sensors (S1 to S4), which were divided into three segments for estimation the locations of the three sources.
E. Experimental evaluation
For the experimental evaluation, the FUS transducer together with the tube was adjusted by the 3D positioner to move the FUS focus to the same 19 positions illustrated in Fig. 6(b). The 19 points were centered around the geometry center of the sensor network at [0, 0, 90] mm.
At each location, the FUS transducer was excited by a 5-cycle pulse with a center frequency of 500 kHz at a 1 Hz pulse repetition frequency (PRF). The peak negative pressure at the focus was 0.4 MPa. The received cavitation signals were processed using the localization method described above. The localization error of the algorithm was calculated by the offset between the estimated locations and the FUS focus location. The FUS focus location was used to represent the cavitation source location. Three repeat experiments on different days were performed with and without the skull, and each experiment acquired 10 repeated measurements.
The sensor locations were adjusted to assess the effect of sensor position on the accuracy of the proposed method. The frontal and occipital bones are thicker than other parts of the skull, and the internal microstructure of these two regions is more complex than other parts of the skull. Three representative positions for the sensors were selected in this study with S2 positioned in contact with the midline of the frontal bone, the midline of the occipital bone, and away from the midline of the frontal and occipital bones, respectively (Fig. 8). All the studies described above were conducted with the sensor location shown in Fig. 8(a), which was the same as Fig. 1(b). In this study, the FUS focus was aligned at the geometry center of the sensor network, and the FUS parameters were the same as those described above.
Fig. 8.
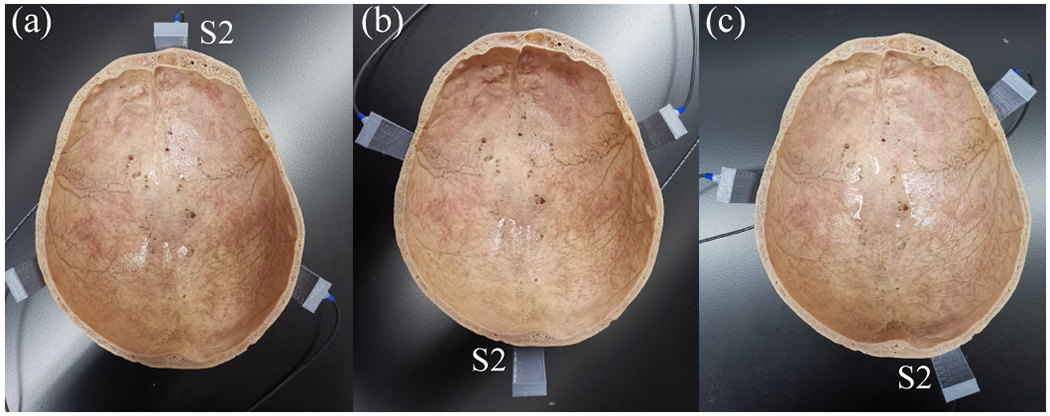
Different sensor positions. (a) Position 1 (P1): S2 in contact with the midline of the frontal bone. (b) P2: S2 in contact with the midline of the occipital bone. (c) P3: S2 was off the midline of the frontal and occipital bone
In addition, the effect of the FUS pulse length on the accuracy of the 3D cavitation localization was evaluated. The sensor positions were kept the same as that shown in Fig. 8(a). The FUS parameters were the same as the above study with the only difference in that the pulse duration was 5, 10, 100, 500, or 1000 cycles.
F. Statistical analysis
The measured data are presented as mean ± standard deviation. Statistical analyses were performed with GraphPad Prism (Version 8.3, GraphPad Software Inc., La Jolla, CA, USA). Comparisons of the 3D cavitation localization accuracy among different groups were conducted using unpaired t-test (two independent groups), or one-way analysis of variance (ANOVA) test (multiple independent groups). A P-value <0.05 was used to determine statistical significance.
III. RESULTS
A. Numerical simulation
Fig. 9(a) and (b) present the tracking accuracy of simulated cavitation source localization without skull in XY and XZ plane, respectively. The localization error without the skull in 3D was 0.04 ± 0.02 mm. Fig. 9(c) and (d) present the transcranial tracking accuracy for simulated cavitation sources located in the XY and XZ plane, respectively, for the 19 locations (Fig. 6(b)). The localization error in 3D was found to be 1.1 ± 0.3 mm, ranging from 0.7 mm to 2.0 mm after averaging over the 19 locations. Fig. 9(e) and (f) show the corresponding transcranial tracking accuracy with skull aberration correction. After incorporating the skull-induced aberration correction, the transcranial localization error was reduced to 0.8 ± 0.6 mm, ranging from 0.2 mm to 1.9 mm. The localization accuracy without skull was significantly higher than that with skull, but no statistically significant difference was found between without and with skull correction (Fig. 9(g)).
Fig. 9.

Simulated cavitation source locations and estimated locations without the skull (a, b), with the skull and no correction (c, d) and with the skull incorporating skull aberration correction (e, f) in the XY- and XZ-plane, respectively. The blue circle represents the simulated cavitation source location, and the red circle represents the estimated location. (g) Bar plot of the 3D localization error without the skull, with the skull and incorporating skull aberration correction for the 19 locations. The error bar denotes the standard deviation. ****P < 0.0001.
Fig. 10(a) presents the 3D location error at various SNRs. The data were fitted with a 4th-degree polynomial. Based on the results, the localization error decreases as the SNR increases. Fig. 10(b) displays the 3D location error when the cavitation source was at different distances away from the inner surface of the skull. The localization error increased when the source distance decreased to less than ~20 mm from the skull in the x-, y-, and z-axis.
Fig. 10.

(a) Simulated 3D localization error at various SNR. (b) Simulated 3D localization error as the cavitation source away from the inner surface of the skull. (c) Simulated 3D localization error as the sensors moved away from the outer surface of the skull. (d) The 3D transcranial cavitation localization error for three sources with different distances (1.0 to 2.0 normalized to the source pulse length (5 cycles at 500 kHz)) between adjacent sources.
Fig. 10(c) shows the 3D location error when the sensors were at different distances away from the surface of the skull. The localization errors were 1.1 ± 0.3 mm, 2.5 ± 1.6 mm, 3.4 ± 1.6 mm, and 4.9 ± 2.0 mm for sensors located at 0 cm, 5 cm, 10 cm, and 15 cm away from the skull surface, respectively. The localization error increased when the sensors were further away from the skull surface. The localization error for three sources is shown in Fig. 10(d). The localization error decreased from 10.9 ± 6.8 mm, 4.7 ± 3.1 mm, 3.1 ± 2.7 mm, 2.1 ± 2.0 mm, 1.2 ± 0.5 mm, to 1.0 ± 0.1 mm when the distances between two adjacent sources increased from five to ten wavelengths.
B. Experimental evaluations
Fig. 11(a) and (b) show the experimental estimated cavitation locations without the skull for the 19 locations in the XY and XZ planes, respectively. Fig. 11(c) and (d) display the experimental results with the skull in the XY and XZ planes, respectively. The average localization error in 3D was 1.9 ± 1.0 mm, ranging from 1.0 mm to 4.9 mm with the skull, and 1.7 ± 0.5 mm, ranging from 0.8 mm to 2.9 mm without the skull for the 19 locations. No statistical significance was found between the 3D localization error with and without skull (Fig. 11(e)).
Fig. 11.
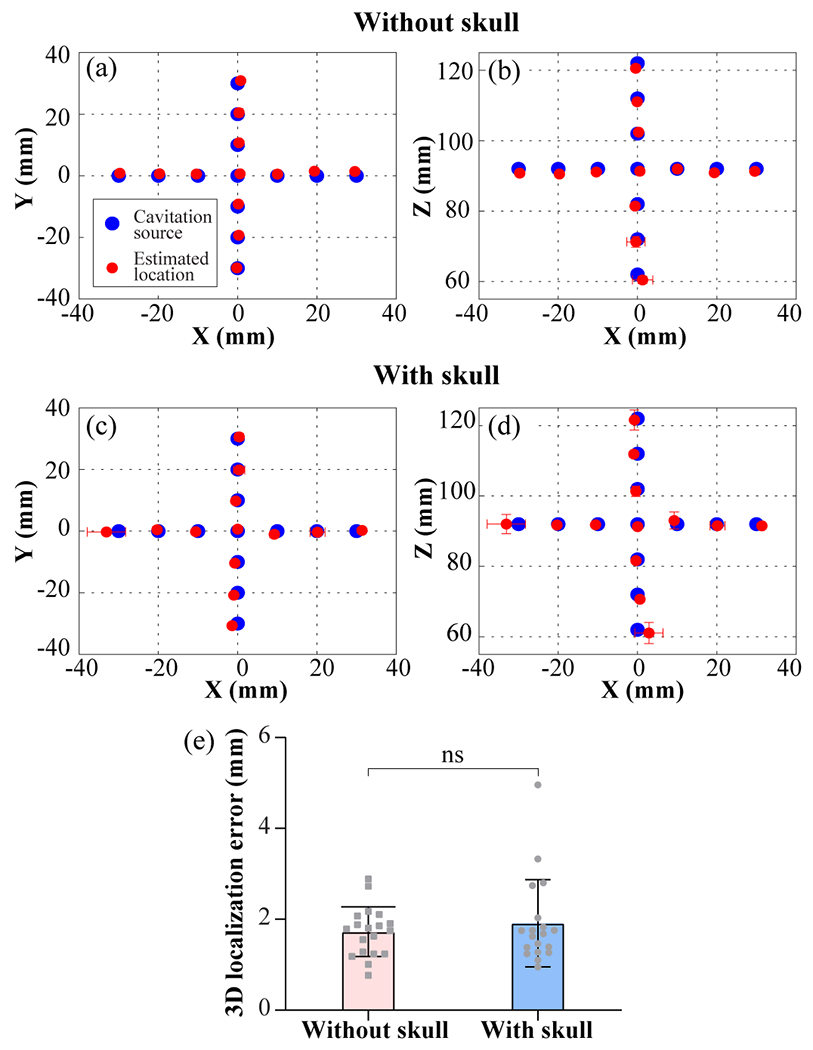
Experimental cavitation source positions and estimated locations without (a, b) and with (c, d) the skull in the XY- and XZ-plane, respectively. The blue circle represents the cavitation source location. The red circle represents the mean value of the estimated cavitation source location over 30 replicates, and each error bar represents the standard deviation along the axis. (e) Bar plot of the 3D localization error without and with the skull for the 19 locations. Each data point represents the mean value of the 3D localization error for each cavitation source location.
Fig. 12 plots the transcranial cavitation localization accuracy for cavitation source located along the X-, Y-, and Z-axis separately. Within the range of 10, 20, and 30 mm, the localization error was measured to be 1.3 ± 0.4 mm, 1.4 ± 0.6 mm, 1.9 ± 1.0 mm, respectively. The localization error shows a trend of increasing as the source was further away from the geometry center of the sensor network.
Fig. 12.
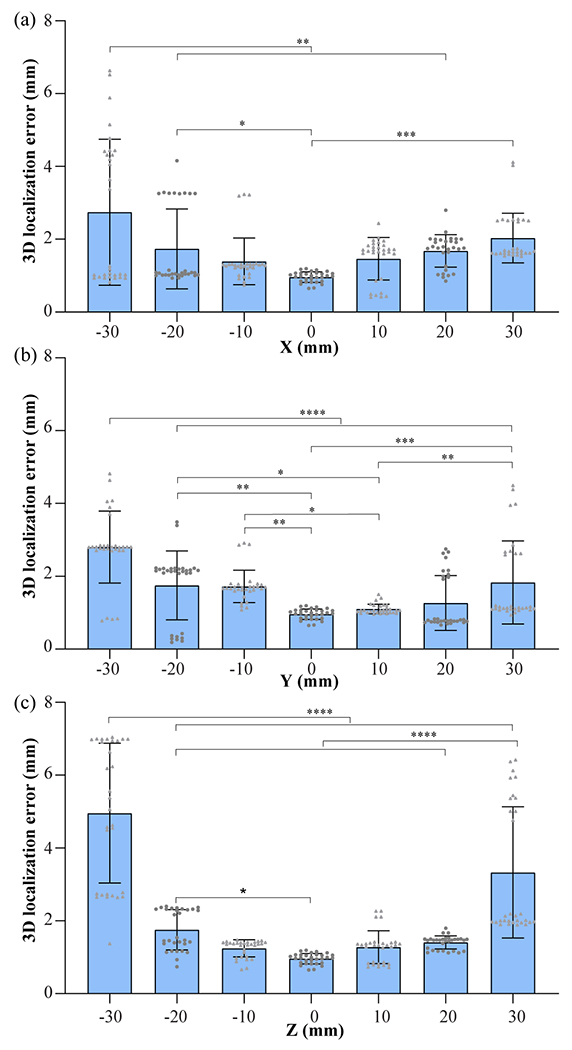
3D cavitation localization errors with the skull for cavitation source located along the X- (a), Y- (b), and Z-axis (c) (30 replicated measurements for each location). * P < 0.05, ** P < 0.01, *** P < 0.001, and **** P < 0.0001.
The selection of which sensor to be used as the reference sensor did not affect the location accuracy, as shown in Fig. 13(a). Fig. 13(b) shows the localization error at different sensor positions: P1, P2, and P3, as shown in Fig. 8. The localization errors were 1.0 ± 0.1 mm, 1.1 ± 0.2 mm, and 1.1 ± 0.2 mm for P1, P2, and P3, respectively. There were no significant differences in the localization errors among the three groups. Fig. 13(c) displays the measured 3D localization error at different FUS pulse lengths. The localization errors were about 1.0 ± 0.1 mm, 1.4 ± 1.1 mm, 24.0 ± 30.0 mm, 110.0 ± 50.0 mm and 86.0 ± 32.0 mm for FUS cycle number of 5, 10, 100, 500, and 1000, respectively.
Fig. 13.
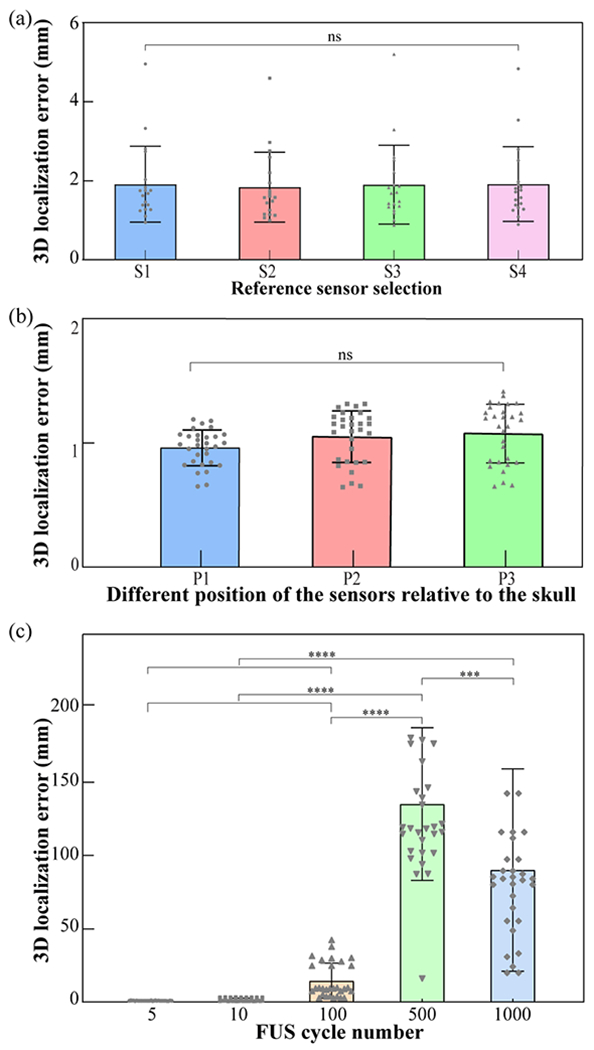
(a) Localization error quantification for using S1, S2, S3, or S4 as the reference sensor. (b) The 3D transcranial cavitation localization error for different sensor positions (P1, P2, and P3) as Fig. 8 shown. (c) The 3D transcranial cavitation localization error at different FUS pulse lengths when the source was located at the geometric focus of the sensor network.
IV. DISCUSSION
This study proposed to use four sensors combined with differential microbubble cavitation detection and time difference of arrival algorithm for 3D transcranial cavitation localization. Numerical simulation and experimental evaluation verified the accuracy of the proposed method. Its accuracy in 3D transcranial cavitation localization was not affected by the sensor position around the skull and the selection of the reference sensor, but decreased when the cavitation source away from the geometry center of the sensor network, when the sensors moved away from the skull surface, when the SNR of received signal increased, and when the FUS pulse length increased.
The use of three sensors for 2D localization of cavitation generated by high-intensity focused ultrasound was proposed by a previous report [28]. The accuracy was found to be in the 2–4 mm range in water and ex vivo chicken breast. We extended this previous work and demonstrated, for the first time, that four sensors were sufficient for 3D transcranial cavitation localization. The accuracy of the four sensors was 1.9 ± 1.0 mm when the cavitation source was located within 30 mm from the geometry center of the sensor network, which was not significantly different from that without the skull (1.7 ± 0.5 mm). This localization error was higher than that reported for 3D PCI using a hemispherical phased array, which was reported to be 0.3 ± 0.2 mm in ex vivo experiment with human skullcaps after skull aberration corrections [26] and 0.9 ± 0.6 mm during an in vivo study of microbubble-mediated nonthermal ablation in rabbit brain [36]. Although higher accuracy could be achieved using 3D PCI, the requirements of customized and expensive phased arrays hinder the broad application of 3D PCI. The four-sensor approach has the limitation that it only provides the 3D coordinates of cavitation and cannot display 3D cavitation maps. However, the 3D location information is critical for verifying that cavitation occurs at the FUS-targeted location to ensure precise targeting and avoid off-target tissue damage. The localization accuracy decreased as the cavitation source was away from the geometric center of the sensor network (Fig. 12). This is because the sensor’s sensitivity decreases away from the center, contributing to reduced localization accuracy. This proof-of-concept study only used one configuration of the sensors to demonstrate its feasibility in 3D cavitation location. The localization accuracy can be improved in the future by optimizing the sensors (e.g., directivity and sensitivity) and their configuration.
The localization method was demonstrated to be accurate based on both numerical simulation and experimental validation. The delay-and-sum beamforming algorithm has been commonly used for cavitation location in 2D and 3D PCI. The aberration of the received signals caused by the skull has to be corrected to calculate the absolution time of arrival in the delay-and-sum beamforming algorithm. In contrast, the proposed method is based on the time difference of arrival between two sensors. The relative time difference calculation minimized the skull effect, which simplified the 3D localization algorithm. Based on the numerical study, for this skull, the localization error can be reduced after incorporating skull aberration correction into the localization method but cannot achieve statistically significant reduction when the cavitation source was located within 30 mm from the geometry center of the sensor network (Fig. 9). The experimental studies found that the accuracy of the proposed method was not significantly different when comparing with and without the skull (Fig. 11). The experimental studies also found that the localization accuracy was not affected by the selection of the reference sensor (Fig. 13(a)) and the positioning of the sensors around the skull (Fig. 13(b)).
The proposed method provides an affordable, convenient and fast approach for 3D cavitation localization. However, this technique has several limitations. First, the localization error was relatively high for detecting cavitation near the skull and away from the geometrical center of the sensor network. It suggests that when using the proposed method for cavitation localization, the sensor network should be designed so that its geometrical center is aligned at where the cavitation is likely to occur, such as enlarge the radius of the sensor network and translated head inside the array to align the geometric center with cavitation source. Second, the localization accuracy decreased as the FUS pulse length increased (Fig. 13(c)), which is a known limitation of the time difference of arrival-based technique [37], [38]. Our proposed method is not suitable for transcranial localization using long pulse lengths. It can be applied for cavitation localization in short-burst FUS-BBBD. Short-burst FUS-BBBD was reported to avoid standing wave effects [39] and achieve uniform drug delivery using short bursts (5-cycle with a PRF of 1.25 kHz) [40]. For FUS-BBBD treatment and other microbubble-mediated techniques (e.g., cavitation-enhanced nonthermal ablation [5][6] and FUS-enabled liquid biopsy [9]–[11]) that use pulses with long durations, the proposed method can be used to localize the cavitation in 3D and verify the targeting is precise using short pulses before performing the procedure with long pulses. But it should be employed with extreme caution, since the spatial distribution of cavitation activity may be different between short and long pulse lengths. Third, the localization method has the potential to locate multiple concurrent cavitation events when the time-domain signals from multiple cavitation sources are not overlapping (Fig. 10(d)); however, if the signals from multiple cavitation sources overlap, the proposed method cannot detect them. Phased arrays with more sensors will be needed for the detection of multiple closely located cavitation sources.
V. CONCLUSION
A method for transcranial 3D microbubble cavitation localization using four sensors was presented. The accuracy of the proposed method was validated by both numerical simulations and experimental studies using an ex vivo human skull phantom. Future research is needed to evaluate the accuracy of the proposed method in vivo.
Acknowledgment
The authors would like to thank Dr. Amy Bauernfeind at Washington University in St. Louis for providing the skullcap used in this study and Dr. Jochen Cammin at Washington University in St. Louis for providing the CT scan of the skull.
This work was supported in part by the Office of Naval Research (grant number # N00014-19-1-2335). It was also partially supported by the National Institutes of Health grants (R01EB027223, R01EB030102, and R01MH116981), the Charlie Teo Foundation, and Little Legs Foundation.
Contributor Information
Zhongtao Hu, Department of Biomedical Engineering, Washington University in St. Louis, St. Louis, MO 63105 USA.
Lu Xu, Department of Biomedical Engineering, Washington University in St. Louis, St. Louis, MO 63105 USA.
Chih-Yen Chien, Department of Biomedical Engineering, Washington University in St. Louis, St. Louis, MO 63105 USA.
Yaoheng Yang, Department of Biomedical Engineering, Washington University in St. Louis, St. Louis, MO 63105 USA.
Yan Gong, Department of Biomedical Engineering, Washington University in St. Louis, St. Louis, MO 63105 USA.
Dezhuang Ye, Department of Biomedical Engineering, Washington University in St. Louis, St. Louis, MO 63105 USA.
Christopher Pham Pacia, Department of Biomedical Engineering, Washington University in St. Louis, St. Louis, MO 63105 USA.
Hong Chen, Department of Biomedical Engineering, Washington University in St. Louis, St. Louis, MO 63105 USA and with the Department of Radiation Oncology, Washington University School of Medicine, St. Louis, MO 63110 USA.
References
- [1].Lipsman N et al. , “Blood–brain barrier opening in Alzheimer’s disease using MR-guided focused ultrasound,” Nat. Commun, vol. 9, no. 1, pp. 1–8, 2018, doi: 10.1038/s41467-018-04529-6. [DOI] [PMC free article] [PubMed] [Google Scholar]
- [2].Abrahao A et al. , “First-in-human trial of blood–brain barrier opening in amyotrophic lateral sclerosis using MR-guided focused ultrasound,” Nat. Commun, vol. 10, no. 1, p. 4373, Dec. 2019, doi: 10.1038/s41467-019-12426-9. [DOI] [PMC free article] [PubMed] [Google Scholar]
- [3].Rezai AR et al. , “Noninvasive hippocampal blood−brain barrier opening in Alzheimer’s disease with focused ultrasound,” Proc. Natl. Acad. Sci. U. S. A, vol. 117, no. 17, pp. 9180–9182, 2020, doi: 10.1073/pnas.2002571117. [DOI] [PMC free article] [PubMed] [Google Scholar]
- [4].Park SH et al. , “One-year outcome of multiple blood–brain barrier disruptions with temozolomide for the treatment of glioblastoma,” Front. Oncol, vol. 10, pp. 1–7, 2020, doi: 10.3389/fonc.2020.01663. [DOI] [PMC free article] [PubMed] [Google Scholar]
- [5].McDannold N, Zhang YZ, Power C, Jolesz F, and Vykhodtseva N, “Nonthermal ablation with microbubble-enhanced focused ultrasound close to the optic tract without affecting nerve function,” J. Neurosurg, 2013, doi: 10.3171/2013.8.JNS122387. [DOI] [PMC free article] [PubMed] [Google Scholar]
- [6].Peng C et al. , “Intracranial Non-thermal Ablation Mediated by Transcranial Focused Ultrasound and Phase-Shift Nanoemulsions,” Ultrasound Med. Biol, vol. 45, no. 8, pp. 2104–2117, 2019, doi: 10.1016/j.ultrasmedbio.2019.04.010. [DOI] [PMC free article] [PubMed] [Google Scholar]
- [7].Sukovich JR, Macoskey JJ, Lundt JE, Gerhardson TI, Hall TL, and Xu Z, “Real-time transcranial histotripsy treatment localization and mapping using acoustic cavitation emission feedback,” IEEE TranIEEEsactions Ultrason. Ferroelectr. Freq. Control, vol. 67, no. 6, pp. 1–1, 2020, doi: 10.1109/tuffc.2020.2967586. [DOI] [PMC free article] [PubMed] [Google Scholar]
- [8].Gerhardson T et al. , “Histotripsy clot liquefaction in a porcine intracerebral hemorrhage model,” Clin. Neurosurg, vol. 86, no. 3, pp. 429–436, 2020, doi: 10.1093/neuros/nyz089. [DOI] [PMC free article] [PubMed] [Google Scholar]
- [9].Zhu L et al. , “Focused Ultrasound-enabled Brain Tumor Liquid Biopsy,” Sci. Rep, vol. 8, no. 1, pp. 1–9, Dec. 2018, doi: 10.1038/s41598-018-24516-7. [DOI] [PMC free article] [PubMed] [Google Scholar]
- [10].Pacia CP et al. , “Feasibility and safety of focused ultrasound-enabled liquid biopsy in the brain of a porcine model,” Sci. Rep, vol. 10, no. 1, 2020, doi: 10.1038/s41598-020-64440-3. [DOI] [PMC free article] [PubMed] [Google Scholar]
- [11].Zhu L, Id AN, Pham C, Id P, Yue Y, and Id HC, “Focused ultrasound for safe and effective release of brain tumor biomarkers into the peripheral circulation,” PLoS One, vol. 15, no. 6, p. e0234182, 2020, doi: 10.1371/journal.pone.0234182. [DOI] [PMC free article] [PubMed] [Google Scholar]
- [12].Pichardo S, Sin VW, and Hynynen K, “Multi-frequency characterization of the speed of sound and attenuation coefficient for longitudinal transmission of freshly excised human skulls,” Phys. Med. Biol, vol. 56, no. 1, pp. 219–250, 2011, doi: 10.1088/0031-9155/56/1/014. [DOI] [PMC free article] [PubMed] [Google Scholar]
- [13].White PJ, Clement GT, and Hynynen K, “Longitudinal and shear mode ultrasound propagation in human skull bone,” Ultrasound Med. Biol, vol. 32, no. 7, pp. 1085–1096, 2006, doi: 10.1016/j.ultrasmedbio.2006.03.015. [DOI] [PMC free article] [PubMed] [Google Scholar]
- [14].Sun T et al. , “Closed-loop control of targeted ultrasound drug delivery across the blood–brain/tumor barriers in a rat glioma model,” Proc. Natl. Acad. Sci, vol. 114, no. 48, pp. E10281–E10290, 2017, doi: 10.1073/pnas.1713328114. [DOI] [PMC free article] [PubMed] [Google Scholar]
- [15].Lele PP, “Thresholds and mechanisms of ultrasonic damage to organized animal tissues,” Present. Symp. Biol. Eff. Charact. ultrasound sources, Rockville, Md, pp. 78–80, 1977. [Google Scholar]
- [16].Hynynen K, “The threshold for thermally significant cavitation in dog’s thigh muscle in vivo,” Ultrasound Med. Biol, vol. 17, no. 2, pp. 157–169, 1991, doi: 10.1016/0301-5629(91)90123-E. [DOI] [PubMed] [Google Scholar]
- [17].Vykhodtseva NI, Hynynen K, and Damianou C, “Histologic effects of high intensity pulsed ultrasound exposure with subharmonic emission in rabbit brain in vivo,” Ultrasound Med. Biol, vol. 21, no. 7, pp. 969–979, 1995, doi: 10.1016/0301-5629(95)00038-S. [DOI] [PubMed] [Google Scholar]
- [18].Chen H and Konofagou EE, “The size of blood-brain barrier opening induced by focused ultrasound is dictated by the acoustic pressure,” J. Cereb. Blood Flow Metab, vol. 34, no. 7, pp. 1197–1204, 2014, doi: 10.1038/jcbfm.2014.71. [DOI] [PMC free article] [PubMed] [Google Scholar]
- [19].O’Reilly MA and Hynynen K, “Blood-brain barrier: Real-time feedback-controlled focused ultrasound disruption by using an acoustic emissions-based controller,” Radiology, vol. 263, no. 1, pp. 96–106, 2012, doi: 10.1148/radiol.11111417. [DOI] [PMC free article] [PubMed] [Google Scholar]
- [20].Cleveland RO, Sapozhnikov OA, Bailey MR, and Crum LA, “ A dual passive cavitation detector for localized detection of lithotripsy-induced cavitation in vitro ,” J. Acoust. Soc. Am, vol. 107, no. 3, pp. 1745–1758, 2000, doi: 10.1121/1.428572. [DOI] [PubMed] [Google Scholar]
- [21].Bailey MR et al. , “Cavitation detection during shock-wave lithotripsy,” Ultrasound Med. Biol, vol. 31, no. 9, pp. 1245–1256, 2005, doi: 10.1016/j.ultrasmedbio.2005.02.017. [DOI] [PubMed] [Google Scholar]
- [22].Yang Y et al. , “Cavitation dose painting for focused ultrasound-induced blood-brain barrier disruption,” Sci. Rep, vol. 9, no. 1, p. 2840, Dec. 2019, doi: 10.1038/s41598-019-39090-9. [DOI] [PMC free article] [PubMed] [Google Scholar]
- [23].Arvanitis CD, Crake C, McDannold N, and Clement GT, “Passive Acoustic Mapping with the Angular Spectrum Method,” IEEE Trans. Med. Imaging, vol. 36, no. 4, pp. 983–993, 2017, doi: 10.1109/TMI.2016.2643565. [DOI] [PMC free article] [PubMed] [Google Scholar]
- [24].Lin HC, Fan CH, Ho YJ, and Yeh CK, “Dual-frequency chirp excitation for passive cavitation imaging in the brain,” IEEE Trans. Ultrason. Ferroelectr. Freq. Control, vol. 67, no. 6, pp. 1127–1140, Jun. 2020, doi: 10.1109/TUFFC.2020.2964786. [DOI] [PubMed] [Google Scholar]
- [25].Oreilly MA, Jones RM, and Hynynen K, “Three-dimensional transcranial ultrasound imaging of microbubble clouds using a sparse hemispherical array,” IEEE Trans. Biomed. Eng, vol. 61, no. 4, pp. 1285–1294, 2014, doi: 10.1109/TBME.2014.2300838. [DOI] [PMC free article] [PubMed] [Google Scholar]
- [26].Jones RM, O’Reilly M. a., and Hynynen K, “Experimental demonstration of passive acoustic imaging in the human skull cavity using CT-based aberration corrections,” Med. Phys, vol. 42, no. 7, pp. 4385–4400, 2015, doi: 10.1118/1.4922677. [DOI] [PMC free article] [PubMed] [Google Scholar]
- [27].Jones RM, Deng L, Leung K, McMahon D, O’Reilly MA, and Hynynen K, “Three-dimensional transcranial microbubble imaging for guiding volumetric ultrasound-mediated blood-brain barrier opening,” Theranostics, vol. 8, no. 11, p. 2909, 2018, doi: 10.7150/thno.24911. [DOI] [PMC free article] [PubMed] [Google Scholar]
- [28].Lafond M, Asquier N, Mestas JLA, Carpentier A, Umemura SI, and Lafon C, “Evaluation of a three-hydrophone method for 2-d cavitation localization,” IEEE Trans. Ultrason. Ferroelectr. Freq. Control, vol. 65, no. 7, pp. 1093–1101, Jul. 2018, doi: 10.1109/TUFFC.2018.2825233. [DOI] [PubMed] [Google Scholar]
- [29].Feshitan JA, Chen CC, Kwan JJ, and Borden MA, “Microbubble size isolation by differential centrifugation,” J. Colloid Interface Sci, vol. 329, no. 2, pp. 316–324, 2009, doi: 10.1016/j.jcis.2008.09.066. [DOI] [PubMed] [Google Scholar]
- [30].Ho KC, “Bias reduction for an explicit solution of source localization using TDOA,” IEEE Trans. Signal Process, vol. 60, no. 5, pp. 2101–2114, 2012, doi: 10.1109/TSP.2012.2187283. [DOI] [Google Scholar]
- [31].Chan YT and Ho KC, “A Simple and Efficient Estimator for Hyperbolic Location,” IEEE Trans. Signal Process, vol. 42, no. 8, pp. 1905–1915, 1994, doi: 10.1109/78.301830. [DOI] [Google Scholar]
- [32].Glegg SAL, Olivieri MP, Coulson RK, and Smith SM, “A passive sonar system based on an autonomous underwater vehicle,” IEEE J. Ocean. Eng, vol. 26, no. 4, pp. 700–710, 2001, doi: 10.1109/48.972113. [DOI] [Google Scholar]
- [33].Wang K, Liu YH, and Li L, “A simple and parallel algorithm for real-time robot localization by fusing monocular vision and odometry/AHRS sensors,” IEEE/ASME Trans. Mechatronics, vol. 19, no. 4, pp. 1447–1457, 2014, doi: 10.1109/TMECH.2014.2298247. [DOI] [Google Scholar]
- [34].Treeby BE and Cox BT, “k-Wave: MATLAB toolbox for the simulation and reconstruction of photoacoustic wave fields,” J. Biomed. Opt, vol. 15, no. 2, p. 021314, 2010, doi: 10.1117/1.3360308. [DOI] [PubMed] [Google Scholar]
- [35].Schneider U, Pedroni E, and Lomax A, “The calibration of CT Hounsfield units for radiotherapy treatment planning,” Phys. Med. Biol, vol. 41, no. 1, pp. 111–124, 1996, doi: 10.1088/0031-9155/41/1/009. [DOI] [PubMed] [Google Scholar]
- [36].Jones RM, McMahon D, and Hynynen K, “ Ultrafast three-dimensional microbubble imaging in vivo predicts tissue damage volume distributions during nonthermal brain ablation ,” Theranostics, vol. 10, no. 16, pp. 7211–7230, 2020, doi: 10.7150/thno.47281. [DOI] [PMC free article] [PubMed] [Google Scholar]
- [37].Weiss A and Weinstein E., “Fundamental limitations in passive time delay estimation--Part I: Narrow-band systems,” IEEE Trans. Acoust. Signal Process, vol. 31, no. 2, pp. 472–486, 1983, doi: 10.1109/TASSP.1983.1164061. [DOI] [Google Scholar]
- [38].Gillespie D and Macaulay J, “Time of arrival difference estimation for narrow band high frequency echolocation clicks,” J. Acoust. Soc. Am, vol. 146, no. 4, pp. EL387–EL392, 2019, doi: 10.1121/1.5129678. [DOI] [PubMed] [Google Scholar]
- [39].O’Reilly MA, Waspe AC, Ganguly M, and Hynynen K, “Focused-Ultrasound Disruption of the Blood-Brain Barrier Using Closely-Timed Short Pulses: Influence of Sonication Parameters and Injection Rate,” Ultrasound Med. Biol, vol. 37, no. 4, pp. 587–594, 2011, doi: 10.1016/j.ultrasmedbio.2011.01.008. [DOI] [PMC free article] [PubMed] [Google Scholar]
- [40].V Morse S et al. , “Rapid Short-pulse Ultrasound Delivers Drugs Uniformly across the Murine Blood-Brain Barrier with Negligible Disruption.,” Radiology, p. 181625, Mar. 2019, doi: 10.1148/radiol.2019181625. [DOI] [PMC free article] [PubMed] [Google Scholar]


