Abstract
Background and Objectives
Chronic active lesions contribute to multiple sclerosis (MS) severity, but their association with long-term disease progression has not been evaluated yet. White matter (WM) lesions showing linear expansion over time on serial T1- and T2-weighted scans (i.e., slowly expanding lesions [SELs]) have been proposed as a marker of chronic inflammation. In this study, we assessed whether SEL burden and microstructural abnormalities were associated with Expanded Disability Status Scale (EDSS) score worsening and secondary progressive (SP) conversion at 9.1-year follow-up in patients with relapsing-remitting (RR) MS.
Methods
In 52 patients with RRMS, SELs were identified among WM lesions by linearly fitting the Jacobian of the nonlinear deformation field between time points obtained combining 3T brain T1- and T2-weighted scans acquired at baseline and months 6, 12, and 24. Logistic regression analysis was applied to investigate the associations of SEL number, volume, magnetization transfer ratio (MTR), and T1-weighted signal intensity with disability worsening (i.e., EDSS score increase) and SP conversion after a median follow-up of 9.1 years.
Results
At follow-up, 20/52 (38%) patients with MS showed EDSS score worsening; 13/52 (25%) showed SP conversion. A higher baseline EDSS score (for each point higher: OR = 3.15 [95% CI = 1.61; 8.38], p = 0.003), a higher proportion of SELs among baseline lesions (for each % increase: OR = 1.22 [1.04; 1.58], p = 0.04), and lower baseline MTR values of SELs (for each % higher: OR = 0.66 [0.41; 0.92], p = 0.033) were significant independent predictors of EDSS score worsening at follow-up (C-index = 0.892). A higher baseline EDSS score (for each point higher: OR = 6.37 [1.98; 20.53], p = 0.002) and lower baseline MTR values of SELs (for each % higher: OR = 0.48 [0.25; 0.89], p = 0.02) independently predicted SPMS conversion (C-index = 0.947).
Discussion
The proportion of SELs is associated with MS progression after 9 years. More severe SEL microstructural abnormalities independently predict EDSS score worsening and SPMS conversion. The quantification of SEL burden and damage using T1-, T2-weighted, and MTR sequences may identify patients with RRMS at a higher risk of long-term disability progression and SPMS conversion.
Classification of Evidence
This study provides Class III evidence that in patients with RRMS starting treatment with natalizumab or fingolimod, the proportion of SELs on brain MRI was associated with EDSS score worsening and SPMS conversion at 9-year follow-up.
Multiple sclerosis (MS) is a chronic disease of the CNS characterized by heterogeneous pathologic processes, including inflammation, demyelination, and neuroaxonal loss, that contribute to irreversible clinical disability.1,2 Recently, increased attention has been given to chronic inflammation, which is more compartmentalized in the CNS, as one of the most relevant and specific pathologic substrates determining progressive neurodegeneration in this condition.3,4
Pathologic studies have suggested that, especially in the more advanced and progressive phases of the disease, inflammatory infiltrates are mainly localized in the meninges and large perivascular spaces in the absence of a substantial blood-brain barrier damage.5 In addition, up to 57% of white matter (WM) lesions are defined as chronic active since they show a persistent inflammation.3,4
Pathologically, chronic active lesions are typified by a rim of iron-laden activated microglia/macrophages and a slow rate of peripheral ongoing demyelination and axonal loss.3,4 Although pathology is the gold standard to investigate such lesions, recent improvements in MRI technologies have allowed to define promising methods to identify and quantify chronic active lesions in vivo.6,7
Combined pathologic-MRI studies have consistently demonstrated that chronic active lesions show a paramagnetic rim (i.e., iron rim lesions) on susceptibility-based MRI sequences that reflects the pathologically detected peripheral iron-laden microglia.8-14 Moreover, these lesions typically show a slow but gradual increase in size over up to 7 years9,11 associated with a T1 hypointensity that is more severe and progresses at a steeper rate, thus reflecting more severe microstructural abnormalities such as demyelination and axonal loss.8,15 Chronic active lesions are also associated with an increased serum neurofilament light chain level, thus reflecting the concomitant presence of ongoing axonal damage.14
Because chronic active lesions slowly increase in size over time,9,11 WM lesions showing a linear expansion on serial T1- and T2-weighted scans (i.e., slowly expanding lesions [SELs]) have been also proposed as another feasible biomarker of chronic inflammation that can be easily derived from sequences typically acquired in the clinical scenario.7,16-18 Using such an approach, SELs were found more prevalent in patients with primary progressive (PP) MS compared with patients with relapsing-remitting (RR) MS.17 Moreover, they were characterized by lower T1 intensity and magnetization transfer ratio (MTR) compared with non-SELs and by a significant longitudinal decline of T1 signal intensity.16,18
On susceptibility-based MRI sequences,10,12,13 chronic active lesions have been associated with more severe disease course and brain atrophy. At present, SELs have been found to be characterized by a substantial accumulation of T1 hypointense volume that predicted 12-week confirmed composite disability progression after 120 weeks in patients with PPMS.16 However, the relevance of SEL features for disease evolution in patients with RRMS and their characterization, by applying a multiparametric MRI approach, has not been fully explored yet.
The number and volume of SELs are likely to represent a promising biomarker able to predict a more severe disease course, which can be easily available in the clinical setting using conventional T1- and T2-weighted scans. The evaluation of SEL microstructural features using a multiparametric approach including T1 signal intensity19 and MTR20 may further contribute to better characterize the association between SEL features and MS severity and progression. Accordingly, here we evaluated whether the burden and microstructural abnormalities of SELs identified from T1- and T2-weighted sequences and MTR were associated with Expanded Disability Status Scale (EDSS) score worsening21 and development of secondary progressive (SP) MS over a 9.1-year follow-up in patients with RRMS. The primary research question of this study was the following: in patients with RRMS, are the number, volume, and microstructural abnormalities of SELs significantly associated with a higher risk of disability progression and conversion to SPMS after a median follow-up of 9.1 years?
Methods
Standard Protocol Approvals, Registrations, and Patient Consents
Approval was received from the institutional ethical standards committee on human experimentation of IRCCS Ospedale San Raffaele for any experiments using human subjects (Protocol No. 2012-33). Written informed consent was obtained from all patients before study participation according to the Declaration of Helsinki.
Study Design
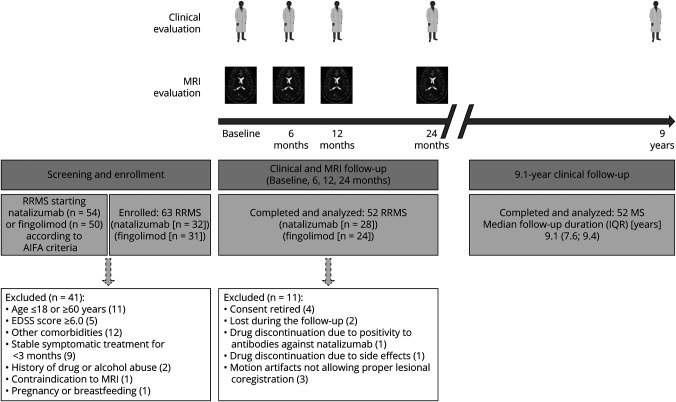
This was a single-center, prospective, longitudinal cohort study that has been performed between September 2011 and July 2016. The study was conducted in our institution (IRCCS San Raffaele Scientific Institute) in RRMS already starting either fingolimod or natalizumab according to Agenzia Italiana del Farmaco (Italian Medicine Agency) criteria. For this reason, the study was not registered in a clinical trial database. Patients with RRMS underwent clinical and MRI evaluation at baseline and months 6, 12, and 24 (2-year follow-up).18 For the current work, a further clinical evaluation was performed in all patients in May 2021 (9.1-year follow-up).
Clinical Evaluation
From 104 screened patients with RRMS starting either fingolimod or natalizumab, 52 patients with RRMS (28 starting natalizumab and 24 fingolimod) participated in a 2-year study18 and were asked to perform a further clinical evaluation (Figure 1 and Table 1). The main inclusion and exclusion criteria and the study flowchart are summarized in Figure 1.
Figure 1. Study Flow Diagram.
AIFA = Agenzia Italiana del Farmaco (Italian Medicine Agency); EDSS = Expanded Disability Status Scale; IQR = interquartile range; RRMS = relapsing-remitting MS. Created with BioRender.com.
Table 1.
Main Demographic, Clinical, and Conventional MRI Findings in the Whole Cohort of Patients With RRMS Evaluated in the Study
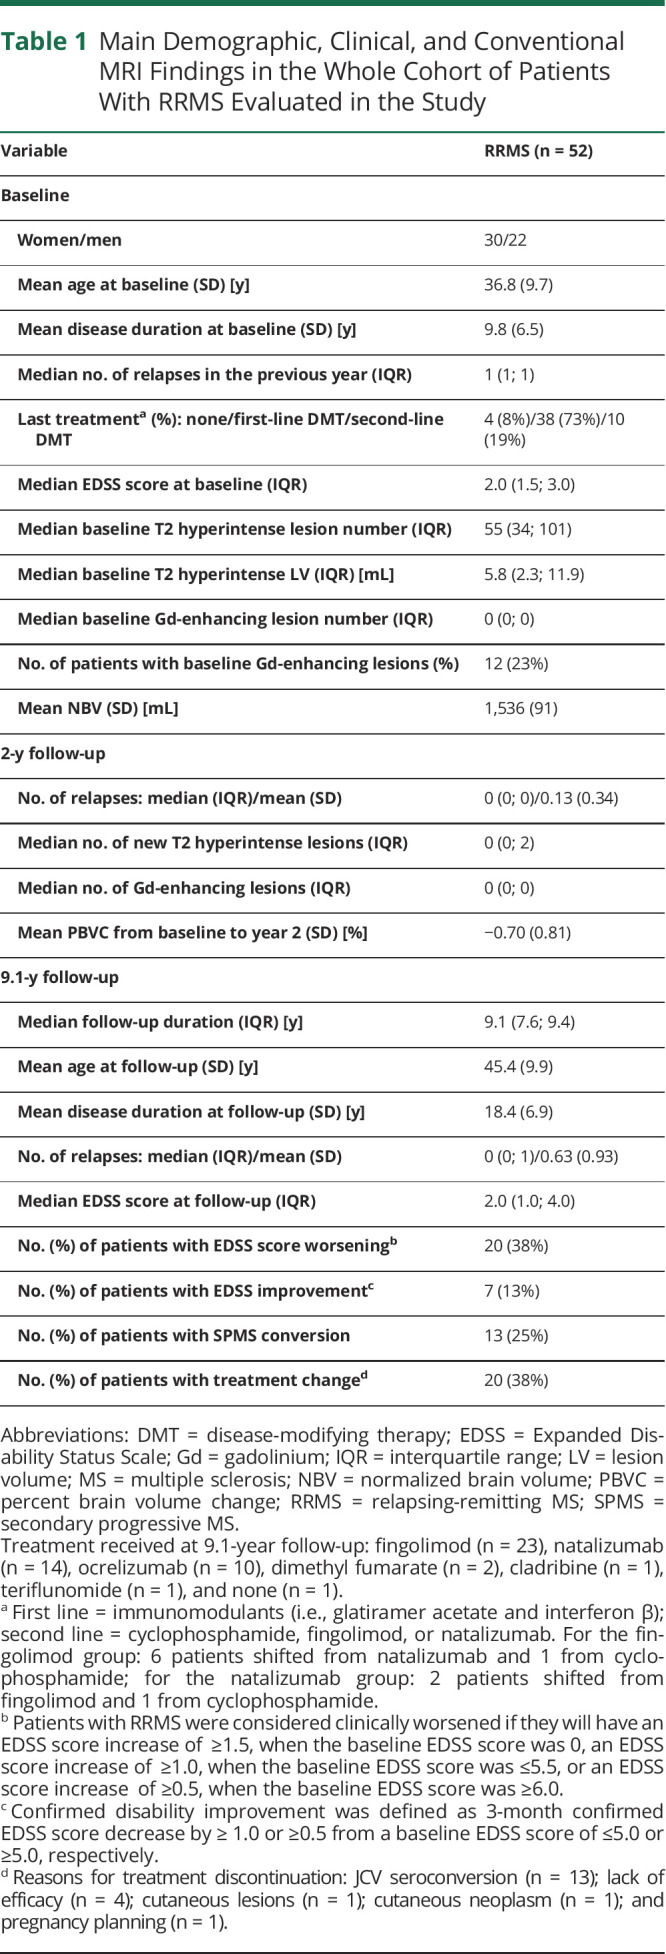
After a median follow-up of 9.1 years (interquartile range [IQR] = 7.6; 9.4 years), the total number of relapses and the EDSS score were assessed. Clinical worsening was defined by an EDSS score increase of ≥1.5, 1.0, or 0.5, confirmed after a 3-month relapse-free period, when the baseline EDSS score was 0, ≤5.5, or ≥6.0, respectively.18 Confirmed disability improvement was defined as 3-month confirmed EDSS score decrease by ≥1.0 or ≥0.5 from a baseline EDSS score of ≤5.0 or ≥5.0, respectively.22 SPMS conversion, defined as development of irreversible EDSS score increase over ≥1 year independent from relapses,23 was also evaluated.
MRI Acquisition
Using a 3.0 T scanner (Intera, Philips Medical Systems, Best, The Netherlands) under a regular maintenance program, the following brain sequences were acquired from all participants at baseline and months 6, 12, and 24:18 (1) dual-echo turbo spin-echo (repetition time [TR]/echo time [TE] = 2,599/16,80 ms; echo train length [ETL] = 6; flip angle [FA] = 90°; matrix size = 256 × 256; field of view [FOV] = 240 × 240 mm2; 44 contiguous, 3-mm-thick axial slices); (2) three-dimensional (3D) T1-weighted fast field echo (FFE) (TR/TE = 25/4.6 ms; FA = 30°; matrix size = 256 × 256; FOV = 230 × 230 mm2; 220 contiguous axial slice; voxel size = 0.89 × 0.89 × 0.8 mm); (3) 3D T1-weighted FFE with and without off-resonance saturation pulses applied (TR/TE = 66/3.8 ms; flip angle = 18°; matrix size = 224 × 224; FOV = 224 mm × 168 mm; 30 contiguous axial slices with voxel size = 1 × 1 × 4 mm); and (4) postcontrast (0.1 mmol/kg of gadolinium [Gd]-DTPA; acquisition delay: 5 minutes) T1-weighted inversion recovery sequence (TR/TE/inversion time [TI] = 2000/10/800 ms; ETL = 5; FA = 90°; matrix size = 400 × 320; FOV = 230 mm × 195.5 mm; 44 contiguous, 3-mm-thick axial slices). For all scans, the slices were positioned parallel to a line joining the most inferoanterior and inferoposterior margins of the corpus callosum, with careful repositioning at follow-up. MRI scans were acquired at least 1 month apart from steroid therapy to limit possible confounding factor due to the pseudoatrophy effect.
Conventional MRI Analysis
At baseline, the number and volume of T2 hyperintense and Gd-enhancing lesions were quantified using a local thresholding segmentation technique (Jim 7.0 software, xinapse.com), as previously described.18 Gd-enhancing and new T2 hyperintense lesion numbers were also evaluated at month 24. At baseline, patients with MS were dichotomized according to the presence or not of at least 1 Gd-enhancing lesion. Normalized brain volume (NBV) and percentage brain volume change (PBVC) between year 2 and baseline were calculated from the 3D T1-weighted images, after lesion filling, by applying SIENAx and SIENA software.
Evaluation of SEL Number and Volume
Regional volume changes over time for each patient were mapped using serial longitudinal registration24 (SPM12 [fil.ion.ucl.ac.uk/spm]). The method achieved within-subject alignment of the serial scans without lesion refilling, applying spatial transformations composed of a diffeomorphic and rigid body part. This step creates a midpoint average template toward which the rate of volume changes is obtained by using the Jacobian determinants of transformations. Regarding the nonlinear registration, we complied with the default settings; the parameters pertain to bias regularization (=1,000,000) and warping regularization, with the absolute displacements and membrane energy of the deformation not penalized, bending energy = 100 and the 2 linear elasticity regularization parameters set to 25 and 100.
Because the registration method does not allow multichannel input images, T1- and T2-weighted images were fused to produce a new contrast image, as previously described25: combined image = (T1 weighted − scaled [s]T2 weighted)/(T1 weighted + sT2 weighted). To this aim, the T1-weighted was skull stripped and rigidly registered to the T2-weighted image, combined to obtain a single combined image, and resampled to the original resolution of the T1-weighted image (0.89 × 0.89 × 0.8 mm). To achieve longitudinal normalization of T1-weighted and T2-weighted images, before any other postprocessing, the intensity of each original image was transformed to match the intensity values of the average template using a polynomial least trimmed squares method to fit the joined scatterplot.26
SELs were quantified using an approach that was similar to what was previously proposed17 and implemented in our laboratory.18 In detail, SELs were defined among baseline T2 hyperintense lesions of at least 10 voxels using Jim 7.0 software by linearly fitting voxel wise the percentage volume changes vs baseline calculated from the Jacobian of the nonlinear deformation field between time points.
The percentage of volume change was calculated as the differences between the Jacobian map at each time point and that at baseline, then divided by the baseline Jacobian map and multiplied by 100. This returns the percentage change over the baseline. Because the expansion between consecutive time points has been calculated from the transformations, and in particular from the Jacobian,17,18 it was not mandatory to transform the images, although we did this for purposes of inspection. A threshold ≥12.5% of annual increase was applied to the estimated slope, and connected voxels were grouped in clusters of at least 10 voxels, as previously described.17
Each baseline lesion was classified as SEL if its mask contained at least 1 cluster with a threshold of an annual expansion ≥12.5%.18 If the same T2 hyperintense lesion included 2 or more clusters, this may reflect the presence of different lesions that developed separately and then became confluent. Taking this into account, the count of total T2 hyperintense lesion at baseline was adjusted for the number of clusters in each lesion. The total volume of baseline lesions defined as SELs and the proportion of SEL number and volume among lesions at baseline were also calculated.18 We investigated the whole WM lesions that can be defined as SELs. Such an approach was different from what was previously proposed,17 which considered only the regions showing linear expansion identified using 2 different thresholds (i.e., ≥12.5% and ≥4.0%). This choice was based on the similar results of the 2 analyses published in our previous work.18
As reported in our previous study,18 the application of different thresholds of annual increase allows to identify a different absolute number of SELs, with higher numbers if lower thresholds were used. However, we applied the same threshold already used in our previous work to identify SELs (i.e., ≥12.5% of annual increase).18 Of note, this threshold was selected to be more comparable and consistent with what was originally proposed in the literature.17
Finally, to exclude any possible incorrect classification of SELs, a careful visual evaluation was performed. In addition, to assess concentricity, we explored the directional grow derived from the deformation tensor using an index of anisotropy, which was close to zero within regions of expansion, thus suggesting an almost isotropic growth. To check for constancy, we evaluated that at each time point, the error from the regression line was similar to the overall root mean square error. Of note, all the baseline lesions defined as SELs were evaluated for the possible presence of Gd enhancement. As also previously reported,18 none of the SEL was Gd enhancing at baseline and at subsequent time points.
Evaluation of SEL Microstructural Abnormalities
At each time point and for each patient, this formula was applied to calculate MTR: (M0 [nonsaturated] − MS [saturated])/M0 × 100), after halfway registration. To evaluate the microstructure inside baseline lesions grouped as SEL and non-SEL, baseline lesion masks, MTR, and intensity-normalized T1-weighted images were transformed onto the midpoint template using the rigid body transformation calculated for the longitudinal alignment previously described.27 Just a rigid transformation was applied, since the idea was to obtain MTR and T1-weighted signal intensity within the region occupied by baseline lesions and follow the behavior within the same region at year 2.
The intensity normalization of T1-weighted images was achieved by first rescaling the values to a common maximum values using the 99.9 percentile. Then, using the longitudinal data of each patient, images were intensity normalized using least trimmed squares fitting to match the histograms of each image toward the patient atlas.26 This method of fitting is considered robust to outliers.
MTR and T1 signal intensities were averaged at baseline and year 2 within SEL and non-SEL for each patient. For the same quantities, absolute longitudinal changes were calculated over the 2-year period.
Statistical Analysis
The association of baseline demographic, clinical, and MRI variables with clinical outcomes (EDSS score worsening and SPMS conversion) at 9.1-year follow-up was expressed as ORs from follow-up duration-adjusted logistic regression models. Given the high number of potentially relevant and correlated baseline variables (sex, age, disease duration and EDSS score, the number of relapses in the previous year, last therapy, treatment started at baseline and treatment change at 9.1-year follow-up, baseline NBV, baseline T2 hyperintense lesion number and volume, and baseline Gd-enhancing lesion number), we performed a principal component analysis for mixed (both continuous and categorical) variables for dimensionality reduction. The first 5 components, showing eigenvalues greater than one, according to the Kaiser rule, and capturing the 68% of the variance, were retained. These latter were included as additional covariates in follow-up duration-adjusted logistic regressions for EDSS score worsening and SPMS conversion to investigate the role of follow-up clinical and MRI variables, including number, volume, and microstructural features (MTR and T1-weighted signal intensity) of SELs and non-SELs.
The dichotomizations according to the presence of ≥1 or ≥4 SELs were also evaluated. These were arbitrary set and were selected based on previous findings from recent studies performed on susceptibility-based MRI showing that the presence of ≥114,28 or ≥410,14 iron rim lesions was rewarding cutoffs for chronic active lesions to identify patients with MS with a more severe disease course. The use of an indicator variable, accounting for the potential absence of SELs, allowed us to evaluate SEL properties including all study patients in the analyses.
We performed a follow-up duration-adjusted multivariable stepwise logistic regression (based on forward and backward penalized likelihood ratio tests) to identify independent predictors of EDSS score worsening and SPMS conversion, among all baseline and follow-up study variables. We used bootstrap to assess the stability of subsets selected. The percentages of selection of each predictor over 5,000 replicates were reported. R (v4.0.3) was used for the computations. A p value of <0.05 was considered statistically significant.
Data Availability
The corresponding author had full access to all the data in the study and takes responsibility for the integrity of the data and the accuracy of the data analysis. The anonymized data set used and analyzed during the current study is available from the corresponding author on reasonable request.
Results
Demographic, Clinical, and Conventional MRI Findings
Table 1 shows the main demographic, clinical, and conventional MRI findings of the patients with RRMS included in the study at baseline and at 2-year follow-up, as previously described.18 At 9.1-year follow-up, the patients with MS of our cohort had a mean age of 45.4 years (SD = 9.9), a mean disease duration of 18.4 years (SD = 6.9), and a median EDSS score of 2.0 (IQR = 1.0; 4.0). From baseline, the mean number of relapses was 0.63 (SD = 0.93), 20/52 (38%) patients with MS showed EDSS score worsening, 7/52 (13%) had confirmed EDSS score improvement, 13/52 (25%) converted to SPMS, and 20/52 (38%) changed treatment (Table 1).
Associations With EDSS Score Worsening
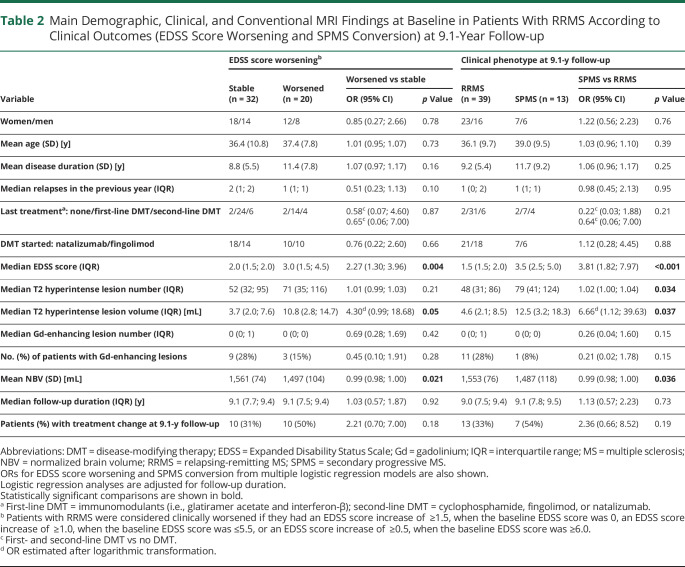
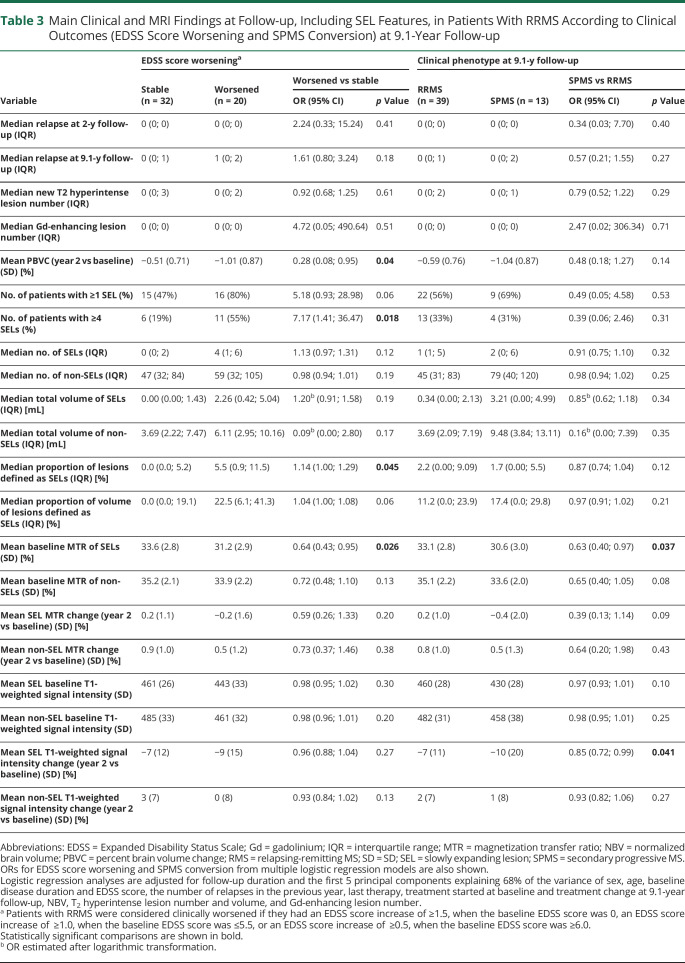
Among the baseline variables, a higher EDSS score (OR = 2.27, 95% CI = 1.30; 3.96, p = 0.004) and T2 hyperintense lesion volume (OR = 4.30 [95% CI = 0.99; 18.68], p = 0.005) and lower NBV (OR = 0.99 [95% CI = 0.98; 1.00], p = 0.021) were significantly associated with EDSS score worsening at 9.1-year follow-up (Table 2). Among the clinical and conventional MRI findings at year 2, only a higher PBVC between year 2 and baseline (OR = 0.28 [95% CI = 0.008; 0.95], p = 0.04) was significantly associated with EDSS score worsening (Table 3). The median numbers (IQR) of SELs were 0 (0; 2) and 4 (1; 6) in patients with MS with stable or worsened EDSS, whereas the median total volumes (IQR) of SELs were 0.00 mL (0.00; 1.43) and 2.26 mL (0.42; 5.04), respectively (Table 3).
Table 2.
Main Demographic, Clinical, and Conventional MRI Findings at Baseline in Patients With RRMS According to Clinical Outcomes (EDSS Score Worsening and SPMS Conversion) at 9.1-Year Follow-up
Table 3.
Main Clinical and MRI Findings at Follow-up, Including SEL Features, in Patients With RRMS According to Clinical Outcomes (EDSS Score Worsening and SPMS Conversion) at 9.1-Year Follow-up
Considering SEL features, EDSS score worsening at 9.1-year follow-up was significantly associated with the presence of ≥4 SELs (OR = 7.17 [95% CI = 1.41; 36.47], p = 0.018), a higher proportion of lesions defined as SELs (OR = 1.14 [95% CI = 1.00; 1.29], p = 0.045), and a lower baseline MTR of SELs (OR = 0.64 [95% CI = 0.43; 0.95], p = 0.026) (Table 3). Total number and volume of SELs and non-SELs, baseline MTR of non-SELs, baseline T1 signal intensities of both SELs and non-SELs, and absolute longitudinal MTR and T1 signal intensity changes both in SELs and non-SELs were not significantly associated with EDSS score worsening (p ≥ 0.06) (Table 3).
Associations With SPMS Conversion
Among the baseline variables, a higher EDSS score (OR = 3.81 [95% CI = 1.82; 7.97], p < 0.001), T2 hyperintense lesion number (OR = 1.02 [95% CI = 1.00; 1.04], p = 0.034) and volume (OR = 6.66 [95% CI = 1.12; 39.63], p = 0.037), and lower NBV (OR = 0.99 [95% CI = 0.98; 1.00], p = 0.036) were significantly associated with SPMS conversion at 9.1-year follow-up (Table 2). None of the clinical and conventional MRI variables at year 2 was significantly associated with SPMS conversion (p ≥ 0.14) (Table 3).
The median numbers (IQR) of SELs were 1 (1; 5) and 2 (0; 6) in patients with MS remaining RRMS or converting to SPMS, whereas the median total volumes (IQR) of SELs were 0.34 mL (0.00; 2.13) and 3.21 mL (0.00; 4.99), respectively (Table 3). Considering SEL features, SPMS conversion at 9.1-year follow-up was significantly associated only with a lower baseline MTR of SELs (OR = 0.63 [95% CI = 0.40; 0.97], p = 0.037) and a higher T1 signal intensity decline in SELs at year 2 compared with baseline (OR = 0.85 [95% CI = 0.72; 0.99], p = 0.041).
Multivariate Associations With Clinical Outcomes
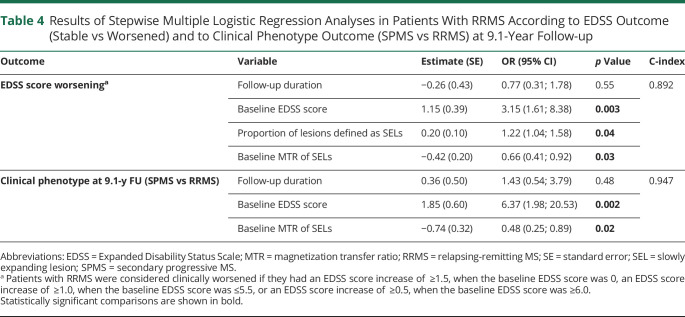
A higher baseline EDSS score (OR = 3.15 [95% CI = 1.61; 8.38], p = 0.003), a higher proportion of SELs among baseline lesions (OR = 1.22 [95% CI = 1.04; 1.58], p = 0.04), and lower baseline MTR values of SELs (OR = 0.66 [95% CI = 0.41; 0.92], p = 0.033) were significant independent predictors of EDSS score worsening at follow-up (C-index = 0.892) (Table 4). A higher baseline EDSS score (OR = 6.37 [95% CI = 1.98; 20.53], p = 0.002) and lower baseline MTR values of SELs (OR = 0.48 [95% CI = 0.25; 0.89], p = 0.02) independently predicted SPMS conversion (C-index = 0.947) (Table 4).
Table 4.
Results of Stepwise Multiple Logistic Regression Analyses in Patients With RRMS According to EDSS Outcome (Stable vs Worsened) and to Clinical Phenotype Outcome (SPMS vs RRMS) at 9.1-Year Follow-up
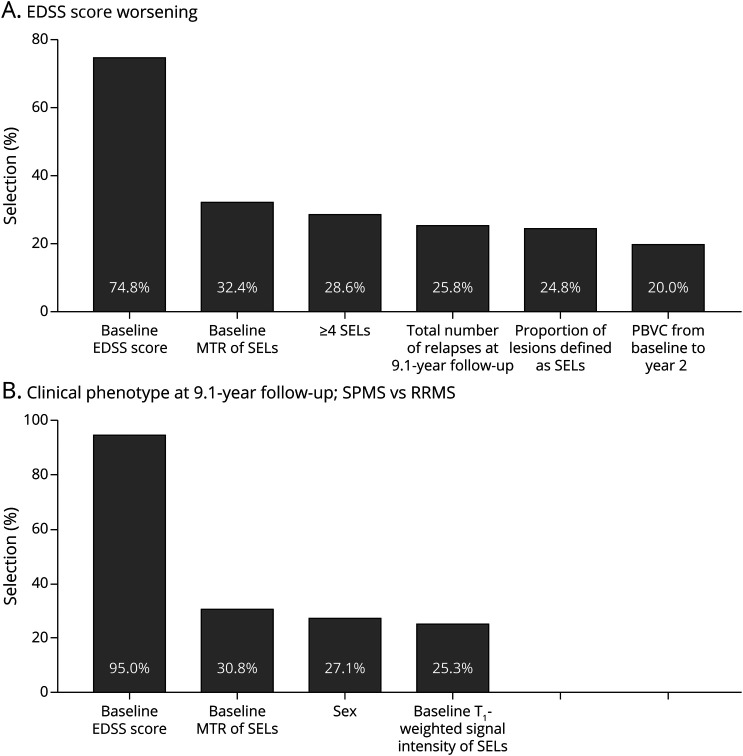
The relevance of these MRI measures in explaining EDSS score worsening and SPMS conversions was confirmed by bootstrap analyses. In particular, the percentages of selection over 5,000 replicates of predictors identified in the original data set were the high for both EDSS score worsening (≥24.8%) and SPM conversion (≥30.8%) (Figure 2).
Figure 2. Bootstrap Percentages of Predictor Selections in Explaining EDSS Score Worsening and SPMS Conversion.
Bar plots show demographic, clinical, and MRI predictors with probability of selection greater than 20% in 5,000 bootstrap replicates of follow-up duration-adjusted multivariable stepwise logistic regressions, modeling the probability of (A) EDSS score worsening and (B) clinical phenotype at 9.1-year follow-up (SPMS vs RRMS). Among all baseline and follow-up variables investigated in the study, the percentages of selection of predictors identified in the original data set were the highest. See text for further details. EDSS = Expanded Disability Status Scale; MTR = magnetization transfer ratio; PBVC = percent brain volume change; RRMS = relapsing-remitting MS; SEL = slowly expanding lesion; SPMS = secondary progressive MS.
Classification of Evidence
This study provides Class III evidence that in patients with RRMS starting treatment with natalizumab or fingolimod, the proportion of SELs on brain MRI was associated with EDSS score worsening and SPMS conversion at 9-year follow-up.
Discussion
By evaluating a cohort of RRMS after a median follow-up of 9.1 years, this study showed that beside the severity of clinical disability, T2 hyperintense lesion burden, and brain volume, the proportion of SELs and their microstructural tissue abnormalities were associated with a higher risk of 9-year EDSS score worsening and SPMS conversion. Of note, in the multivariate analysis, beside the baseline EDSS score, the proportion of SELs among WM lesions and the baseline MTR of SELs were retained as the only independent predictors of EDSS score worsening, whereas only the baseline MTR of SELs independently predicted SPMS conversion.
Accordingly, the presence of a higher proportion of SELs among WM lesions may identify patients with RRMS with a substantially higher amount of chronic compartmentalized inflammation that is likely to represent one of the most relevant pathologic processes significantly contributing to disability progression in MS.29 Of note, our results are also consistent with previous studies that identified chronic active lesions on susceptibility-based imaging and showed that the presence of iron rim lesions was associated with a more aggressive disease course,10 neurodegenerative phenomena,10,14,15,30 and EDSS score progression over a shorter follow-up.12,13
The idea to merge T1-weighted and T2-weighted sequences was related to be consistent with the methodology already applied and implemented in the original study that proposed the method in a very large data set.17 Moreover, it has been also applied in subsequent works.16,18 The similarity of the methods allows to better compare the results coming from these different studies. Moreover, T2 hyperintense WM lesions are usually larger than those detected on T1-weighted sequences, possibly due to milder peripheral T2 hyperintensity that may represent a milder degree of demyelination and axonal damage possibly consequence of more severe accumulation of damage in the core of focal lesions and not the true focal lesions. Finally, the combined T1-weighted and T2-weighted sequence allows also to enhance lesion contrast, improving the detection of small changes through the deformation fields.
Of interest, lower baseline MTR values of SELs were also associated with a higher risk of EDSS score worsening. Previous studies have suggested that compared with non-SELs or inactive lesions, SELs and chronic active lesions are more destructive, and their microstructural abnormalities, reflecting severe demyelination and axonal loss,6,15,19,20,30 may contribute to irreversible disability.11-13,16,17
Differently from previous studies,16,17 baseline and longitudinal changes of T1 signal intensities of SELs and non-SELs were not significantly associated with EDSS score worsening and SPMS conversion. Heterogeneities in patients with MS evaluated (RRMS vs PPMS), differences in MRI protocols, follow-up duration, and outcomes investigated may contribute to explain these discrepancies. Moreover, although T1 signal intensity was calculated from T1-weighted images that were rescaled and normalized using longitudinal data of each patient, a more accurate and reliable quantification of T1 signal intensity should be performed using T1 relaxation mapping that was not available in our study.
Interesting results were also found considering the predictors of SPMS conversion. A lower baseline MTR of SELs and a higher T1 signal intensity decline in SELs at year 2 compared with baseline were significantly associated with SPMS conversion, although only the former was retained as an independent predictor in the multivariate analysis.
Although the lack of significant association between the number and volume of SELs and SPMS conversion may appear counterintuitive, a recent study found a similar prevalence of iron rim lesions in patients with RRMS or SPMS (62.1% vs 62.9%).13 Moreover, another recent 7T longitudinal study that evaluated the evolution of iron rim lesions on susceptibility-based sequence over up to 7 years contributes to support our findings.11 This study showed that iron rim lesions were more frequent in RRMS compared with SPMS.11 Chronic active lesions slowly expanded mainly in the first years after their formation; they developed mainly in RRMS during the follow-up and gradually diminished over time.11 Accordingly, more limited SEL occurrence and expansion may characterize RRMS evolving toward SPMS or with longer disease duration, thus limiting their associations with SPMS conversion. Clearly, other aspects may contribute to explain the absence of association between SEL burden and SPMS conversion, including the lack of an objective definition of SPMS31 and the small number of patients with RRMS who evolved to SPMS.
The number of RRMS converting to SPMS in our study is quite limited (13/52, 25%). However, the annual rate of SPMS conversion is ∼2.8%, thus quite in line with previous epidemiologic studies reporting that around 50% of patients with RRMS convert to SPMS within 10–15 years and about 90% within 25 years, especially if left untreated.32-34 Moreover, although treatment did not significantly influence the occurrence of the 2 outcomes of the study, it is also likely that early and effective treatments, as in our cohort, may limit, at least partially, the conversion to SPMS.
Clearly, our study has some limitations. First, the small sample size and the lack of patients with RRMS being untreated or receiving other therapies did not allow us to investigate the potential effects of specific drugs. Second, SELs were identified among lesions showing a linear expansion over 2 years. However, the temporal evolution of chronic active lesions may be more heterogeneous in longer periods. Chronic active lesions slowly increase in size over time, thus are also defined as SELs. For this reason, recent works16-18,35 identified these lesions among those showing a linear and progressive longitudinal expansion over long-enough periods of time on conventional T1- and T2-weighted sequences. Accordingly, the SEL quantification methods currently applied do not take into account possible more heterogeneous temporal modifications of chronic active lesions. They may expand at different rates in different phases of lesion evolution, and lesional core may also shrink over time. Third, the MRI sequences necessary to identify SELs were acquired using the same scanner and protocol only up to 2 years after treatment start; thus, it was not possible to include any additional time point to evaluate SEL evolution at a longer follow-up. Similarly, no susceptibility-based MRI sequences were available at follow-up to identify chronic active lesions as those showing an iron rim. The absence of susceptibility-based sequence did not allow evaluating the correspondence between SELs and iron rim lesions, which has been recently found to be only partial.35
Finally, a more comprehensive clinical assessment was not available. It is likely that a composite score (e.g., MS functional composite), a neuropsychological evaluation to monitor cognitive profile, and patients' reported outcomes to explore fatigue and mood disorders could have provided relevant pieces of information regarding the association between SELs and MS progression. In conclusion, the quantification of SEL number, volume, and proportion among T2 hyperintense WM lesions using T1-weighted, T2-weighted, and MTR sequences and SEL microstructural damage using MTR sequence may identify patients with RRMS at a higher risk of disability progression and SPMS conversion after a median follow-up of 9.1 years.
Acknowledgment
P. Preziosa has been supported by a senior research fellowship FISM—Fondazione Italiana Sclerosi Multipla—cod. 2019/BS/009 and financed or cofinanced with the “5 per mille” public funding.
Glossary
- EDSS
Expanded Disability Status Scale
- IQR
interquartile range
- MTR
magnetization transfer ratio
- NBV
normalized brain volume
- PBVC
percentage brain volume change
- PP
primary progressive
- RR
relapsing-remitting
- SEL
slowly expanding lesion
- SP
secondary progressive
- WM
white matter
Appendix. Authors
Contributor Information
Paolo Preziosa, Email: preziosa.paolo@hsr.it.
Elisabetta Pagani, Email: pagani.elisabetta@hsr.it.
Alessandro Meani, Email: meani.alessandro@hsr.it.
Lucia Moiola, Email: moiola.lucia@hsr.it.
Mariaemma Rodegher, Email: rodeghermariaemma@gmail.com.
Massimo Filippi, Email: filippi.massimo@hsr.it.
Study Funding
No targeted funding reported
Disclosure
The authors declare that they have no competing interests in relation to this work. Potential conflicts of interest outside the submitted work are as follows: P. Preziosa received speaker honoraria from Biogen, Novartis, Merck Serono, Bristol-Myers Squibb, and ExceMED. E. Pagani and A. Meani have nothing to disclose. L. Moiola has received personal compensation for consulting, serving on a scientific advisory board, speaking, or other activities with Sanofi-Genzyme, Novartis, Teva, Merck Serono, Biogen, Roche, and Excemed. M. Rodegher has nothing to disclose. M. Filippi is Editor-in-Chief of the Journal of Neurology and Associate Editor of Radiology, Human Brain Mapping, and Neurological Sciences; received compensation for consulting services and/or speaking activities from Almirall, Alexion, Bayer, Biogen, Celgene, Eli Lilly, Genzyme, Merck Serono, Novartis, Roche, Sanofi, Takeda, and Teva Pharmaceutical Industries; and receives research support from Biogen Idec, Merck Serono, Novartis, Roche, Sanofi, Almirall, Eli Lilly, Teva Pharmaceutical Industries, Italian Ministry of Health, Fondazione Italiana Sclerosi Multipla, and ARiSLA (Fondazione Italiana di Ricerca per la SLA). M.A. Rocca received speaker honoraria from Bayer, Biogen, Bristol-Myers Squibb, Celgene, Genzyme, Merck Serono, Novartis, Roche, and Teva and receives research support from the MS Society of Canada and Fondazione Italiana Sclerosi Multipla. Go to Neurology.org/NN for full disclosures.
References
- 1.Filippi M, Bar-Or A, Piehl F, et al. Multiple sclerosis. Nat Rev Dis Primers 2018;4(1):43. [DOI] [PubMed] [Google Scholar]
- 2.Mahad DH, Trapp BD, Lassmann H. Pathological mechanisms in progressive multiple sclerosis. Lancet Neurol 2015;14(2):183-193. [DOI] [PubMed] [Google Scholar]
- 3.Frischer JM, Weigand SD, Guo Y, et al. Clinical and pathological insights into the dynamic nature of the white matter multiple sclerosis plaque. Ann Neurol 2015;78(5):710-721. [DOI] [PMC free article] [PubMed] [Google Scholar]
- 4.Luchetti S, Fransen NL, van Eden CG, Ramaglia V, Mason M, Huitinga I. Progressive multiple sclerosis patients show substantial lesion activity that correlates with clinical disease severity and sex: a retrospective autopsy cohort analysis. Acta Neuropathol 2018;135(4):511-528. [DOI] [PMC free article] [PubMed] [Google Scholar]
- 5.Machado-Santos J, Saji E, Troscher AR, et al. . The compartmentalized inflammatory response in the multiple sclerosis brain is composed of tissue-resident CD8+ T lymphocytes and B cells. Brain 2018;141:2066-2082. [DOI] [PMC free article] [PubMed] [Google Scholar]
- 6.Preziosa P, Rocca MA, Filippi M. Central vein sign and iron rim in multiple sclerosis: ready for clinical use?. Curr Opin Neurol 2021;34:505-513. [DOI] [PubMed] [Google Scholar]
- 7.Preziosa P, Filippi M, Rocca MA. Chronic active lesions: a new MRI biomarker to monitor treatment effect in multiple sclerosis?. Expert Rev Neurother 2021;21:837-841. [DOI] [PubMed] [Google Scholar]
- 8.Absinta M, Sati P, Schindler M, et al. Persistent 7-tesla phase rim predicts poor outcome in new multiple sclerosis patient lesions. J Clin Invest 2016;126(7):2597-2609. [DOI] [PMC free article] [PubMed] [Google Scholar]
- 9.Dal-Bianco A, Grabner G, Kronnerwetter C, et al. . Slow expansion of multiple sclerosis iron rim lesions: pathology and 7 T magnetic resonance imaging. Acta Neuropathol 2017;133:25-42. [DOI] [PMC free article] [PubMed] [Google Scholar]
- 10.Absinta M, Sati P, Masuzzo F, et al. Association of chronic active multiple sclerosis lesions with disability in vivo. JAMA Neurol 2019;76(12):1474-1483. [DOI] [PMC free article] [PubMed] [Google Scholar]
- 11.Dal-Bianco A, Grabner G, Kronnerwetter C, et al. . Long-term evolution of multiple sclerosis iron rim lesions in 7 T MRI. Brain 2021;144:833-847. [DOI] [PubMed] [Google Scholar]
- 12.Blindenbacher N, Brunner E, Asseyer S, et al. Evaluation of the “ring sign” and the “core sign” as a magnetic resonance imaging marker of disease activity and progression in clinically isolated syndrome and early multiple sclerosis. Mult Scler J Exp Transl Clin 2020;6:2055217320915480. [DOI] [PMC free article] [PubMed] [Google Scholar]
- 13.Treaba CA, Conti A, Klawiter EC, et al. . Cortical and phase rim lesions on 7 tesla MRI as markers of multiple sclerosis disease progression. Brain Commun 2021;3:fcab134. [DOI] [PMC free article] [PubMed] [Google Scholar]
- 14.Maggi P, Kuhle J, Schädelin S, et al. Chronic white matter inflammation and serum neurofilament levels in multiple sclerosis. Neurology 2021;97(6):e543-e553. [DOI] [PMC free article] [PubMed] [Google Scholar]
- 15.Kolb H, Absinta M, Beck ES, et al. 7T MRI differentiates remyelinated from demyelinated multiple sclerosis lesions. Ann Neurol 2021;90(4):612-626. [DOI] [PMC free article] [PubMed] [Google Scholar]
- 16.Elliott C, Belachew S, Wolinsky JS, et al. Chronic white matter lesion activity predicts clinical progression in primary progressive multiple sclerosis. Brain 2019;142(9):2787-2799. [DOI] [PMC free article] [PubMed] [Google Scholar]
- 17.Elliott C, Wolinsky JS, Hauser SL, et al. Slowly expanding/evolving lesions as a magnetic resonance imaging marker of chronic active multiple sclerosis lesions. Mult Scler 2019;25(14):1915-1925. [DOI] [PMC free article] [PubMed] [Google Scholar]
- 18.Preziosa P, Pagani E, Moiola L, Rodegher M, Filippi M, Rocca MA. Occurrence and microstructural features of slowly expanding lesions on fingolimod or natalizumab treatment in multiple sclerosis. Mult Scler 2021;27(10):1520-1532. [DOI] [PubMed] [Google Scholar]
- 19.van Walderveen MA, Kamphorst W, Scheltens P, et al. . Histopathologic correlate of hypointense lesions on T1-weighted spin-echo MRI in multiple sclerosis. Neurology 1998;50:1282-1288. [DOI] [PubMed] [Google Scholar]
- 20.Schmierer K, Scaravilli F, Altmann DR, Barker GJ, Miller DH. Magnetization transfer ratio and myelin in postmortem multiple sclerosis brain. Ann Neurol 2004;56(3):407-415. [DOI] [PubMed] [Google Scholar]
- 21.Kurtzke JF. Rating neurologic impairment in multiple sclerosis: an expanded disability status scale (EDSS). Neurology 1983;33(11):1444-1452. [DOI] [PubMed] [Google Scholar]
- 22.Cree BA, Cohen JA, Reder AT, et al. . Disability improvement as a clinically relevant outcome in clinical trials of relapsing forms of multiple sclerosis. Mult Scler 2021;27:2219-2231. [DOI] [PMC free article] [PubMed] [Google Scholar]
- 23.Rocca MA, Valsasina P, Meani A, et al. Network damage predicts clinical worsening in multiple sclerosis: a 6.4-year study. Neurol Neuroimmunol Neuroinflamm 2021;8(4):e1006. [DOI] [PMC free article] [PubMed] [Google Scholar]
- 24.Ashburner J, Ridgway GR. Symmetric diffeomorphic modeling of longitudinal structural MRI. Front Neurosci 2012;6:197. [DOI] [PMC free article] [PubMed] [Google Scholar]
- 25.Misaki M, Savitz J, Zotev V, et al. Contrast enhancement by combining T1- and T2-weighted structural brain MR Images. Magn Reson Med 2015;74(6):1609-1620. [DOI] [PMC free article] [PubMed] [Google Scholar]
- 26.Prima S, Ayache N, Janke A, Francis SJ, Arnold DL, Collins DL. Statistical analysis of longitudinal MRI data: applications for detection of disease activity in MS. In: Dohi T, Kikinis R, editors. Medical Image Computing and Computer-Assisted Intervention — MICCAI 2002 MICCAI 2002 Lecture Notes in Computer Science, Vol2488. Springer; 2002. [Google Scholar]
- 27.Preziosa P, Rocca MA, Riccitelli GC, et al. Effects of natalizumab and fingolimod on clinical, cognitive, and magnetic resonance imaging measures in multiple sclerosis. Neurotherapeutics 2020;17(1):208-217. [DOI] [PMC free article] [PubMed] [Google Scholar]
- 28.Maggi P, Sati P, Nair G, et al. Paramagnetic rim lesions are specific to multiple sclerosis: an international multicenter 3T MRI study. Ann Neurol 2020;88(5):1034-1042. [DOI] [PMC free article] [PubMed] [Google Scholar]
- 29.Filippi M, Preziosa P, Barkhof F, et al. Diagnosis of progressive multiple sclerosis from the imaging perspective: a review. JAMA Neurol 2021;78(3):351-364. [DOI] [PMC free article] [PubMed] [Google Scholar]
- 30.Rahmanzadeh R, Lu PJ, Barakovic M, et al. Myelin and axon pathology in multiple sclerosis assessed by myelin water and multi-shell diffusion imaging. Brain 2021;144(6):1684-1696. [DOI] [PMC free article] [PubMed] [Google Scholar]
- 31.Lorscheider J, Buzzard K, Jokubaitis V, et al. Defining secondary progressive multiple sclerosis. Brain 2016;139(pt 9):2395-2405. [DOI] [PubMed] [Google Scholar]
- 32.Weinshenker BG, Bass B, Rice GP, et al. The natural history of multiple sclerosis: a geographically based study. I. Clinical course and disability. Brain 1989;112(Pt 1):133-146. [DOI] [PubMed] [Google Scholar]
- 33.Vukusic S, Confavreux C. Prognostic factors for progression of disability in the secondary progressive phase of multiple sclerosis. J Neurol Sci 2003;206(2):135-137. [DOI] [PubMed] [Google Scholar]
- 34.Scalfari A, Neuhaus A, Daumer M, Muraro PA, Ebers GC. Onset of secondary progressive phase and long-term evolution of multiple sclerosis. J Neurol Neurosurg Psychiatry 2014;85(1):67-75. [DOI] [PubMed] [Google Scholar]
- 35.Elliott C, Belachew S, Fisher E, et al. . MRI characteristics of chronic MS lesions by phase rim detection and/or slowly expanding properties (4101). Neurology 2021;96:4101. [Google Scholar]
Associated Data
This section collects any data citations, data availability statements, or supplementary materials included in this article.
Data Availability Statement
The corresponding author had full access to all the data in the study and takes responsibility for the integrity of the data and the accuracy of the data analysis. The anonymized data set used and analyzed during the current study is available from the corresponding author on reasonable request.


