

SUMMARY
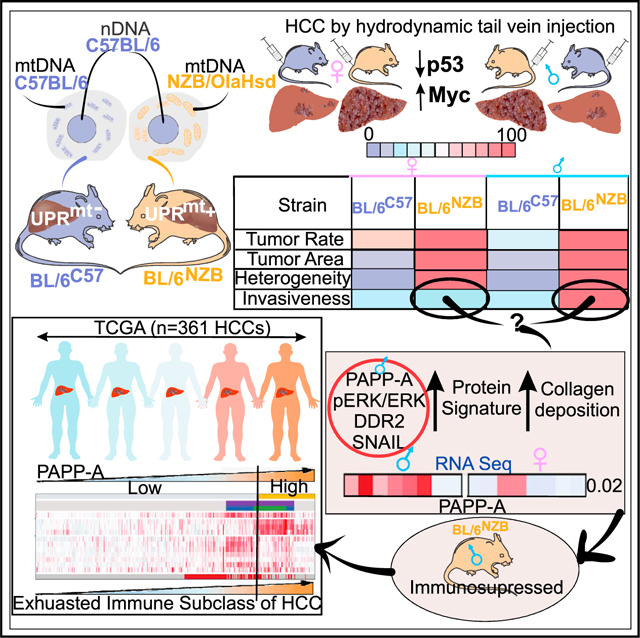
Cancer heterogeneity and evolution are not fully understood. Here, we show that mitochondrial DNA of the normal liver shapes tumor progression, histology, and immune environment prior to the acquisition of oncogenic mutation. Using conplastic mice, we show that mtDNA dictates the expression of the mitochondrial unfolded protein response (UPRmt) in the normal liver. Activation of oncogenic mutations in UPRmt-positive liver increases tumor incidence and histological heterogeneity. Further, in a subset of UPRmt-positive mice, invasive liver cancers develop. RNA sequencing (RNA-seq) analysis of the normal liver reveals that, in this subset, the PAPP-A/DDR2/SNAIL axis of invasion pre-exists along with elevated collagen. Since PAPP-A promotes immune evasion, we analyzed the immune signature and found that their livers are immunosuppressed. Further, the PAPP-A signature identifies the immune exhausted subset of hepatocellular carcinoma (HCC) in humans. Our data suggest that mtDNA of normal liver shapes the entire liver cancer portrait upon acquisition of oncogenic mutations.
In brief
Using mice that differ only in mitochondrial DNA, Chattopadhyay et al. show that mitochondrial genetics of the normal liver shapes tumor progression, histology, and immune environment prior to the acquisition of oncogenic mutation. They describe a genetic signature that characterizes the most aggressive liver cancers in both mice and humans.
Graphical Abstract
INTRODUCTION
Direct comparison of health and aging between mice that carry the same nuclear genome from the C57BL6 background but differ in mitochondrial genomes (C57BL6 or NZB background) revealed that mice carrying the NZB mitochondria DNA (BL/6NZB) are healthier and live longer (Latorre-Pellicer et al., 2016). Since the differences in mitochondria DNA between the C57BL6 and NZB mice fall within the range of divergence between Eurasian and African human haplotypes (12 missense mutations, 4 transfer RNA (tRNA) mutations, 8 ribosomal RNA (rRNA) mutations, and 10 non-coding-region mutations), this finding indicated that mitochondrial genetics has a profound impact on health and longevity.
In that study, the normal livers of BL/6C57 mice were found to show a decrease in respiration and ATP synthesis starting at 14 weeks of age, while respiration and ATP synthesis remained constant in BL/6NZB mice (Latorre-Pellicer et al., 2016). Interestingly, the BL/6NZB mice were found to have higher level of mitochondrial reactive oxygen species (ROS) at a young age (12 weeks) and increased mtDNA copy number compared with the BL/6C57 mice (Latorre-Pellicer et al., 2016). However, this trend was reversed at 30 weeks of age and the BL/6NZB mice found to maintain their ROS levels with aging while the BL/6C57 mice show a steady increase in mitochondrial ROS at 30 weeks (Latorre-Pellicer et al., 2016). This observation suggested that moderate levels of mitochondrial ROS may activate a signaling response that protects from subsequent exposure to stress, a mechanism referred to as mitohormesis. While mitohormesis has been implicated in promoting longevity in normal tissues (Yun and Finkel, 2014), a recent study indicated that, in the context of cancer, however, cells able to activate mitohormesis through a moderate level of ROS characterize a sub-population of cancer cells with increased ability to adapt to stress and elevated metastatic potential (Kenny et al., 2019a, 2019b). Therefore, the most aggressive cancer cells hijack mitohormesis, a pathway associated with longevity, to promote their own survival. Mechanistically, the ROS-positive sub-population of cancer cells was found to activate a specific axis of the mitochondrial unfolded protein response (UPRmt), a complex mitochondria-nucleus signaling cascade that maintains mitochondrial fitness by coordinately up-regulating and orchestrating mitochondrial proteostasis, biogenesis, anti-oxidant machinery, and mitophagy and attenuating mitochondrial translation (Kenny et al., 2019a, 2019b; Munch and Harper, 2016; Nargund et al., 2012, 2015; Quiros et al., 2017; Riar et al., 2017; Zhao et al., 2002).
By extrapolation, we hypothesized that the moderate level of ROS observed in the BL/6NZB mice may activate the UPRmt. Further, we hypothesized that, while this may lead to longevity in normal tissues, upon acquisition of an oncogenic mutation, these same mice may develop more aggressive cancers. We therefore initiated this study to test this hypothesis.
RESULTS
The UPRmt is activated in normal liver of BL/6NZB mice
We collected normal livers from BL/6C57 mice and BL/6NZB mice of both sexes to investigate the expression of the axes of the UPRmt. While most studies focus on the CHOP/ATF4/ATF5 axis of the UPRmt (Nargund et al., 2012, 2015; Quiros et al., 2017; Zhao et al., 2002), at least two additional axes have been reported, the SIRT3 axis (Kenny et al., 2019a, 2019b; Papa and Germain, 2014) and the ERα axis (Papa and Germain, 2011; Riar et al., 2017). Collectively, these axes regulate distinct biological outcomes, leading to increased mitochondrial fitness (Figure 1A). We selected 6 markers of each axis to monitor their activation by western blot analysis at 50 weeks of age in both the BL/6C57 and BL/6NZB mice. We found that, in the CHOP/ATF4/ATF5 axis, despite elevation of Hsp60 in female (Figures 1B and 1D) and CLPP in male (Figures 1C and 1D) BL/6NZB mice, the expression of the other markers of the axis of the UPRmt is not significantly different between either genotypes or sexes. In contrast, the expression of several markers of the SIRT3 axis of the UPRmt is significantly elevated in the BL/6NZB mice in both males and females (Figures 1E–1G). Analysis of the ERα axis also revealed activation of several markers (Figures 1H–1J), but the phosphorylation of the ERα was only observed in females (Figures 1H and 1J). Overall, these results indicate that BL/6NZB mice show a baseline activation of both the SIRT3 and ERα axes of the UPRmt, although some differences are observed between sexes. To determine the timing of activation of the UPRmt, we repeated the analysis at 12 and 25 weeks of age (Figure S1). This time course revealed no activation of any of the UPRmt axes at 12 weeks of age, with the exception of the transcription factor nuclear respiratory factor 1 (NRF1) (Figures S1A–S1F), but activation of several markers at 25 weeks, including ATF5 and LonP of the CHOP axis (Figures S1G–S1L). However, since the activation of this axis was not observed at 50 weeks, while the activation of the SIRT3 and ERα axes was sustained at 50 weeks (Figure 1), activation of mitochondrial proteostasis through the CHOP axis appears to be transient. Collectively, this analysis indicates the selective activation of the UPRmt between 25 and 50 weeks of age in BL/6NZB mice.
Figure 1. Mitochondrial DNA alters the activation of the UPRmt axes.

(A) Schematic representation of the different axes of the UPRmt.
(B and C) Western blot analysis of the indicated markers associated with the CHOP/ATF4/ATF5 axis of the UPRmt in females (B) and males (C). Western blot shows the result of four individual BL/6C57 mice or BL/6NZB mice. Quantification of each marker represents the expression of the average of the four BL/6NZB mice relative to the average value of the four BL/6C57 mice, which was adjusted to 1. Student’s t test; two-tailed; *p < 0.05; **p < 0.01; ***p < 0.001; mean ± SD; n = 4 mice/group.
(D) Venn diagram that illustrates markers of the CHOP/ATF4/ATF5 axis of the UPRmt that are either unique to one sex or common to both. Females are indicated by the pink circle and males by the blue circle.
(E and F) Western blot analysis of the indicated markers associated with the SIRT3 axis of the UPRmt in females (E) and males (F). Western blot shows the result of four individual BL/6C57 mice or BL/6NZB mice. Quantification of each marker represents the expression of the average of the four BL/6NZB mice relative to the average value of the four BL/6C57 mice, which was adjusted to 1. Student’s t test; two-tailed; *p < 0.05; **p < 0.01; ***p < 0.001; mean ± SD; n = 4 mice/group.
(G) Venn diagram that illustrates markers of the SIRT3 axis of the UPRmt that are either unique to one sex or common to both. Females are indicated by the pink circle and males by the blue circle.
(H and I) Western blot analysis of the indicated markers associated with the ERα axis of the UPRmt in females (H) and males (I). Western blot shows the result of four individual BL/6NZB mice or BL/6C57 mice. Quantification of each marker represents the expression of the average of the four BL/6NZB mice relative to the average value of the four BL/6C57 mice, which was adjusted to 1. Student’s t test; two-tailed; *p < 0.05; **p < 0.01; ***p < 0.001; mean ± SD; n = 4 mice/group.
(J) Venn diagram that illustrates markers of the ERα axis of the UPRmt that are either unique to one sex or common to both. Females are indicated by the pink circle and males by the blue circle.
See also Figure S1.
Mitochondrial DNA shapes tumor incidence, burden, and histological heterogeneity
We next aimed at interrogating the impact of mtDNA haplotypes on cancer. However, in order to maintain the precise genetic background of the BL/6C57 and BL/6NZB mice and avoid genetic crosses to other strains, we chose the hydrodynamic tail vein injection model that promotes cancer formation in the liver without the requirement for genetic crossing. Therefore, we used BL/6C57 and BL/6NZB females and males for hydrodynamic tail vein injections of two transposon-based vectors: one overexpressing the oncogene Myc and the other inhibiting the expression of the tumor suppressor p53, a protocol that has been successfully used in the past to induce the formation of liver cancer (Figure 2A; Ruiz de Galarreta et al., 2019). Further, since the efficacy of hydrodynamic injections reduces with age, and we found that the UPRmt activation is detected at 25 weeks, we chose to perform the injections at 25 weeks. Following injections, the tumors were allowed to grow for 5 weeks before harvesting the livers (Figure 2A). Tumors were compared for tumor rate, burden, and histology. We found that, in females, the rate of tumor formation in the BL/6NZB mice was 100% compared with 62.5% in the BL/6C57 mice (Figure 2B). In males, the rate of tumor formation in the BL/6NZB mice was also 100% compared with 37.5% in the BL/6C57 mice (Figure 2B), indicating that tumor frequency is higher in both male and female BL/6NZB mice. With regard to tumor burden, the area occupied by tumor was measured and found to cover more than 90% of the liver in the BL/6NZB female mice but only 10% in the BL/6C57 female mice (Figures 2C and 2D). A similar trend was observed in males between genotypes (Figures 2C and 2D), indicating that tumors in the BL/6NZB mice are not only more frequent but also significantly larger. Since difference in tumor rate and size could be due to differences in the permeability of the vasculature between the BL/6C57 and BL/6NZB mice, which would impact the delivery of the vectors to the liver, we measured the permeability of the liver vasculature using the Evans Blue Miles assay. No difference in the permeability of the liver was observed between strains (Figures S2A and S2B). The number of blood vessels was also found to be the same between genotypes (Figure S2C), therefore ruling out that the differences in tumor rate and burden are due to differences in vasculature in the liver between mice strains. To determine whether the higher tumor incidence observed in BL/6NZB mice may be due to differential expression of Myc and p53, we established cell lines from liver tumors derived from males and females of both genotypes. We found no difference in expression of Myc and p53 between genotypes (Figure S3A). We also determined whether respiration and ATP synthesis differ between genotypes in the liver cancer cells and found that, as observed in the normal livers (Latorre-Pellicer et al., 2016), basal respiration and ATP-linked respiration are both higher in the BL/6NZB mice (Figures S3B and S3C). This result is consistent with the expression of NRF1 in these mice compared with BL/6C57 mice (Figures 1H–1J). Further and importantly, increased number and tumor burden in BL/6NZB male mice compared with the BL/6C57 males were also observed in a model of carcinogen-induced fibrosarcoma to such extent that they were referred to as popcorn tumors (J.A.E., unpublished data). This result indicates that the effect is not restricted to either Myc and p53 or to the liver. We confirmed that the fibrosarcoma from the BL/6NZB males activates the UPRmt (Figure S4). Therefore, this analysis also rules out the possibility that differences observed between groups is due to difference in the rate of vectors delivery in our model. Since increase in oxidative stress and biogenesis may increase tumor formation independently of the UPRmt, we also measured reactive oxygen species (ROS) and mtDNA copy number. We found that the highest levels of ROS and mtDNA copy number were found in BL/6C57 males relative to BL/6NZB males and no differences between BL/6C57 and BL/6NZB females (Figures S5A and S5B). In addition, since Wnt signaling has been associated with mitochondrial ATP production and function (Costa et al., 2019; Miao et al., 2019; Wen et al., 2019; Zhang et al., 2018), we also tested whether change in Wnt signaling is observed between genotypes. We found no change in Wnt signaling (Figure S5C).
Figure 2. Mitochondrial genetics alters tumor heterogeneity and sexual dimorphism in liver cancer.

(A) Schematic representation of the experimental design where BL/6NZB or BL/6C57 mice with females (BL/6C57 n = 8; BL/6NZB n = 10) are indicated in the pink boxes and the males (BL/6C57 n = 8; BL/6NZB n = 8) in the blue boxes. All mice were injected by tail vein hydrodynamic injections at 25 weeks of age with lentivirus expression Myc and a CRISPR against p53. Five weeks after injections, livers were analyzed.
(B) Table of the tumor rate in BL/6C57 or BL/6NZB females or males.
(C) H&E section of representative tumors and the percentage of the liver area covered by the tumor in both BL/6C57 and BL/6NZB females and males. Scale bars represent 100 μm.
(D) Quantification of area of the liver occupied by tumors in BL/6C57 or BL/6NZB females or males.
(E) Graphs of number of tumors showing either heterogeneity (Het) or no heterogeneity (no Het) in the indicated sex and mtDNA genotype.
(F) H&E section of tumors in BL/6NZB mice showing intra-tumoral heterogeneity. Scale bars represent 100 μm.
(G) Representative transwell invasion assay filter from cancer cell line derived from the indicated sex and mtDNA genotype. Each experiment was performed in triplicate. Scale bars represent 500 μm.
(H) Representative images of organoids in 3D culture of cell lines derived from either BL/6C57 or BL/6NZB females or males and quantification of invadopodia formation by live imaging of the organoids. Scale bars represent 100 μm. Student’s t test; two-tailed; **p < 0.01; mean ± SEM, n = 17.
See also Figures S2–S5.
Next, we evaluated the histology and found a drastic difference in histological heterogeneity. Tumors in the BL/6C57 female and male mice were homogeneous and show no heterogeneity (Figure 2E). In contrast, tumors in both male and female BL/6NZB mice showed a high degree of histological heterogeneity (Figure 2E) and displayed a mixture of small cell type, trabecular, pseudoglandular, macrotrabecular solid, and massive architecture (Figure 2F).
Since we reported that the SIRT3 axis of the UPRmt is associated with more invasive cancer cells (Kenny et al., 2017, 2019b), we next tested the invasion capacity. To this end, we performed in vitro invasion assay using the cell lines derived from males and females from both genotypes. We found that, while the invasion capacity of female BL/6NZB mice is indistinguishable from the female BL/6C57 mice (Figure 2G), male BL/6NZB mice are much more invasive than male BL/6C57 mice (Figure 2G). To further compare the behavior of female and male BL/6NZB mice, cancer cells derived from each sex were grown as spheroids in 3D culture. This analysis confirmed that cancer cells derived from males of this genotype show a more invasive 3D phenotype characterized by the formation of protrusions, while the organoids derived from female cancer cells did not (Figure 2H). Therefore, these results indicate that mtDNA haplotypes shape tumor incidence, burden, and histological heterogeneity in both males and females; however, in BL/6NZB male mice, increased invasion is also observed.
Causality between the activation of the UPRmt and increased tumor incidence and invasion
To establish whether tumor incidence is associated with activation of the UPRmt, we repeated the analysis of tumor incidence in BL/6NZB males and females at 12 weeks of age (Figure 3A), since we found that the UPRmt is not activated at that age (Figures S1A–S1H). As an internal control, analysis of 30 weeks BL/6NZB males and females was also performed. We found that the tumor incidence and size in 12-week-old BL/6NZB males and females are drastically lower than in 30-week-old BL/6NZB males and females (Figures 3B and 3C) and are similar to what were observed in BL/6C57 males and females at 30 weeks of age, which also do not express the UPRmt (Figure 1). We then established cell lines from these 12-week-old mice and performed invasion assay. We found that, unlike liver cancer cells derived from BL/6NZB males at 30 weeks of age, cells derived from BL/6NZB males at 12 weeks of age are not invasive (Figure 3D). To determine whether these differences between 12 and 30 weeks are due to difference in respiration, we performed Seahorse on both liver cancer cells derived from 12- to 30-week-old BL/6NZB males and females. No differences were observed (Figures S5D and S5E), which is in agreement with the reported finding that respiration and ATP synthesis remained constant in BL/6NZB mice (Latorre-Pellicer et al., 2016).
Figure 3. Causality between expression of the UPRmt and liver cancer incidence and invasion capacity.

(A) Schematic representation of the experimental design where BL/6NZB male and female mice at 12 weeks (BL/6NZB n = 4) are indicated in the blue boxes and the BL/6NZB male and female mice at 30 weeks (BL/6NZB n = 4) are in the orange boxes. All mice were injected by tail vein hydrodynamic injections at either 7 or 25 weeks of age with vectors expressing Myc and a CRISPR against p53. Five weeks following injections, livers were analyzed.
(B) Quantification of area of the liver occupied by tumors in BL/6NZB females or males at 12 or 30 weeks.
(C) H&E section of representative tumors and the percentage of the liver area covered by the tumor in both BL/6NZB females and males at 12 or 30 weeks. Scale bars represent 100 μm.
(D) Representative transwell invasion assay filter from cancer cell line derived from the indicated sex and age. Each experiment was performed in triplicate. Scale bars represent 500 μm.
(E) Western blot analysis of liver cancer cells derived from BL/6NZB female mice where ERα was degraded by treatment with 3 μM fulvestrant for 24 h.
(F) Representative filter of in vitro invasion assay of cancer cells derived from BL/6NZB female mice, treated with or without 3 μM fulvestrant. Scale bars represent 500 μm. Student’s t test; two-tailed; ****p < 0.0001; mean ± SEM. The experiment was done in triplicate, and three regions were selected from each filter.
(G) Western blot of SIRT3, total ERα, and phospho-ERα in liver cancer cells derived from BL/6C57 males or females following treatment with 10 μM G-TTP for 6 h.
(H) Representative transwell invasion assay filter from cancer cell line derived from the indicated sex with and without G-TTP treatment. Each experiment was performed in triplicate. Scale bars represent 500 μm.
(I) Western blot of SIRT3 level following treatment with SIRT3-siRNA or scramble siRNA in liver cancer cells derived from BL/6NZB males.
(J) Representative filter of in vitro invasion assay of cancer cells derived from BL/6NZB male mice, treated with scramble siRNA or SIRT3-siRNA. Scale bars represent 500 μm. The experiment was done in triplicate, and three regions were selected from each filter.
(K) Quantification of invasion capacity in the indicated cells and treatments. Student’s t test; two-tailed; ****p < 0.0001; mean ± SEM.
See also Figures S2–S5.
Therefore, this observation suggests that the activation of the UPRmt is required for the increased tumor incidence and invasion to be observed.
We then turn our attention to the observation that, despite the fact that both males and females BL/6NZB express SIRT3 (Figures 1E–1G), only the male-derived cancer cells are invasive (Figures 2G and 2H). Since one of the differences between the activation of the UPRmt between male and female BL/6NZB mice is the selective phosphorylation of the ERα in females (Figures 1H–1J) and the ERα has been associated with the better prognosis and less aggressive liver diseases in women (Kalra et al., 2008; Lee et al., 2019), we inhibited the expression of the ERα using the ERα degrader fulvestrant and tested the effect of its inhibition on invasion. We confirmed that fulvestrant promotes the degradation of the ERα (Figure 2E) and found that the invasion capacity of female-derived cancer cells is increased (Figure 2F). This result suggests that, while both male and female BL\6NZB mice express the UPRmt, the activation of the ERα, which is a transcription factor that impacts a wide number of different transcriptional programs (Farcas et al., 2021), acts to inhibit invasion capacity. This result is in agreement with the observation of a better prognosis and less aggressive liver diseases in women (Kalra et al., 2008; Lee et al., 2019).
To further determine causality between the UPRmt and invasion, we performed two experiments. First, we used G-TTP, a mitochondrial hsp90 inhibitor, to induce the UPRmt (Munch and Harper, 2016) in the non-invasive liver cancer cells derived from 30-week-old BL/6C57 males and females. We found that treatment with G-TTP induces expression of SIRT3 (Figure 3G) and promotes their invasion (Figure 3H). However, G-TTP did not lead to the phosphorylation of the ERα (Figure 3G). Second, we created cell lines derived from 30-week-old BL/6NZB males, where SIRT3 was knocked down using small interfering RNA (siRNA) and invasion assay was performed. The decrease in SIRT3 level was confirmed by western blot analysis (Figure 3I), and we found that inhibition of SIRT3 reduces the invasion capacity of these cells compared with scramble-siRNA-treated cells (Figure 3J). Collectively, these experiments indicate the activation of the SIRT3 axis of the UPRmt is required for invasion of liver cancer cells. However, phospho-ERα somehow reduces the ability of SIRT3 to promote invasion such that only when phospho-ERα is absent and SIRT3 is present, such as in BL/6NZB females + fulvestrant, BL/6C57 males or females + G-TTP, or BL/6NZB males,invasion is observed.
These experiments also revealed that, while invasion is induced by inhibiting the ERα or inducing SIRT3 by G-TTP, the extent at which these interventions induce invasion remains lower than in the BL/6NZB males (Figure 3K), suggesting that other pathways contribute to the invasion capacity of BL/6NZB male-derived liver cancer cells.
The PAPP-A/DDR2/COL1a/SNAIL pathway of metastasis is selectively up-regulated in the liver of mice that develop invasive liver cancer
To identify the additional pathway that contributes to the invasion of BL/6NZB male liver cancer cells, we used an unbiased approach and performed RNA-seq on normal livers to interrogate this dataset for pathways that are unique to BL/6NZB males. Further, to eliminate male-specific effect, we also compared RNA-seq between BL\6C57 and BL\6NZB males. We found Ewing sarcoma as the most significantly up-regulated signature in BL/6NZB males compared with BL/6C57 males (Figure 4A) but also between BL/6NZB females and BL/6NZB males (Figure 4B). A recent study identified that protease pappalysin-1 (PAPP-A) is the most highly expressed gene in a large cohort of Ewing sarcoma (Heitzeneder et al., 2019). PAPP-A is a secreted protease implicated in the proteolytic inactivation of insulin-like-growth-factor-binding proteins 4 and 5 (IGFBP-4 and −5), leading to the activation of IGF signaling and proliferation (Boldt and Conover, 2007; Hjortebjerg, 2018; Jenkins et al., 2020a; Monget and Oxvig, 2016). PAPP-A has been found to act as an oncogene in several models (Conover and Oxvig, 2018) and its proteolytic activity to be stimulated by collagen (Takabatake et al., 2016). More recently, the oncogenic role of PAPP-A expanded from its role in IGF signaling to its ability to activate the collagen receptor discoidin 2 (DDR2), leading to invasion and metastasis through a DDR2/ERK/SNAIL signaling cascade (Slocum et al., 2019). This observation raised the possibility that the increased invasion capacity of the liver cancer cells derived from BL/6NZB males may relate to the activation of a DDR2/ERK/SNAIL pathway of metastasis. To test this possibility, we monitor the expression of these proteins and found that, while they show no change in the liver cancers from BL/6C57 males or females (Figure 4C), they are significantly overexpressed in BL/6NZB males specifically, but not in BL/6NZB females (Figure 4D). However, in agreement with the identification of this pathway using RNA-seq in normal liver samples, no significant difference was observed between normal livers and liver cancers from BL/6NZB males (Figures S6A and S6B). Since PAPP-A was reported to be activated by collagen, we then compared the level of collagen in both BL/6NZB male- and female-derived liver cancers. We found that collagen is significantly higher in males than females (Figure 4E). Since DDR2 is placed upstream of this signaling cascade, we then tested whether inhibition of DDR2 alters the invasion capacity of liver cancer cells derived from the BL/6NZB mice. WRG28 is a drug able to block the binding of DDR2 to collagen (Grither and Longmore, 2018). We tested the effect of WRG28 on invasion and found that blocking the binding of DDR2 to collagen inhibits the invasive phenotype of BL/6NZB male-derived cancer cells (Figure 4F). To confirm that the invasion is due to DDR2, we then used short hairpin RNA (shRNA) to knock down DDR2 in both BL/6NZB male- and female-derived liver cancer cells and confirmed the inhibition of DDR2 expression by western blot (Figure 4G). Using an in vitro invasion assay, we found that the invasion capacity is drastically reduced upon inhibition of DDR2 in males specifically but also had limited effect in female-derived cancer cells (Figure 4H). This observation was confirmed by live imaging cell spheroids in 3D culture, where we found that, in male-derived cancer cells of the BL/6NZB mice, inhibition of DDR2 abolished the formation of invasive extensions (Figure 4I), while it had no effect in females (Figure 4I).
Figure 4. The PAPP-A/DDR2 axis of metastasis is specifically activated in males carrying mtDNA from the NZB background.

(A) Jensen disease pathway analysis from RNA-seq analysis on liver from males from the BL/6C57 or BL/6NZB genotypes. Red arrow indicates Ewing sarcoma is the most up-regulated pathway in BL/6NZB males compared with BL/6C57 males.
(B) Jensen disease pathway analysis from RNA-seq analysis on liver from BL/6NZB males and females. Red arrow indicates that Ewing sarcoma is also up-regulated in BL/6NZB males compared with BL/6NZB females.
(C) Western blot analysis of the PAPP-A/DDR2/ERK/SNAIL pathway of invasion in the BL/6C57 males and females in liver tumor samples. Quantification of each marker represents the expression of the average of the eight BL/6C57 male mice relative to the average value of the eight BL/6C57 female mice, which was adjusted to 1. Student’s t test; two-tailed; not significant; mean ± SD.
(D) Western blot analysis of the PAPP-A/DDR2/ERK/SNAIL pathway of invasion in the BL/6NZB males and females. Quantification of each marker represents the expression of the average of the eight BL/6NZB male mice relative to the average value of the eight BL/6NZB female mice, which was adjusted to 1. Student’s t test; two-tailed; *p < 0.05; **p < 0.01; ***p < 0.001; mean ± SD.
(E) Representative Masson trichrome staining of collagen (blue) in the liver of BL/6NZB female and male mice. Scale bars represent 100 μm. Student’s t test; two-tailed; **p < 0.01; mean ± SEM. n = 8 for males and n = 10 for females.
(F) Representative filter of in vitro invasion assay of cancer cells derived from BL/6NZB male and female mice, treated with DMSO (CTL) or 1 μM WRG28 for 6 h prior to starting cell invasion assay. Scale bars represent 500 μm. Student’s t test; two-tailed; ****p < 0.0001; mean ± SEM. The experiment was done in triplicates, and five regions were selected from each filter.
(G) Western blot analysis of liver cancer cells derived from BL/6NZB male or female mice where DDR2 was knocked down by shRNA.
(H) Representative filter of in vitro invasion assay of cancer cells derived from either male or female liver cancer from the BL/6NZB genotype expressing DDR2 (CTL) or where expression of DDR2 was inhibited by shRNA (DDR2 KD). Scale bars represent 500 μm. Student’s t test; two-tailed; **p < 0.01; ****p < 0.0001; mean ± SEM. The experiment was done in triplicates, and five regions were selected from each filter.
(I) Representative images of organoids from male-BL/6NZB-derived cancer cells expressing DDR2 (CTL) or where expression of DDR2 was inhibited by shRNA (DDR2 KD). Scale bars represent 100 μm. Student’s t test; two-tailed; *p < 0.05; mean ± SEM; n = 9.
See also Figure S6.
Therefore, these results indicate that the invasion capacity of the cancer liver cells arises from the pre-existing expression of the PAPP-A pathway of invasion in the normal liver. Therefore, rather than being acquired during transformation, the baseline expression of PAPP-A, DDR2, collagen, and SNAIL is a feature that oncogenic mutations can take advantage of as they sporadically arise.
The PAPP-A signature is associated with immune evasion and is strongly enriched in the immune exhausted sub-class of HCC in humans
PAPP-A was recently identified as a top gene overexpressed in Ewing sarcoma (EWS) (Heitzeneder et al., 2019). RNA-seq analysis of PAPP-A knockout clones in EWS cell lines revealed that pathways, such as interferon response, allograft rejection, and complement, are up-regulated upon inhibition of PAPP-A, while regulation of reactive oxygen species, DNA repair, and the endoplasmic reticulum (ER) unfolded protein response are down-regulated (Heitzeneder et al., 2019). Therefore, we compared the RNA-seq from the normal liver of BL\6NZB and BL\6C57 males for these pathways. Consistent with the role of PAPP-A in immune evasion reported in the EWS study, we found that, in the liver of BL\6NZB mice, where PAPP-A is overexpressed, interferon response, allograft rejection, complement, and other immune-related pathways also reported in the EWS study are down-regulated, while the same pathways that were reported to be up-regulated upon PAPP-A inhibition are down-regulated in the liver of BL\6NZB mice (Figure 5A).
Figure 5. PAPP-A gene signature is enriched in BL/6NZB males and some females.

(A) Gene Ontology and pathway analysis from RNA-seq analysis on liver from BL/6C57 or BL/6NZB male mice.
(B) Immunoproteasome activity was measured in liver derived from BL/6NZB (n = 4) and BL/6C57 (n = 4) male mice. Student’s t test; two-tailed; *p < 0.05; mean ± SEM.
(C) Western blot analysis of LMP2 and LMP7 in liver lysates from males from the BL/6C57 or BL/6NZB genotypes.
(D) Quantification of each marker represents the expression of the average of the four BL/6NZB male mice relative to the average value of the four BL/6C57 male mice, which was adjusted to 1. Student’s t test; two-tailed; **p < 0.01, ****p < 0.0001; mean ± SD.
(E) Heatmap of PAPP-A gene set enrichment scores in liver derived from four BL/6NZB and four BL/6C57 male mice. High or low enrichment scores were represented in red and blue, respectively. For comparison of the distribution of the enrichment scores between the two groups, statistical significance was measured using Mann-Whitney U test.
(F) Heatmap of PAPP-A gene set enrichment scores in liver derived from four BL/6NZB and four BL/6C57 female mice. High or low enrichment scores were represented in red and blue, respectively. For comparison of the distribution of the enrichment scores between the two groups, statistical significance was measured using Mann-Whitney U test.
(G) Heatmap of PAPP-A gene set enrichment scores in liver derived from four BL/6NZB male and four BL/6NZB female mice. High or low enrichment scores were represented in red and blue, respectively. For comparison of the distribution of the enrichment scores between the two groups, statistical significance was measured using Mann-Whitney U test.
(H) Western blot analysis of LMP2 and LMP7 in liver lysates from BL/6C57 or BL/6NZB female mice. Quantification of each marker represents the expression of the average of the four BL/6NZB female mice relative to the average value of the four BL/6C57 female mice, which was adjusted to 1. Student’s t test; two-tailed; not significant; mean ± SD.
(I) Representative filter of in vitro invasion assay of cancer cells derived from BL/6NZB male and female mice, treated with PAPP-A conditioned media for 24 h prior to starting cell invasion assay. Scale bars represent 500 μm. Student’s t test; two-tailed; *p < 0.01; mean ± SEM. The experiment was done in triplicates, and five regions were selected from each filter.
See also Figure S6.
In addition to these pathways, analysis of individual genes that were altered by inhibition of PAPP-A identified LMP2 and LMP7, two genes implicated in the immunoproteasome, to be increased upon inhibition of PAPP-A (Heitzeneder et al., 2019). The immunoproteasome plays a central role in antigen presentation by generating peptides of the correct lengths and sequences to fit in the major histocompatibility complex (MHC) class I complex pocket (Ferrington and Gregerson, 2012; Kasahara and Flajnik, 2019). We first analyzed the activity of the immunoproteasome and found that it is decreased in the liver of BL\6NZB males (Figure 5B). Consistent with the down-regulation of the immunoproteasome activity, we found that the levels of LMP2 and LMP7 are down-regulated in the livers of BL\6NZB males compared with the BL\6C57 males (Figures 5C and 5D).
To further validate the implication of the PAPP-A pathway of invasion, we created a PAPP-A signature using 4 genes, PAPP-A, DDR2, collagen 1, and SNAIL, and found that this signature is overexpressed in the BL\6NZB males compared with BL\6C57 males (Figure 5E). We then performed the same analysis to compare BL\6NZB and BL\6C57 females and, while no statistically significant difference was observed between these two groups, it revealed that one BL\6NZB female shows a strong induction of the PAPP-A signature (Figure 5F). To further monitor the level of expression of the PAPP-A signature in BL\6NZB females relative to BL\6NZB males, we then performed the same analysis between BL\6NZB males and females and confirmed that one female in this group expresses the PAPP-A signature within the range of expression in males (Figure 5G). This variability between females is in agreement with the finding that analysis of pathways identified in the EWS study between females of both genotypes revealed a trend in term of immune pathways and immunoproteasome activity (Figures S6C and S6D).
We therefore analyzed the immunoproteasome and levels of LMP2 and LMP7 in females of both genotypes. Again, we found the same trend toward down-regulation of the immunoproteasome (Figure 5H).
This result suggests that some BL\6NZB females may also express the PAPP-A signature in their normal liver and that, if such females acquire an oncogenic mutation, they would also develop invasive liver cancer. To test whether PAPP-A may be sufficient to promote invasion in liver cancer cell lines derived from a BL\6NZB female, we treated these cells with either control cell culture media or media containing PAPP-A and found that, after 48 h, invasion was significantly up-regulated in female-derived cells, while PAPP-A had no additional effect in male-derived cells, since they already express elevated levels of PAPP-A (Figure 5I).
Finally, we interrogated a The Cancer Genome Atlas (TCGA) cohort of 361 hepatocellular carcinomas to determine whether the PAPP-A signature is observed in humans. This analysis revealed a strong association between the PAPP-A signature and the exhausted immune sub-class of HCC (Figure 6). Since this sub-class is characterized by elevated collagen content and fibrosis, this observation is consistent with the elevation in collagen observed upon PAPP-A expression (Figure 4E; Takabatake et al., 2016). No difference was observed between gender in humans, further supporting the notion that, while more frequently observed in males in our model, the PAPP-A signature is also observed in some females.
Figure 6. Analysis of PAPP-A signature in human HCC TCGA dataset.

Heatmap representation of the enrichment scores for immune- and stroma-related signatures in HCC patients with high PAPPA signature (mustard color bar) compared with the remaining patients (low PAPPA) included in the TCGA cohort (n tot = 361). PAPPA signatures are significantly enriched in patients of the previously reported HCC immune class (purple color bar), particularly those belonging to the exhausted immune subtype (green color bar). In the heatmap, high and low gene set enrichment scores are represented in red and blue, respectively; the same representation is used for high and low gene expression. For comparison of the distribution of the enrichment scores between the two groups, statistical significance was measured using Mann-Whitney U test.
DISCUSSION
The BL\6NZB mice have been shown to have enhanced health and longevity compared with the BL\6C57 mice (Latorre-Pellicer et al., 2016). This phenotype was associated with large differences in gene-expression profiles. Here, we show that mtDNA dictates whether the UPRmt is activated or not in the normal livers. While we use 6 markers as a tool to monitor the activation of each axis, clearly the UPRmt engages several transcription factors, and since each transcription factor has a wide number of targets, the complexity of the UPRmt cannot be underestimated. Globally, the impact of the activation of the UPRmt is increased mitochondrial fitness, which contributes to health and resilience of normal tissues to environmental stress. In the current study, we tested the hypothesis that the same mitochondrial fitness may contribute to the formation of more aggressive tumors in the context of a cell that acquires an oncogenic mutation. Our data show that the UPRmt is activated in the normal liver of the BL\6NZB mice compared with BL\6C57 mice. Further, in agreement with our hypothesis, we found that, upon acquisition of oncogenic events, the incidence, burden, and histological heterogeneity are increased in the livers of UPRmt-activating BL\6NZB mice. Of note, the frequency of spontaneous liver cancer formation at the time of natural death between 24 and 33 months of age in the BL\6C57 mice was approximately 50%, while none were detected in the BL\6NZB mice (Latorre-Pellicer et al., 2016). Our data show that the frequency of Mycgain- and p53-loss-induced liver cancer in BL\6C57 mice is also approximately 50% (males and females combined) at 3 to 4 months of age, while it is 100% in the BL\6NZB mice (Figure 2). The observation of a higher rate of liver cancer in young BL\6NZB mice was also made using mutagen-induced liver cancer (J.A.E., unpublished data), ruling out any difference in transfection rate. Since age is an important risk factor of developing cancer (Navarrete-Reyes et al., 2016; Serrano, 2016; Soyannwo et al., 1978), these observations indicate that activation of the UPRmt protects against spontaneous liver cancer associated with the normal aging process. However, upon acquisition of an oncogenic mutation in young mice, where spontaneous tumors are not observed, expression of the UPRmt facilitates liver cancer formation. These effects were observed in both males and females. However, a difference in invasion of liver cancer cells was observed between sexes.
We presented data indicating that this difference may be the result of the ability of the ERα to somehow inhibit the invasive capacity of the SIRT3 axis in females. This result is in agreement with the well-described observation that the ERα is associated with the better prognosis in women compared with men affected by liver diseases (Koo and Leong, 2010; Lee et al., 2019; Zhao and Li, 2015).
Since inhibition of SIRT3 significantly reduced invasion of BL/6NZB male-derived liver cancer cells, these cells remained more invasive relative to either BL/6NZB females or BL/6C57 males and female-derived liver cancer cells, indicating that other pathways in addition to SIRT3 must contribute to their invasion capacity. The analysis of pathways that distinguish the normal livers from either male BL\6C57 or female BL\6NZB from male BL\6NZB led to the identification of PAPP-A-driven pathway of invasion and immune evasion. Whether a direct link exists between the expression of the PAPP-A signature and the UPRmt is unclear. However, whether or not a direct link exists, the coexpression of these pathways in the normal liver of BL6NZB mice suggests that they may synergize, since the UPRmt provides an advantage through increased mitochondrial fitness, while the PAPP-A pathway provides proliferative advantage as well as increased deposition of collagen, invasion, and immune evasion. The potential impact of mtDNA on the content of macrophages in the spleen and metastasis in the mammary gland was described (Brinker et al., 2017, 2020; Beadnell et al., 2020), but no mechanism was provided; therefore, our results support and expand these observations.
We present data indicating that blocking DDR2 inhibits invasion. Since DDR2 acts downstream of PAPP-A and PAPP-A induces immune evasion, our finding also offers a potential explanation for the observation that inhibition of DDR2 using dasatinib was found to enhance the efficacy of immunotherapy (Tu et al., 2019). Our observation is also consistent with the reports that both PAPP-A (Engelmann et al., 2015) and DDR2 (Xie et al., 2015) were identified as markers of worst prognosis in liver cancer.
In conclusion, our data indicate that combining the expression of the UPRmt and the PAPP-A/DDR2/SNAIL pathway in the normal liver creates a favorable soil for oncogenic transformation. Our findings indicate a link between mitochondrial haplotype, activation of the UPRmt, and invasion (Figures 1 and 2). Further, our findings of gender disparity in BL\6NZB mice demonstrate that not only mitochondrial genetics but also sex impact liver cancer outcome. This observation is significant since gender disparity is observed in liver cancer in humans and remains poorly understood. Importantly, our results reveal that mitochondrial genetics is a predisposition factor for the development of aggressive tumors or not, prior to acquisition of any oncogenic mutations.
Limitations of the study
The limitations of our study are that we currently do not know whether a direct link between the activation of the UPRmt and the PAPP-A signature exists. Further, considering the complexity of the transcriptional program activated by the ERa and the wide number of proteins affected by the deacetylase activity of SIRT3, how the ERa axis influences the SIRT3 axis of the UPRmt also remains unknown. Lastly, whether the impact mitochondrial haplotype in the BL\6NZB mice versus BL\6C57 mice affects the incidence of cancer in other tissues also remains unknown but will be an important avenue of research in the future.
STAR*METHODS
RESOURCE AVAILABILITY
Lead contact
Further information and requests for resources should be directed to and will be fulfilled by the Lead Contact, Doris Germain (doris.germain@mssm.edu).
Materials availability
Cell lines generated in this study are available upon request.
Data and code availability
Single-cell RNA-seq data have been deposited at GEO and are publicly available as of the date of publication. Accession number is listed in the key resources table.
Any additional information required to reanalyze the data reported in this paper is available from the lead contact upon request.
This paper does not report original code.
KEY RESOURCES TABLE.
| REAGENT or RESOURCE | SOURCE | IDENTIFIER |
|---|---|---|
|
| ||
| Antibodies | ||
|
| ||
| Anti-SIRT3 | Abcam | Cat No.: ab86671; RRID:AB_10861832 |
| Anti-FOXO3a | Cell Signaling Technologies | 75D8; Cat No.: 2497S;RRID: AB_836876 |
| Anti-NRF1 | Abcam | Cat No.: ab55744; RRID: AB_2154534 |
| Anti-SOD2 | EMB Millipore | Cat No.: 06–984; RRID: AB_310325 |
| Anti- SOD1 | Santacruz Biotechnology | FL-154; Cat No.: sc-11407; RRID: AB_2193779 |
| Anti-LC3 | MBL International | Cat No.: PM036; RRID: AB_2274121 |
| Anti-Erα | Santacruz Biotechnology | F-10; Cat No.: sc-8002; RRID: AB_627558 |
| Anti-pERα | Millipore | Cat No.: 07–481; RRID: AB_310652 |
| Anti-Akt | Cell Signaling Technology | Cat No.: 9272S; RRID: AB_329827 |
| Anti-pAkt | Cell Signaling Technology | Cat No.: 4060S; RRID: 2315049 |
| Anti-HtrA2/OMI | BioVision | Cat No.: 3497–100; RRID: AB_2295742 |
| Anti-Hsp60 | BD Biosciences | Cat No.: 611563; RRID: AB_399009 |
| Anti-ATF5 | Abcam | Cat No.: ab184923; RRID: AB_2800462 |
| Anti-ATF4 | Proteintech | Cat No.: 60035–1-Ig; RRID: AB_2058598 |
| Anti-CLPP | Abcam | Cat No.: ab124822; RRID: AB_10975619 |
| Anti-LONP1 | Abcam | Cat No.: ab103809; RRID: AB_10858161 |
| Anti-CHOP | Cell Signaling Technologies | Cat No.: 2895S; RRID: AB_2089254 |
| Anti-PAPP-A | Santacruz Biotechnology | Cat No.: sc-50518; RRID: AB_2159335 |
| Anti-ERK | Santacruz Biotechnology | Cat No.: sc-153; RRID: AB_2141293 |
| Anti-Perk | Cell Signaling Technologies | Cat No.: 9101S; RRID: AB_331646 |
| Anti-SNAIL | Cell Signaling Technologies | L70G2; Cat No.: 3895; RRID: AB_2191759 |
| Anti-DDR2 | Abcam | Cat No.: ab126773; RRID: AB_11143387 |
| Anti-LMP2/PSMB9 | Proteintech | Cat No.:14544–1-AP; RRID:AB_2268925 |
| Anti-LMP7 | Enzo Life Sciences | Cat No.: BML-PW8845–0025; RRID:AB_2052394 |
| Anti-Axin2 | Cell Singaling Technology | D48G4; Cat No.: 5863; RRID:AB_10835211 |
| Anti-c-myc | BD Pharminger | Cat No.: 551102; RRID:AB_394046 |
| Anti-Actin | Millipore | Cat No.: MAB1501R; RRID:AB_2223041 |
| Anti-Rabbit | Kindle Biosciences | Cat No.: R1006; RRID:AB_2800464 |
| Anti-Mouse | Kindle Biosciences | Cat No.: R1005; RRID:AB_2800463 |
|
| ||
| Chemicals, peptides, and recombinant proteins | ||
|
| ||
| Formalin Solution, 10% (Histological) | Fisher Chemical | Cat No.:SF98–4 |
| Collagenase type IV | Sigma-Aldrich | Cat No.:C5138 |
| Dispase II, powder | Thermo Fisher Scientific | Cat No.:17–105–041 |
| Trypsin (1:250), powder | Thermo Fisher Scientific | Cat No.:27250018 |
| DMEM/F-12, GlutaMAX™ supplement | Thermo Fisher Scientific | Cat No.:10565042 |
| FibrOut System 2, Mouse | CHI Scientific | Cat No.:4–20503 |
| Agilent Seahorse XF DMEM media | Agilent Technologies | Cat No.:103575–100 |
| Agilent Seahorse XF 100mM pyruvate solution | Agilent Technologies | Cat No.:102578–100 |
| Agilent Seahorse XF 200mM Glutamine solution | Agilent Technologies | Cat No.:103579–100 |
| Agilent Seahorse XF 1M Glucose solution | Agilent Technologies | Cat No.:103577–100 |
| Gibco™ HBSS, no calcium, no magnesium, no phenol red | Thermo Fisher Scientific | Cat No.:1929982 |
| MitoSOX Red Mitochondrail Superoxide Indicator | Thermo Fisher Scientific | Cat No.:M36008 |
| PowerUp™ SYBR™ Green Master Mix | Applied Biosystems | Cat No.:A25742 |
| Matrigel Growth Factor Reducted (GFR) Basement Membrane Matrix | Corning Inc. | Cat No.:354230 |
| Permount (Mounting Media) | Fisher Chemicals | Cat No.:SP15–100 |
| WRG28 | ProbeChem | Cat No.:PC-35521 |
| Fulvestrant | Sigma Aldrich | Cat No.:14409 |
| Gamitrinib-triphenylphosphonium (G-TPP), 2009 | (Kang et al., 2009) | N/A |
| siRNA transfection medium | Santacruz Biotechnology | Cat No.:sc-36868 |
| siRNA transfection reagent | Santacruz Biotechnology | Cat No.:sc-29528 |
| Trypan Blue | Invitrogen | Cat No.:10282 |
| Polybrene | Santacruz Biotechnology | Cat No.:sc-134220 |
| puromycin dihydrochloride | Santacruz Biotechnology | Cat No.:sc-108071 |
| B27 Supplement 50X, minus vitamin A | Life Technologies | Cat No.: 12587–010 |
| N-acetylcysteine | Sigma-Aldrich | Cat No.: A0737 |
| Nicotinamide | Sigma-Aldrich | Cat No.: N0636 |
| [Leu15]-gastrin I human | Sigma-Aldrich | Cat No.: G9145 |
| Recombinant mouse EGF | Life Technologies | Cat No.: PMG8043 |
| Recombinant human FGF10 | Peprotech | Cat No.: 100–26 |
| Recombinant human HGF | Peprotech | Cat No.: 100–39 |
| Proteasome Substrates / Ac-Pro-Ala-Leu-AMC (Ac-PAL-AMC) | Boston Biotech | Cat No.:S-310 |
|
| ||
| Critical commercial assays | ||
|
| ||
| Epredia™ Richard-Allan Scientific™ Masson Trichrome Kit | Thermo Fisher Scientific | Cat No.:22–110-648 |
| Hema 3 Manual Staining Stat Pack | Fisher Scientific | Cat No.:23–123-869 |
| Agient Seahorse XF cell Mito Stress Test Kit | Agilent Technologies | Cat No.:103015–100 |
| KwickQuant Western Blot Detection Kit | Kindle Biosciences | Cat No.:R1004 |
|
| ||
| Deposited data | ||
|
| ||
| Mice Liver | Gene expression Omnibus | GEO No: GSE190767 |
| Human HCC TCGA dataset | Broad GDAC Firehose https://gdac.broadinstitute.org/ | N/A |
|
| ||
| Experimental models: Cell lines | ||
|
| ||
| BL/6C57 male liver tumor cell lines | This paper | N/A |
| BL/6C57 female liver tumor cell lines | This paper | N/A |
| BL/6NZB male liver tumor cell lines | This paper | N/A |
| BL/6NZB female liver tumor cell lines | This paper | N/A |
|
| ||
| Experimental models: Organisms/strains | ||
|
| ||
| Mouse: BL/6C57 | Gift, Dr. Dr. Jose Antonio Enriquez, Centro Nacional de Investigaciones Cardiovasculares Carlos III, Spain | N/A |
| Mouse: BL/6C57 | Gift, Dr. Dr. Josei Antonio Enriquez, Centro Nacional de Investigaciones Cardiovasculares Carlos III, Spain | N/A |
|
| ||
| Oligonucleotides | ||
|
| ||
| mt-Co2 Forward 5’ CTACAAGACGCCACAT 3’ | (Latorre-Pellicer et al., 2016) | N/A |
| Mt-Co2 Reverse 5’ GAGAGGGGAGAGCAAT’ | (Latorre-Pellicer et al., 2016) | N/A |
| Sdha Forward 5’ TACTACAGCCCCAAGTCT 3’ | (Latorre-Pellicer et al., 2016) | N/A |
| Reverse 5’ TGGACCCATCTTCTATGC 3’ | (Latorre-Pellicer et al., 2016) | N/A |
|
| ||
| Recombinant DNA | ||
|
| ||
| pT3-EF1a-MYC-IRES-luciferase | Gift, Dr. Amaia Lujambio, Icahn School of Medicine at Mount Sinai,USA | Addgene, Plasmid #129775 |
| px330-sg-p53 (sg-p53) | Gift, Dr. Amaia Lujambio, Icahn School of Medicine at Mount Sinai, USA | N/A |
| CMV-SB13 | Gift, Dr. Amaia Lujambio, Icahn School of Medicine at Mount Sinai, USA | N/A |
| DDR2 ShRNA Lentiviral particles | Santacruz Biotechnology | Cat No.:sc-39923-V |
| SIRT3 siRNA | Santacruz Biotechnology | Cat No.:sc-61556 |
|
| ||
| Software and algorithms | ||
|
| ||
| GraphPad Prism 8 | https://www.graphpad.com/ | N/A |
| CorelDRAW 2019 | https://www.coreldraw.com/ | N/A |
| Adobe Photoshop v22.5.1 | https://www.adobe.com/ | N/A |
| GenePattern genomic analysis tool kit | http://www.broadinstitute.org/genepattern | N/A |
|
| ||
| Other | ||
|
| ||
| PureCol collagen coated 10 ml dishes | Advanced Biomatrix | Cat No.:5028 |
| Falcon Cell strainer | Thermo Fisher Scientific | Cat No.:352235 |
| Cell culture insert, transparent PET Membrane, 8 mm pore size | Corning Inc. | Cat No.:53097 |
| Nitrocellulose Blotting membrane | Amersham Protran | Cat No.:10600001 |
| 96 Well plate with #1.5 glass-like polymer coverslip bottom, tissue culture treated for better cell attachment than cover glass | Cellvis | Cat No.:P96–1.5P |
EXPERIMENTAL MODEL AND SUBJECT DETAILS
All animal experiments were performed under an IUCAC approved protocol. BL/6C57 and BL/6NZB mice were originally generated and kindly provided by Dr. José Antonio Enńquez in the C57BL/6JOlaHsd background 1. Male and female BL/6NZB and BL/6C57 mice 25 weeks of age were used for tail vein injection experiments. All mice were housed in vivariums at Mount Sinai or CNIC with ad libitium access to food and water.
METHOD DETAILS
Hydrodynamic tail vein injection
Liver tumors resembling human HCC were generated in BL/6C57 mice (8 male and 8 female) and BL/6NZB mice (8 male and 10 female) according to an earlier published protocol (Molina-Sanchez and Lujambio, 2019) by performing hydrodynamic tail vein injections of a transposon vector expressing MYC (pT3-EF1a-MYC), a vector expressing SB13 transposase (CMV-SB13), which is required to integrate the transposon-based vector into the hepatocyte genomic DNA, and a CRISPR-Cas9 vector expressing a single-guide RNA (sgRNA) targeting p53 (px330-sg-p53) in 7 weeks and 25 weeks old mice. All three vectors were kindly provided by Dr Amaia Lujambio. A sterile 0.9% NaCl solution/plasmid mix was prepared containing DNA. Each mouse was injected with 20μg of pT3-EF1a-MYC-IRES-luciferase (MYC-luc), 20 μg of px330-sg-p53 (sg-p53), and 5 μg of SB13 transposase-encoding plasmid dissolved in 0.9% NaCl solution. The injection volume is 10% of the weight of each mouse. After 5 weeks, the mice were sacrificed, and their livers were harvested. The liver samples were used for western blotting, histology and to develop tumor cell lines.
Histology and masson trichrome staining
Tissue was fixed in 10% formalin for 24 h and then processed and paraffin embedded for sectioning by the Biorepository Core Facility at Mount Sinai. Hematoxylin and eosin (H&E) or unstained paraffin embedded slides were obtained from the core facility. The slides were stained with Mason Trichrome stain using Thermo Scientific Richard-Allan Scientific Masson Trichrome stain Kit. Images were captured using a Zeiss AX10 microscope. Quantification was performed using extent (% area) and intensity (0, 1+, 2+, 3+) of collagen stain by two independent observers and was done blindly.
Cell lines from murine liver tumors
A small portion of the tumorous liver from sacrificed mice is placed in PBS or DMEM media on ice. The livers are then finely minced and digested for 30 min at 37°C with agitation in a 2.5 ml serum-free DMEM/F12 media containing 1mg/ml collagenase type IV and 2U/ml dispase II. After digestion, 5ml of PBS was added and centrifuged at 1500 rpm for 5 min. The supernatants were discarded, and tissue pellet s washed once more in 10ml PBS and centrifuged for 5 min at 1500 rpm. The supernatants were discarded, and 2.5 ml of 0.25% Trypsin was added to the pellets and incubated for 5 min at 37°C in water bath. Then 10 ml complete DMEM/F12 medium containing 10% FBS and 1 %P/S was added to quench the effect of trypsin and centrifuged for 5 min at 1500 rpm. The supernatants were discarded and the pellets dissolved in 10 ml of complete DMEM/F-12 medium and plated including the large chunks on a PureCol collagen coated 10 ml dishes. Once the plates are confluent, they were passaged and plated on normal plates. To get rid of fibroblasts the cells were treated with FibrOut System 2, Mouse.
Mitochondrial respiration
A Seahorse XF24 extracellular flux analyzer (Seahorse Biosciences, North Billerica, MA) was used to determine mitochondrial respiratory function. In each case, 30,000 cells were plated onto Seahorse plates in DMEM/F12 containing 10% FBS and 1% P/S overnight. One hour before measurement, DMEM was replaced with Agilent Seahorse XFDMEM medium containing 1mM pyruvate, 2mM glutamine and 10mM glucose, pH 7.4. The assay was performed using Seahorse XF Cell Mito Stress Test Kit. The final concentrations of inhibitors used were 1 μM oligomycin, 1 μM FCCP (used as an uncoupler), and 0.5 μM complex III inhibitor antimycin A. Each plate (along with the cartridge) was loaded into the XF analyzer, and the OCR was measured under basal conditions and after sequential addition of oligomycin, FCCP, and rotenone.
Estimation of reactive oxygen species
Cells were detached with trypsin, collected in DMEM/F12 media, and centrifuged to pellet cells. Cells were then washed in PBS and resuspended in Hank’s Balanced Salt Solution (HBSS) containing 0.5% BSA. 5 mM stock of MitoSOX Red was freshly made and appropriate volume was added to cells in 0.5% BSA HBSS to yield final staining concentration of 5 μM. Staining was performed for 30 minutes at 37°C in the dark. Cells were then pelleted by centrifugation, washed in 0.5% BSA HBSS 2 times, and resuspended in 0.5% BSA HBSS. Cells were then passed through a single cell strainer before flow cytometry or FACS. Samples were excited at 480nm and captured at wavelengths 585/15nm.
mtDNA copy number
mtDNA copy number was quantified by real-time PCR and PowerUp SBYR Green Master Mix. Total DNA was extracted from cells using standard protocols. Total DNA was used as a template and it was amplified with specific oligodeoxynucleotides for mt-Co2 (Forward 5’ CTACAAGACGCCACAT 3’, Reverse 5’ GAGAGGGGAGAGCAAT’) and Sdha (Forward 5’ TACTACAGCCCCAAGTCT 3’ and Reverse 5’ TGGACCCATCTTCTATGC 3’) as reported previously1. mtDNA copy number was calculated by using Sdha as a reference for nuclear DNA content.
Transwell invasion assays
Cells were trypsinized and collected in DMEM/F12 serum-free media and pelleted at 500 rpm for 5 minutes. Cells were resuspended in DMEM/F12 serum-free media and counted. 30,000 cells were seeded in DMEM/F12 serum-free media on 8 mm pore size cell culture inserts in 24-well plates (Corning). Prior to seeding the cells, the cell culture inserts were coated with growth factor reduced matrigel (GIBCO) diluted 1:100 in PBS which was then incubated at room temperature for 2 hours and then the matrigel was removed. Complete DMEM/F12 media with 10% FBS was used in the lower chamber and the plates were incubated for 24h or 48 h in a tissue culture incubator. At the end of incubation, invaded cells were fixed, stained using the Hema 3 Manual Staining Stat Pack according to manufacturer’s guidelines, and placed on glass slides with mounting media. Images were captured using a Zeiss AX10 microscope. The cells were treated with 1μM WRG28 or with 3μM Fulvestrant for 6 h prior to starting invasion assay. To activate SIRT3 in BL\6C57 liver cancer cells, they were treated with 10 μM gamitrinib-triphenylphosphonium (G-TPP) for 6h prior to starting invasion assay. To test the effect of PAPP-A on invasion of female derived liver cancer cells, cells were treated with PAPP-A conditioned media (10 ng/ml) for 24 h prior to starting invasion assay. PAPP-A conditioned media was obtained following our published protocol (Slocum et al., 2019).
SIRT3 siRNA transfection
Cells were seeded in antibiotic free medium in 6-well plate for 24h prior to transfection. Transfections were performed on cells using SIRT3 siRNA (m), siRNA transfection medium and siRNA transfection reagent following manufacturer recommendations. Percent of cells alive and total cell number were determined using the Countess automated cell counter and trypan blue to determine viability. Western blot analysis was performed to knocking down of SIRT3. These cells were used for cell invasion assay.
Generation of DDR2 ShRNA cell lines
DDR2 ShRNA Lentiviral particles specific for mouse were purchased from Santacruz Biotechnology (sc-39923-V). As per manufacturer’s guidelines, BL/6NZB male and female tumor cell lines were plated on 12 well plate in 1ml complete DMEM/F12 medium containing 10% FBS and 1% P/S, 24 h prior to viral infection. The cells were plated in such a way that they become 50% confluent on the day of viral infection. On the day of viral infection, the media in the wells were replaced with Polybrene (5μg/ml) containing media. 10–20 μl of lentiviral particles were added to the wells and incubated overnight. Next day the media in the wells is replaced by complete media without polybrene. Once the cells are confluent, the stable clones containing the shRNA is selected via puromycin dihydrochloride selection. Prior to lentiviral infection, a puromycin dihydrochloride kill curve was done on the cell lines. Puromycin dihydrochloride at a concentration of 4 μg/ml was able to kill all non-transfected cells within 4–5 days. A Western blot analysis on the cell pellets was done to confirm the knockdown of DDR2.
Western blotting
Male and female BL/6C57 and BL/6NZB mice were sacrificed by cervical dislocation and liver tissue was extracted. Tissues were homogenized in lysis buffer (10mM Tris-HCL pH7.4, 1 mM EDTA, 0.32 M sucrose, 2% SDS) freshly supplemented with protease and phosphatase inhibitors and 50 mM DTT, using a MagNA Lyser instrument (Roche). Pulverized flash frozen tissues or cells were lysed in cold NP-40 lysis buffer with protease inhibitors (50 mM Tris, pH 7.5, 250 mM NaCl, 5 mM EDTA, 0.5% Nonidet P-40, 50 mM NaF, 0.2 mM Na3 VO4, 1 g/ml leupeptin, 1 g/ml pepstatin, 100 g/ml phenylmethylsulfonyl fluoride), sonicated for 5 s at 20% amplitude, centrifuged at 14,000 rpm for 20 minutes at 4°C and then the supernatant was separated. Protein concentrations were assayed using the Bradford method. Equal amounts of proteins were loaded and separated by SDS-PAGE electrophoresis and then transferred to nitrocellulose membrane. After 30 min blocking, the membranes were probed with the following primary antibodies overnight at 4° C. Blots were then washed with TBST (Tris Buffered Saline with 0.1% Tween 20, pH 7.4) and probed with horseradish peroxidase conjugated anti-mouse or anti-rabbit secondary antibodies for 2 h. This was followed by 3–4 washes with TBST and the protein bands were detected using enhanced chemiluminescence (KwikQuant Western Blot detection Kit).
3D organoid culture and imaging
Single cells were embedded in droplet of growth factor reduced matrigel adhered to the bottom of a 96 well plate (Cellvis P96–1.5P) and cultured in murine tumor organoid media (basal media, 1:50 B27, 1 mM N-acetylcysteine, 10% Rspo1-conditioned media, 10 mM nicotinamide, 10 nM recombinant human [Leu15]-gastrin I, 50 ng/mL recombinant mouse EGF, 100 ng/mL recombinant human FGF10, and 50 ng/mL recombinant human HGF) (Broutier et al., 2016). with media changed every 48 hours. Cultures were allowed to establish overnight (day 0) before live imaging. Live imaging was captured with a Zeiss AxioObserver equipped with a fully enclosed incubation system to provide constant temperature at 37C with 5% CO2. The image capture interval was either 15 or 20 minutes for durations of ~24hrs. Movies were analyzed frame by frame to identify the formation of invasive protrusions from the center of each spheroid. The number of frames with invasive protusions present was used to determine the percent of total observed time with invadopodia.
Immunoproteasome activity
Immunoproteasome activity was determined as previously described (Jenkins et al., 2020b; Riar et al., 2017). Briefly, 10μg of protein lysate were incubated with an immune proteasome substrate specific for the β1i/LMP2 activity of the 20S Immunoproteasome (Ac-Pro-Ala-Leu-AMC (Ac-PAL-AMC), Boston BioChem S-310) for three hours, after which time fluorescence was measured by spectrophotometry. Three technical replicates were performed for each biological replicate.
Bioinformatic analyses
RNA-sequencing analysis of the PAPP-A and immune signature in murine liver. For mouse to human gene name conversion, Biomart (https://m.ensembl.org/info/data/biomart/index.html) was used. Signature prediction was performed using single sample Gene Set Enrichment Analysis (ssGSEA, Gene Pattern 2.0) 16642009. The resulting enrichment scores were represented as a heatmap where high and low gene set enrichment scores were represented in red and blue, respectively. The PAPPA signature included the following genes: PAPP-A, DDR2, SNAI1, and COL1A1. For comparison of the distribution of the enrichment scores between two independent groups statistical significance was measured using Mann-Whitney U test.
For analysis of PAPP-A signature in human HCC TCGA dataset, human TCGA tumor data (expression counts) were obtained from Broad GDAC Firehose (https://gdac.broadinstitute.org/). The median of the normalized expressions of PAPP-A, DDR2, SNAI1 and COL1A1 was used to calculate an expression score for each patient (n = 361 patients with HCC, TCGA dataset). The top 20% of patients with the highest expression scores were designated as PAPPA high and compared to the rest of cohort. Single-sample gene set enrichment analysis from GenePattern was performed on gene expression counts. Signature prediction of the previously described Immune class of HCC and immune-related subtypes 44 was performed using the NTP method implemented by the GenePattern genomic analysis tool kit (http://www.broadinstitute.org/genepattern) based on prediction confidence of False Discovery Rate (FDR) < .05.
QUANTIFICATION AND STATISTICAL ANALYSIS
Statistical significance was defined as a p value below 0.05. ns = not significant, *p < 0.05, **p < 0.01, ***p < 0.001, ****p < 0.0001. Data displayed as mean ± standard deviation (SD) or mean ± standard error of the mean (SEM). Statistical analyses were performed using GraphPad Prism Software 8. Statistical significance was determined using Student’s t-test with Welch’s correction.
Supplementary Material
Highlights.
Mitochondria DNA impacts the mitochondrial unfolded protein response (UPRmt)
UPRmt-positive mice develop more frequent, larger, and heterogeneous liver cancers
Liver cancer in UPRmt-positive males is invasive and expresses a PAPP-A signature
The PAPP-A signature identifies immune exhausted liver cancer in humans
ACKNOWLEDGMENTS
This work was supported by an RO1 AG059635 award from the NIH to D.G.
Footnotes
DECLARATION OF INTERESTS
The authors declare no competing interests.
SUPPLEMENTAL INFORMATION
Supplemental information can be found online at https://doi.org/10.1016/j.celrep.2021.110254.
REFERENCES
- Beadnell TC, Fain C, Vivian CJ, King JCG, Hastings R, Markiewicz MA, and Welch DR (2020). Mitochondrial genetics cooperate with nuclear genetics to selectively alter immune cell development/trafficking. Biochim. Biophys. Acta Mol. Basis Dis. 1866, 165648. [DOI] [PMC free article] [PubMed] [Google Scholar]
- Boldt HB, and Conover CA (2007). Pregnancy-associated plasma protein-A (PAPP-A): a local regulator of IGF bioavailability through cleavage of IGFBPs. Growth Horm. IGF Res. 17, 10–18. [DOI] [PubMed] [Google Scholar]
- Brinker AE, Vivian CJ, Beadnell TC, Koestler DC, Teoh ST, Lunt SY, and Welch DR (2020). Mitochondrial haplotype of the host stromal microenvironment alters metastasis in a non-cell autonomous manner. Cancer Res. 80, 1118–1129. [DOI] [PMC free article] [PubMed] [Google Scholar]
- Brinker AE, Vivian CJ, Koestler DC, Tsue TT, Jensen RA, and Welch DR (2017). Mitochondrial haplotype alters mammary cancer tumorigenicity and metastasis in an oncogenic driver-dependent manner. Cancer Res. 77, 6941–6949. [DOI] [PMC free article] [PubMed] [Google Scholar]
- Broutier L, Andersson-Rolf A, Hindley CJ, Boj SF, Clevers H, Koo BK, and Huch M (2016). Culture and establishment of self-renewing human and mouse adult liver and pancreas 3D organoids and their genetic manipulation. Nat. Protoc. 11, 1724–1743. [DOI] [PubMed] [Google Scholar]
- Conover CA, and Oxvig C (2018). PAPP-A and cancer. J. Mol. Endocrinol. 61, T1–T10. [DOI] [PubMed] [Google Scholar]
- Costa R, Peruzzo R, Bachmann M, Monta GD, Vicario M, Santinon G, Mattarei A, Moro E, Quintana-Cabrera R, Scorrano L, et al. (2019). Impaired mitochondrial ATP production downregulates Wnt signaling via ER stress induction. Cell Rep. 28, 1949–1960.e1946. [DOI] [PubMed] [Google Scholar]
- Engelmann JC, Amann T, Ott-Rotzer B, Nutzel M, Reinders Y, Reinders J, Thasler WE, Kristl T, Teufel A, Huber CG, et al. (2015). Causal modeling of cancer-stromal communication identifies PAPPA as a novel stroma-secreted factor activating NFkappaB signaling in hepatocellular carcinoma. PLoS Comput. Biol. 11, e1004293. [DOI] [PMC free article] [PubMed] [Google Scholar]
- Farcas AM, Nagarajan S, Cosulich S, and Carroll JS (2021). Genomewide estrogen receptor activity in breast cancer. Endocrinology 162, bqaa224. [DOI] [PMC free article] [PubMed] [Google Scholar]
- Ferrington DA, and Gregerson DS (2012). Immunoproteasomes: structure, function, and antigen presentation. Prog. Mol. Biol. Transl Sci. 109, 75–112. [DOI] [PMC free article] [PubMed] [Google Scholar]
- Grither WR, and Longmore GD (2018). Inhibition of tumor-microenvironment interaction and tumor invasion by small-molecule allosteric inhibitor of DDR2 extracellular domain. Proc. Natl. Acad. Sci. U S A 115, E7786–E7794. [DOI] [PMC free article] [PubMed] [Google Scholar]
- Heitzeneder S, Sotillo E, Shern JF, Sindiri S, Xu P, Jones R, Pollak M, Noer PR, Lorette J, Fazli L, et al. (2019). Pregnancy-associated plasma protein-A (PAPP-A) in ewing sarcoma: role in tumor growth and immune evasion. J. Natl. Cancer Inst. 111, 970–982. [DOI] [PMC free article] [PubMed] [Google Scholar]
- Hjortebjerg R (2018). IGFBP-4 and PAPP-A in normal physiology and disease. Growth Horm. IGF Res. 41, 7–22. [DOI] [PubMed] [Google Scholar]
- Jenkins EC, Brown SO, and Germain D (2020a). The multi-faced role of PAPP-A in post-partum breast cancer: IGF-signaling is only the beginning. J. Mammary Gland Biol. Neoplasia 25, 181–189. [DOI] [PubMed] [Google Scholar]
- Jenkins EC, Shah N, Gomez M, Casalena G, Zhao D, Kenny TC, Guariglia SR, Manfredi G, and Germain D (2020b). Proteasome mapping reveals sexual dimorphism in tissue-specific sensitivity to protein aggregations. EMBO Rep. 21, e48978. [DOI] [PMC free article] [PubMed] [Google Scholar]
- Kalra M, Mayes J, Assefa S, Kaul AK, and Kaul R (2008). Role of sex steroid receptors in pathobiology of hepatocellular carcinoma. World J. Gastroenterol. 14, 5945–5961. [DOI] [PMC free article] [PubMed] [Google Scholar]
- Kang BH, Plescia J, Song HY, Meli M, Colombo G, Beebe K, Scroggins B, Neckers L, and Altieri DC (2009). Combinatorial drug design targeting multiple cancer signaling networks controlled by mitochondrial Hsp90. J. Clin. Invest. 119, 454–464. [DOI] [PMC free article] [PubMed] [Google Scholar]
- Kasahara M, and Flajnik MF (2019). Origin and evolution of the specialized forms of proteasomes involved in antigen presentation. Immunogenetics 71, 251–261. [DOI] [PMC free article] [PubMed] [Google Scholar]
- Kenny TC, Craig AJ, Villanueva A, and Germain D (2019a). Mitohormesis primes tumor invasion and metastasis. Cell Rep. 27, 2292–2303.e2296. [DOI] [PMC free article] [PubMed] [Google Scholar]
- Kenny TC, Gomez ML, and Germain D (2019b). Mitohormesis, UPR(mt), and the complexity of mitochondrial DNA landscapes in cancer. Cancer Res. 79, 6057–6066. [DOI] [PMC free article] [PubMed] [Google Scholar]
- Kenny TC, Hart P, Ragazzi M, Sersinghe M, Chipuk J, Sagar MAK, Eliceiri KW, LaFramboise T, Grandhi S, Santos J, et al. (2017). Selected mitochondrial DNA landscapes activate the SIRT3 axis of the UPR(mt) to promote metastasis. Oncogene 36, 4393–4404. [DOI] [PMC free article] [PubMed] [Google Scholar]
- Koo JH, and Leong RW (2010). Sex differences in epidemiological, clinical and pathological characteristics of colorectal cancer. J. Gastroenterol. Hepatol. 25, 33–42. [DOI] [PubMed] [Google Scholar]
- Latorre-Pellicer A, Moreno-Loshuertos R, Lechuga-Vieco AV, Sanchez-Cabo F, Torroja C, Acin-Perez R, Calvo E, Aix E, Gonzalez-Guerra A, Logan A, et al. (2016). Mitochondrial and nuclear DNA matching shapes metabolism and healthy ageing. Nature 535, 561–565. [DOI] [PubMed] [Google Scholar]
- Lee C, Kim J, and Jung Y (2019). Potential therapeutic application of estrogen in gender disparity of nonalcoholic fatty liver disease/nonalcoholic steatohepatitis. Cells 8, 1259. [DOI] [PMC free article] [PubMed] [Google Scholar]
- Miao J, Liu J, Niu J, Zhang Y, Shen W, Luo C, Liu Y, Li C, Li H, Yang P, et al. (2019). Wnt/beta-catenin/RAS signaling mediates age-related renal fibrosis and is associated with mitochondrial dysfunction. Aging Cell 18, e13004. [DOI] [PMC free article] [PubMed] [Google Scholar]
- Molina-Sanchez P, and Lujambio A (2019). Experimental models for preclinical research in hepatocellular carcinoma. In Hepatocellular Carcinoma: Translational Precision Medicine Approaches, Hoshida Y, ed., pp. 333–358. [Google Scholar]
- Monget P, and Oxvig C (2016). PAPP-A and the IGF system. Ann. Endocrinol. (Paris). 77, 90–96. [DOI] [PubMed] [Google Scholar]
- Munch C, and Harper JW (2016). Mitochondrial unfolded protein response controls matrix pre-RNA processing and translation. Nature 534, 710–713. [DOI] [PMC free article] [PubMed] [Google Scholar]
- Nargund AM, Fiorese CJ, Pellegrino MW, Deng P, and Haynes CM (2015). Mitochondrial and nuclear accumulation of the transcription factor ATFS-1 promotes OXPHOS recovery during the UPR(mt). Mol. Cell 58, 123–133. [DOI] [PMC free article] [PubMed] [Google Scholar]
- Nargund AM, Pellegrino MW, Fiorese CJ, Baker BM, and Haynes CM (2012). Mitochondrial import efficiency of ATFS-1 regulates mitochondrial UPR activation. Science 337, 587–590. [DOI] [PMC free article] [PubMed] [Google Scholar]
- Navarrete-Reyes AP, Soto-Perez-de-Celis E, and Hurria A (2016). Cancer and aging: a complex biological association. Rev. Invest. Clin. 68, 17–24. [PubMed] [Google Scholar]
- Papa L, and Germain D (2011). Estrogen receptor mediates a distinct mitochondrial unfolded protein response. J. Cell Sci 124, 1396–1402. [DOI] [PMC free article] [PubMed] [Google Scholar]
- Papa L, and Germain D (2014). SirT3 regulates the mitochondrial unfolded protein response. Mol. Cell Biol 34, 699–710. [DOI] [PMC free article] [PubMed] [Google Scholar]
- Quiros PM, Prado MA, Zamboni N, D’Amico D, Williams RW, Finley D, Gygi SP, and Auwerx J (2017). Multi-omics analysis identifies ATF4 as a key regulator of the mitochondrial stress response in mammals. J. Cell Biol 216, 2027–2045. [DOI] [PMC free article] [PubMed] [Google Scholar]
- Riar AK, Burstein SR, Palomo GM, Arreguin A, Manfredi G, and Germain D (2017). Sex specific activation of the ERalpha axis of the mitochondrial UPR (UPRmt) in the G93A-SOD1 mouse model of familial ALS. Hum. Mol. Genet. 26, 1318–1327. [DOI] [PMC free article] [PubMed] [Google Scholar]
- Ruiz de Galarreta M, Bresnahan E, Molina-Sanchez P, Lindblad KE, Maier B, Sia D, Puigvehi M, Miguela V, Casanova-Acebes M, Dhainaut M, et al. (2019). beta-Catenin activation promotes immune escape and resistance to Anti-PD-1 therapy in hepatocellular carcinoma. Cancer Discov. 9, 1124–1141. [DOI] [PMC free article] [PubMed] [Google Scholar]
- Serrano M (2016). Unraveling the links between cancer and aging. Carcinogenesis 37, 107. [DOI] [PubMed] [Google Scholar]
- Slocum E, Craig A, Villanueva A, and Germain D (2019). Parity predisposes breasts to the oncogenic action of PAPP-A and activation of the collagen receptor DDR2. Breast Cancer Res. 21,56. [DOI] [PMC free article] [PubMed] [Google Scholar]
- Soyannwo MA, Ayeni O, and Lucas AO (1978). Studies on the prevalence of renal disease and hypertension in relation to schistosomiasis. IV. Systemic blood pressure hypertension and related features. Niger. Med. J. 8, 465–476. [PubMed] [Google Scholar]
- Takabatake Y, Oxvig C, Nagi C, Adelson K, Jaffer S, Schmidt H, Keely PJ, Eliceiri KW, Mandeli J, and Germain D (2016). Lactation opposes pappalysin-1-driven pregnancy-associated breast cancer. EMBO Mol. Med. 8, 388–406. [DOI] [PMC free article] [PubMed] [Google Scholar]
- Tu MM, Lee FYF, Jones RT, Kimball AK, Saravia E, Graziano RF, Coleman B, Menard K, Yan J, Michaud E, et al. (2019). Targeting DDR2 enhances tumor response to anti-PD-1 immunotherapy. Sci. Adv. 5, eaav2437. [DOI] [PMC free article] [PubMed] [Google Scholar]
- Wen YA, Xiong X, Scott T, Li AT, Wang C, Weiss HL, Tan L, Bradford E, Fan TWM, Chandel NS, et al. (2019). The mitochondrial retrograde signaling regulates Wnt signaling to promote tumorigenesis in colon cancer. Cell Death Differ. 26, 1955–1969. [DOI] [PMC free article] [PubMed] [Google Scholar]
- Xie B, Lin W, Ye J, Wang X, Zhang B, Xiong S, Li H, and Tan G (2015). DDR2 facilitates hepatocellular carcinoma invasion and metastasis via activating ERK signaling and stabilizing SNAIL1. J. Exp. Clin. Cancer Res. 34, 101. [DOI] [PMC free article] [PubMed] [Google Scholar]
- Yun J, and Finkel T (2014). Mitohormesis. Cell Metab. 19, 757–766. [DOI] [PMC free article] [PubMed] [Google Scholar]
- Zhang Q, Wu X, Chen P, Liu L, Xin N, Tian Y, and Dillin A (2018). The mitochondrial unfolded protein response is mediated cell-non-autonomously by retromer-dependent Wnt signaling. Cell 174, 870–883.e17. [DOI] [PMC free article] [PubMed] [Google Scholar]
- Zhao Q, Wang J, Levichkin IV, Stasinopoulos S, Ryan MT, and Hoogenraad NJ (2002). A mitochondrial specific stress response in mammalian cells. EMBO J. 21, 4411–4419. [DOI] [PMC free article] [PubMed] [Google Scholar]
- Zhao Y, and Li Z (2015). Interplay of estrogen receptors and FOXA factors in the liver cancer. Mol. Cell Endocrinol. 418, 334–339. [DOI] [PMC free article] [PubMed] [Google Scholar]
Associated Data
This section collects any data citations, data availability statements, or supplementary materials included in this article.
Supplementary Materials
Data Availability Statement
Single-cell RNA-seq data have been deposited at GEO and are publicly available as of the date of publication. Accession number is listed in the key resources table.
Any additional information required to reanalyze the data reported in this paper is available from the lead contact upon request.
This paper does not report original code.
KEY RESOURCES TABLE.
| REAGENT or RESOURCE | SOURCE | IDENTIFIER |
|---|---|---|
|
| ||
| Antibodies | ||
|
| ||
| Anti-SIRT3 | Abcam | Cat No.: ab86671; RRID:AB_10861832 |
| Anti-FOXO3a | Cell Signaling Technologies | 75D8; Cat No.: 2497S;RRID: AB_836876 |
| Anti-NRF1 | Abcam | Cat No.: ab55744; RRID: AB_2154534 |
| Anti-SOD2 | EMB Millipore | Cat No.: 06–984; RRID: AB_310325 |
| Anti- SOD1 | Santacruz Biotechnology | FL-154; Cat No.: sc-11407; RRID: AB_2193779 |
| Anti-LC3 | MBL International | Cat No.: PM036; RRID: AB_2274121 |
| Anti-Erα | Santacruz Biotechnology | F-10; Cat No.: sc-8002; RRID: AB_627558 |
| Anti-pERα | Millipore | Cat No.: 07–481; RRID: AB_310652 |
| Anti-Akt | Cell Signaling Technology | Cat No.: 9272S; RRID: AB_329827 |
| Anti-pAkt | Cell Signaling Technology | Cat No.: 4060S; RRID: 2315049 |
| Anti-HtrA2/OMI | BioVision | Cat No.: 3497–100; RRID: AB_2295742 |
| Anti-Hsp60 | BD Biosciences | Cat No.: 611563; RRID: AB_399009 |
| Anti-ATF5 | Abcam | Cat No.: ab184923; RRID: AB_2800462 |
| Anti-ATF4 | Proteintech | Cat No.: 60035–1-Ig; RRID: AB_2058598 |
| Anti-CLPP | Abcam | Cat No.: ab124822; RRID: AB_10975619 |
| Anti-LONP1 | Abcam | Cat No.: ab103809; RRID: AB_10858161 |
| Anti-CHOP | Cell Signaling Technologies | Cat No.: 2895S; RRID: AB_2089254 |
| Anti-PAPP-A | Santacruz Biotechnology | Cat No.: sc-50518; RRID: AB_2159335 |
| Anti-ERK | Santacruz Biotechnology | Cat No.: sc-153; RRID: AB_2141293 |
| Anti-Perk | Cell Signaling Technologies | Cat No.: 9101S; RRID: AB_331646 |
| Anti-SNAIL | Cell Signaling Technologies | L70G2; Cat No.: 3895; RRID: AB_2191759 |
| Anti-DDR2 | Abcam | Cat No.: ab126773; RRID: AB_11143387 |
| Anti-LMP2/PSMB9 | Proteintech | Cat No.:14544–1-AP; RRID:AB_2268925 |
| Anti-LMP7 | Enzo Life Sciences | Cat No.: BML-PW8845–0025; RRID:AB_2052394 |
| Anti-Axin2 | Cell Singaling Technology | D48G4; Cat No.: 5863; RRID:AB_10835211 |
| Anti-c-myc | BD Pharminger | Cat No.: 551102; RRID:AB_394046 |
| Anti-Actin | Millipore | Cat No.: MAB1501R; RRID:AB_2223041 |
| Anti-Rabbit | Kindle Biosciences | Cat No.: R1006; RRID:AB_2800464 |
| Anti-Mouse | Kindle Biosciences | Cat No.: R1005; RRID:AB_2800463 |
|
| ||
| Chemicals, peptides, and recombinant proteins | ||
|
| ||
| Formalin Solution, 10% (Histological) | Fisher Chemical | Cat No.:SF98–4 |
| Collagenase type IV | Sigma-Aldrich | Cat No.:C5138 |
| Dispase II, powder | Thermo Fisher Scientific | Cat No.:17–105–041 |
| Trypsin (1:250), powder | Thermo Fisher Scientific | Cat No.:27250018 |
| DMEM/F-12, GlutaMAX™ supplement | Thermo Fisher Scientific | Cat No.:10565042 |
| FibrOut System 2, Mouse | CHI Scientific | Cat No.:4–20503 |
| Agilent Seahorse XF DMEM media | Agilent Technologies | Cat No.:103575–100 |
| Agilent Seahorse XF 100mM pyruvate solution | Agilent Technologies | Cat No.:102578–100 |
| Agilent Seahorse XF 200mM Glutamine solution | Agilent Technologies | Cat No.:103579–100 |
| Agilent Seahorse XF 1M Glucose solution | Agilent Technologies | Cat No.:103577–100 |
| Gibco™ HBSS, no calcium, no magnesium, no phenol red | Thermo Fisher Scientific | Cat No.:1929982 |
| MitoSOX Red Mitochondrail Superoxide Indicator | Thermo Fisher Scientific | Cat No.:M36008 |
| PowerUp™ SYBR™ Green Master Mix | Applied Biosystems | Cat No.:A25742 |
| Matrigel Growth Factor Reducted (GFR) Basement Membrane Matrix | Corning Inc. | Cat No.:354230 |
| Permount (Mounting Media) | Fisher Chemicals | Cat No.:SP15–100 |
| WRG28 | ProbeChem | Cat No.:PC-35521 |
| Fulvestrant | Sigma Aldrich | Cat No.:14409 |
| Gamitrinib-triphenylphosphonium (G-TPP), 2009 | (Kang et al., 2009) | N/A |
| siRNA transfection medium | Santacruz Biotechnology | Cat No.:sc-36868 |
| siRNA transfection reagent | Santacruz Biotechnology | Cat No.:sc-29528 |
| Trypan Blue | Invitrogen | Cat No.:10282 |
| Polybrene | Santacruz Biotechnology | Cat No.:sc-134220 |
| puromycin dihydrochloride | Santacruz Biotechnology | Cat No.:sc-108071 |
| B27 Supplement 50X, minus vitamin A | Life Technologies | Cat No.: 12587–010 |
| N-acetylcysteine | Sigma-Aldrich | Cat No.: A0737 |
| Nicotinamide | Sigma-Aldrich | Cat No.: N0636 |
| [Leu15]-gastrin I human | Sigma-Aldrich | Cat No.: G9145 |
| Recombinant mouse EGF | Life Technologies | Cat No.: PMG8043 |
| Recombinant human FGF10 | Peprotech | Cat No.: 100–26 |
| Recombinant human HGF | Peprotech | Cat No.: 100–39 |
| Proteasome Substrates / Ac-Pro-Ala-Leu-AMC (Ac-PAL-AMC) | Boston Biotech | Cat No.:S-310 |
|
| ||
| Critical commercial assays | ||
|
| ||
| Epredia™ Richard-Allan Scientific™ Masson Trichrome Kit | Thermo Fisher Scientific | Cat No.:22–110-648 |
| Hema 3 Manual Staining Stat Pack | Fisher Scientific | Cat No.:23–123-869 |
| Agient Seahorse XF cell Mito Stress Test Kit | Agilent Technologies | Cat No.:103015–100 |
| KwickQuant Western Blot Detection Kit | Kindle Biosciences | Cat No.:R1004 |
|
| ||
| Deposited data | ||
|
| ||
| Mice Liver | Gene expression Omnibus | GEO No: GSE190767 |
| Human HCC TCGA dataset | Broad GDAC Firehose https://gdac.broadinstitute.org/ | N/A |
|
| ||
| Experimental models: Cell lines | ||
|
| ||
| BL/6C57 male liver tumor cell lines | This paper | N/A |
| BL/6C57 female liver tumor cell lines | This paper | N/A |
| BL/6NZB male liver tumor cell lines | This paper | N/A |
| BL/6NZB female liver tumor cell lines | This paper | N/A |
|
| ||
| Experimental models: Organisms/strains | ||
|
| ||
| Mouse: BL/6C57 | Gift, Dr. Dr. Jose Antonio Enriquez, Centro Nacional de Investigaciones Cardiovasculares Carlos III, Spain | N/A |
| Mouse: BL/6C57 | Gift, Dr. Dr. Josei Antonio Enriquez, Centro Nacional de Investigaciones Cardiovasculares Carlos III, Spain | N/A |
|
| ||
| Oligonucleotides | ||
|
| ||
| mt-Co2 Forward 5’ CTACAAGACGCCACAT 3’ | (Latorre-Pellicer et al., 2016) | N/A |
| Mt-Co2 Reverse 5’ GAGAGGGGAGAGCAAT’ | (Latorre-Pellicer et al., 2016) | N/A |
| Sdha Forward 5’ TACTACAGCCCCAAGTCT 3’ | (Latorre-Pellicer et al., 2016) | N/A |
| Reverse 5’ TGGACCCATCTTCTATGC 3’ | (Latorre-Pellicer et al., 2016) | N/A |
|
| ||
| Recombinant DNA | ||
|
| ||
| pT3-EF1a-MYC-IRES-luciferase | Gift, Dr. Amaia Lujambio, Icahn School of Medicine at Mount Sinai,USA | Addgene, Plasmid #129775 |
| px330-sg-p53 (sg-p53) | Gift, Dr. Amaia Lujambio, Icahn School of Medicine at Mount Sinai, USA | N/A |
| CMV-SB13 | Gift, Dr. Amaia Lujambio, Icahn School of Medicine at Mount Sinai, USA | N/A |
| DDR2 ShRNA Lentiviral particles | Santacruz Biotechnology | Cat No.:sc-39923-V |
| SIRT3 siRNA | Santacruz Biotechnology | Cat No.:sc-61556 |
|
| ||
| Software and algorithms | ||
|
| ||
| GraphPad Prism 8 | https://www.graphpad.com/ | N/A |
| CorelDRAW 2019 | https://www.coreldraw.com/ | N/A |
| Adobe Photoshop v22.5.1 | https://www.adobe.com/ | N/A |
| GenePattern genomic analysis tool kit | http://www.broadinstitute.org/genepattern | N/A |
|
| ||
| Other | ||
|
| ||
| PureCol collagen coated 10 ml dishes | Advanced Biomatrix | Cat No.:5028 |
| Falcon Cell strainer | Thermo Fisher Scientific | Cat No.:352235 |
| Cell culture insert, transparent PET Membrane, 8 mm pore size | Corning Inc. | Cat No.:53097 |
| Nitrocellulose Blotting membrane | Amersham Protran | Cat No.:10600001 |
| 96 Well plate with #1.5 glass-like polymer coverslip bottom, tissue culture treated for better cell attachment than cover glass | Cellvis | Cat No.:P96–1.5P |