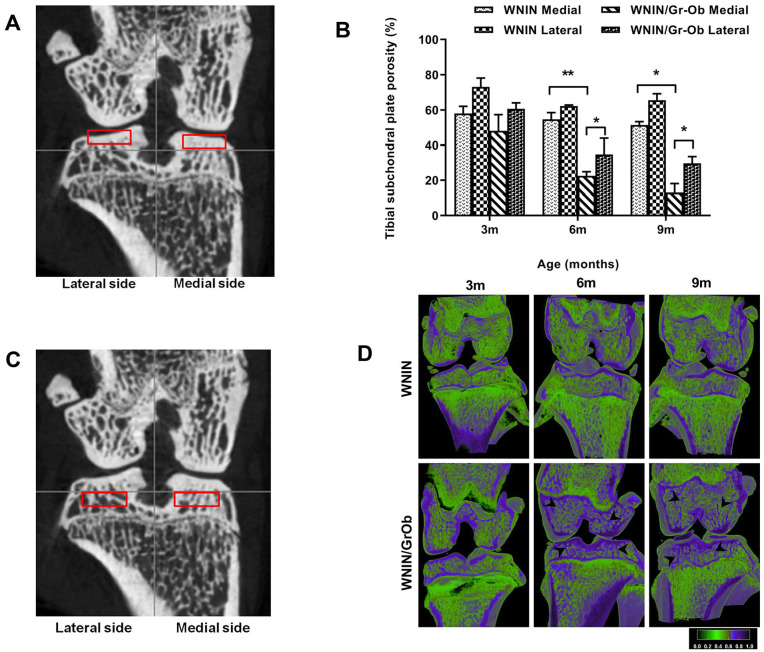
Figure 3.
Micro-computed tomography (micro-CT) analysis of tibial subchondral plate
and subchondral bone. (A) Demographic image of coronal view
of region of interest (ROI) selection of medial and lateral tibial
subchondral bone plate. (B) Quantitative analysis of
subchondral plate porosity. (C) Demographic image of
coronal view of ROI selection of medial and lateral tibial subchondral
bone. (D) Reconstructed cross-sections through the intact
knee joint (femur and tibia) showing significant reduction in bone
porosity and increased bone formation ( ) in subchondral
trabecular bone of WNIN/Gr-Ob rats compared with WNIN rats at 6 and 9
months of age. Values are expressed as mean ± SD (n =
6). *P < 0.05; **P < 0.01.
Comparisons were made against age-matched WNIN controls.

