

Abstract
Public health and health inequality have been widely researched as they are essential for human development and social justice. Although factors influencing public health and health inequality have been explored, an integrated and comprehensive analysis of social, economic, and environmental indicators’ effects on public health and health inequality globally is yet to be conducted. The current study addresses this gap by using a theoretical framework that integrates these three dimensions, examining their effects on public health and health inequality from the perspective of vulnerability. Considering the spatial heterogeneity across countries, spatial econometric models and geographically weighted regressions were conducted for the examination of these effects. Our findings reveal the social indicators of urbanisation ratio, social education level, and social governance capacity had positive effects on public health promotion and health inequality elimination globally. Besides these, environmental risk and economic capacity had relatively low impacts on health inequality. Further, the geographically weighted regression results indicate that vulnerability’s effects on public health and health inequality varied significantly across countries. This integrated analysis provides national policymakers with a new perspective of vulnerability for public health promotion and health inequality reduction.
Keywords: Public health, Health inequality, Vulnerability indicators, Spatial econometric model, Geographically weighted regression
Introduction
Public health as a primary issue of human development has been widely discussed by scholars globally (Zhang et al., 2019). It has also been proven that health is not a simple medical issue but a social topic related to social, economic, and environmental factors (Clark & Snawder, 2020). In previous literature, environmental influences on public health have been the centre of attention (Yang & Liu, 2018). According to the newest assessment of the burden of disease by the WHO (2016), 23% of global deaths occurred due to environmental risks (regarded as a negative environmental factor that harms human health). In addition, the literature also reveals that other socio-economic factors besides environmental factors influence public health. Taking the ‘watershed governance prism’ framework as an example, scholars proposed that social and ecological factors corporately determine human health (Parkes et al., 2010). However, it is still unclear how social, economic, and environmental indicators jointly affect public health globally. It also remains unknown whether environmental risk greatly impacts public health or whether other socio-economic indicators can promote public health more.
Health inequality, different from general public health, is the embodiment of social inequality within the issue of health (Kim, 2019; UNDP, 2016). With the improvement of medical level and public health welfare, people’s living standards have greatly improved, but health equity among people has not been equally promoted (Mackenbach, 2012). Reducing and eliminating social inequality within countries has also been regarded as the primary focus of the Sustainable Development Goal of the United Nations (UNDP, 2016). However, to date, health inequality problems persist, including in some highly developed countries such as the United Kingdom, Finland, and Sweden (Guldbrandsson & Bremberg, 2020). Several social factors that affect health inequality, such as economic development and capitalism, have been examined (Yang & Liu, 2018); however, these scattered studies hinder our understanding of how social, economic, and environmental indicators jointly function to affect public health and health inequality globally from a comparative and integrated perspective.
With the integration of multiple dimensions, the vulnerability perspective has been extended from disaster vulnerability to multiple fields, such as social, ecological, and economic vulnerability (Weißhuhn et al., 2018). Further, it has been suggested that public health relates to vulnerability (Mandal & Pal, 2020). As scholars demonstrate, vulnerable individuals, cities, and countries can be strongly impacted by health risks (Razavi et al., 2020). The vulnerability perspective, therefore, is an appropriate theoretical framework for regional health research. This study contributes to the literature in health field using an integrated analysis of vulnerability to determine how social, economic, and environmental indicators influence health and health inequality globally. It also provides a guide for connecting socio-economic indicators, environmental risk, and human health, identifying the positive benefits of socio-economic indicators for and the possible negative impacts of environmental risk on health and health inequality. The findings of this study provide policymakers with a new approach of vulnerability for public health improvement and health inequality reduction.
The Construction of Vulnerability Indicators Regarding Public Health and Health Inequality
The vulnerability of a region describes its propensity to be impacted by disturbances and its capacity to cope with these problems (McNeeley et al., 2017). The general composition of vulnerability includes two dimensions of sensitivity and capacity (Brooks et al., 2005). Sensitivity describes the susceptibility of an area to be affected by disturbances. This dimension is commonly considered to be composed of the socio-demographic structure and environmental risk indicators of the region (Bera et al., 2019). Capacity represents a region’s ability to adapt and eliminate various threats and is determined by various ecological, economic, and social indicators (Vommaro et al., 2020). Specifically, the ecological capacity of a region is characterised by the ecological production and service of the ecosystem (Vačkář, 2012). With respect to economic capacity, gross national income (GNI) per capita is the most important measurement of a country’s economic development. In addition, social governance capacity is regarded as the guarantee to mitigate threats and has been viewed as a component of vulnerability (Brooks et al., 2005). Beyond this, it has been found that general social education levels are correlated to public health and health inequality (Yang & Liu, 2018). In summary, the sensitivity dimension of vulnerability consists of social demographic structures and environmental risk indicators; the capacity dimension is constituted by ecological capacity, economic capacity, social governance capacity, and social educational level. The detailed vulnerability indicators selection is demonstrated in the following sections.
Sensitivity Dimension of Vulnerability in Public Health and Health Inequality
Social Demographic Structure
In general, the ageing ratio and urbanisation ratio are two vital socio-demographic structure indicators associated with public health. In terms of the ageing ratio, researchers have pointed out that health problems are much more prominent in areas with higher ageing rates (Wang et al., 2020). Researchers also say that, although the health statuses of the elderly have generally improved worldwide, they are still vulnerable to disease and death (Liou et al., 2020). Some researchers have further found that the elderly in low-income countries are at great risk of death (Gillespie et al., 2014).
The urbanisation ratio has been found to be related to public health (Wu et al., 2020). However, whether the impact of urbanisation on health and health inequality is positive or negative is controversial. On one hand, scholars supporting its negative effects believe that urbanisation mainly generates mass pollution by urban production and construction, which harm public health (Zhang et al., 2019). Furthermore, along with rapid urban expansion and infrastructure construction, the health conditions of residents are also threatened by an increase in serious dust pollution. On the other hand, compared to traditional agricultural and industrial societies, urbanisation in modern society can also have positive influences on public health (Nieuwenhuijsen, 2020). First, urbanisation can alleviate environmental pollution caused by low-energy efficiency in rural areas. Because of advanced production technology and the use of clean energy, pollution in urban cities can be controlled by effective and progressive energy consumption, which helps to reduce the impact of pollutants on human health. Second, urbanisation is accompanied by the agglomeration effect of industries. The unified energy supply and centralised waste disposal system in industrial zones reduce pollution from decentralised production, resulting in fewer health threats to residents.
Environmental Risk
Environmental risk exposure has been proven to harm human health to some extent (Liu et al., 2017). According to the WHO (2018), long-term exposure to fine particulate matter (PM) pollutants results in 7 million deaths each year worldwide, and has thus been regarded the most important environmental risk to public health. As an air pollutant, PM2.5 has been confirmed to increase mortality among people suffering from respiratory and cardiovascular diseases (Liu et al., 2017). PM2.5 is also regarded as an indicator of environmental risk in OECD statistics because of its potential and harmful effects on human health. Besides, it has been demonstrated that environmental pollution exacerbates social inequality (Li et al., 2020). Considering the negative impact of environmental risk on social development, it may also have a negative impact on health inequality. Therefore, PM2.5 is selected as the environmental risk indicator of vulnerability.
Capacity Uimension of Uulnerability in Public Health and Uealth Inequality
Ecological Capacity
Biocapacity is a valuable ecological resource that is beneficial to society (Niccolucci et al., 2012). Biocapacity measured by the Global Footprint Network is the authoritative ecological capacity indicator. For its calculation, biologically productive areas of the country are considered (Global Footprint Network, 2019). As demonstrated in the literature, ecological areas are essential for ecosystem services. Moreover, from an anthropocentric perspective, ecosystems provide a series of ecological goods and services for human health, such as air purification and fresh water supply (Parkes & Horwitz, 2009). Thus, biocapacity is selected as the ecological capacity indicator of vulnerability.
Economic Capacity
The correlation between economic development and health outcomes has been a central concern of scholars worldwide (Cole, 2019; Zhao et al., 2019). They have highlighted that economic capacity provides essential financial support for health care. Within this literature, the effects of economic capacity on public health have been examined in some countries (Yang & Liu, 2018), but how it affects public health and health inequality globally remains to be analysed. In terms of the economic capacity indicator, gross national income (GNI) per capita is considered the representative economic indicator of a country (Mia et al., 2018). GNI per capita is superior to GDP per capita because it evaluates the economic development of national citizens. According to the country classification by the World Bank, countries are divided into low, lower-middle, upper-middle, and high economies according to their GNI per capita. In addition, GNI per capita is also the primary indicator of the human development index according to the United Nations assessment. Thus, GNI per capita is used as the economic capacity indicator.
Social Education Level
Social education level is regarded as one of the vulnerability components, especially in some less developed countries (Yang & Liu, 2018). Additionally, there is evidence that countries with high education rates have more capacity to deal with potential risks than countries with low education rates (Quiroga et al., 2020). The relationship between education and health can be explained at both individual and regional levels. At the individual level, it is widely documented that highly educated people seem to be healthier than those with less education (Silles, 2009). Meanwhile, at the regional level, there is some research confirming that general regional education levels are associated with health and health inequality (De Breij et al., 2019). From the perspective of the health-education gradient, health inequality influenced by educational attainment exists universally across countries (Côté-Sergent et al., 2020). However, it is still unknown whether and how social education levels affect health and health inequality at the country level. The average years of schooling is a common indicator of education level, and the greater the years of citizens’ education, the higher the education level of the society (Chankrajang & Muttarak, 2017). Years of schooling is therefore selected as the indicator of social education level.
Social Governance Capacity
In the context of globalisation, the social governance capacity of a country has attracted the attention of scholars (Johnson, 2019). From the perspective of sustainable development, good governance has been considered the evaluation criterion of regional sustainability (Singh et al., 2009). The impact of governance on health and health inequality has also attracted attention from scholars and governments (Olafsdottir et al., 2014). Health is considered a comprehensive social issue requiring not only medical intervention but also social policy assistance (Cáceres & Mendoza, 2012; Rosenberg et al., 2019). In the case of COVID-19, good social governance helped to address the challenge of the virus’ transmission (Ortega & Orsini, 2020; Wang et al., 2020). It is obvious that good social care helps to improve public health levels, but it is unclear whether and how the general social governance level affects public health and health inequality. It can be inferred that a country’s social governance system helps to improve public health and reduce health inequality by providing good social resources and services. For indicator selection, the Worldwide Governance Index (WGI) conducted by the World Bank is the synthetic and comprehensive index reflecting the level of national governance (Ward & Dorussen, 2015). As a result, the WGI is selected as the social governance capacity indicator.
In summary, an integrated framework for vulnerability regarding public health and health inequality is constructed (Fig. 1).
Fig. 1.
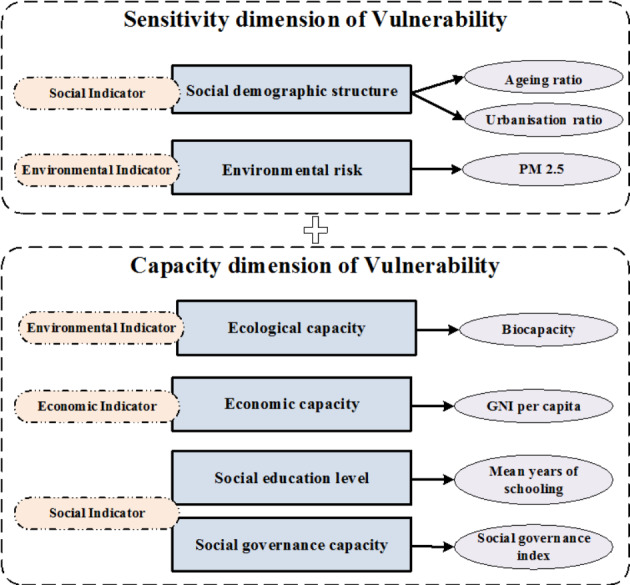
The integrated framework for vulnerability theoretical construction
Data and Methods
Data
Life expectancy at birth was selected as the public health indicator. It indicates the number of years a newborn infant would live if prevailing patterns of mortality at the time of birth were to remain constant throughout its life. This is one of the most popular health indicators with geographical variability, which is used to evaluate the regional health condition (Gillespie et al., 2014; Ivaldi et al., 2020). Life expectancy at birth is a more general indicator of health than mortality, reflecting not only mortality rates for all age groups over a period but also economic and medical technological progress accumulated in human society (Acemoglu & Johnson, 2007; Wang et al., 2019). It was also a key component in the human development index calculation by the United Nations. In terms of health inequality, this inequality index is estimated using life expectancy at birth by the Atkinson inequality method. It reflects the unequal degrees of social health distribution among the total population within a country. Both life expectancy at birth and the health inequality index were derived from the UNDP database for this study (http://hdr.undp.org/en/data).
In terms of vulnerability indicators, the environmental risk of PM2.5 for countries was obtained from the OECD statistics database (https://stats.oecd.org/). Biocapacity is the total hectares of ecologically productive lands comprising built-up land, cropland, fishing grounds, forest products, carbon, and grazing land. The newest biocapacity data in the Global Footprint Network database were for the year 2016, and thus all the data in the current study were matched to the year 2016. The social governance index was summarised by six dimension indicators (voice and accountability, political stability and absence of violence, government effectiveness, regulatory quality, rule of law, and control of corruption) and expressed in standard normal units (ranging from − 2.5 to 2.5). The original numerical values of these social governance variables were derived from the Worldwide Governance Indicators database (http://info.worldbank.org/governance/wgi/#home) were and calculated as average values. Table 1 provides a detailed description of all vulnerability indicators.
Table 1.
Description and data sources of vulnerability indicators
| Dimension | Indicator | Variable | Description | Data source | References |
|---|---|---|---|---|---|
| Sensitivity | Social demographic structure | Ageing ratio |
The proportion of people 65 years of age or older in the country . Population is based on the de facto definition of population, which counts all residents regardless of legal status or citizenship. |
World Development Indicators, World Bank database |
Liou et al., 2020; Wang et al., 2020 |
| Urbanisation ratio | The proportion of people living in urban areas defined by national statistical offices |
Wu et al., 2020; Zhang et al., 2019 |
|||
| Environmental risk | PM2.5 | The concentration of population exposure to fine particles matter (PM2.5) | Organization of Economic Corporation and Development Statistics |
Li et al., 2020; Liu et al., 2017; WHO, 2018 |
|
| Capacity | Ecological capacity | Biocapacity | The total biological capacity of six kinds of physical area by the yield factor | Global Footprint Network database |
Global Footprint Network, 2019; Parkes & Horwitz, 2009 |
| Economic capacity | GNI per capita | The gross national income per capita, in U.S. dollars calculated by the Atlas method | World Development Indicators, World Bank database | Cole, 2019; Mia et al., 2018; Zhao et al., 2019 | |
| Social education level | Mean years of schooling | The average years of schooling among the total population | United Nations Development Program database |
Chankrajang & Muttarak, 2017; Yang & Liu, 2018 |
|
| Social governance capacity | Social governance index | The general social governance level calculated by six dimensions of social governance | Worldwide Governance Indicators database |
Olafsdottir et al., 2014; Ward & Dorussen, 2015 |
Notes: All the database reference for data source are in the year 2016.
Spatial Econometric Model Analysis
A spatial econometric model analysis considers variables in space, incorporating spatial autocorrelation and spatial dependence. This kind of regression analysis has been widely employed in environmental studies, demography science and other social science fields (Fu & Li, 2020; Gilbert & Chakraborty, 2011). The basic spatial econometric models in social science studies are the spatial lag model (SLM) and the spatial error model (SEM) (Yang et al., 2017). Specifically, SLM adds a spatially lagged dependent variable to the classical econometric model, which examines the spatial endogenous effects of the dependent variable. The general form of SLM is as follows:
 |
where WY represents the spatially lagged dependent variable; ρ represents the spatial autoregressive coefficient; and µ is the error term.
Then, the SEM considers spatial autocorrelation in the error term, which is ignored in traditional non-spatial models. The SEM is presented in the following formula:
 |
where λ presents the spatial coefficient of the error term; Wε is the spatial error term; and µ is a random error term.
Geographically Weighted Regression Analysis
Different from the general global regression method, which assumes that all the coefficients of variables in the model are constant across space, the geographically weighted regression (GWR) is a spatially varying local regression applied to examine spatial heterogeneity among variables. The GWR expands traditional linear regression for which it allows coefficients of variables to vary over space (Wang et al., 2019). Compared with ordinary least squares regression, GWR calculates the local effects of variables rather than the constant global coefficients (Xie et al., 2018). The GWR examines both spatial heterogeneity and spatial non-stationarity, which has been widely applied in regional socio-economic and environmental research (Wang & Wu, 2020). The mathematical formula of the GWR can be presented as follows:
 |
where βk is calculated by the following matrix equation:
 |
In the equation, Yi and Xik are the dependent variable and independent variable, respectively; (ui, vi) represent the geographical coordinates of the ith position; p is the number of independent variables; βk is the coefficient of Xik; εi is the error term; T is the matrix transpose operation; and W is the spatial weight matrix based on distance.
Results
Spatial Distribution Characteristics of Public Health and Health Inequality
The global public health and health inequality map with the administrative boundaries of countries are presented in Fig. 2. In terms of public health, life expectancy ranged from 51.60 years in the Central African Republic to 84.30 in Hong Kong SAR, China (Table 2; Fig. 2a). For health inequality, the health inequality index ranged from 2.40% in Iceland to 42.40% in Chad (Table 2; Fig. 2b). As indicated in Fig. 2, public health and health inequality differed greatly across countries, indicating unequal health care service support and life quality globally. Compared with public health, health inequality was more differentiated globally with a standard deviation of 10.88%. In addition, countries with good public health tend to have lower levels of health inequality. For example, Iceland, with the lowest health inequality (2.40%) worldwide, had good public health with an average life expectancy of 82.6 years.
Fig. 2.

Spatial distribution of public health (2a) and health inequality (2b) globally
Table 2.
Statistical summary of all variables
| Variables | Unit | Mean | Std. Dev. | Min | Max |
|---|---|---|---|---|---|
| Ageing ratio | % | 8.484 | 6.062 | 0.987 | 26.592 |
| Urbanisation ratio | % | 60.087 | 23.962 | 12.388 | 100 |
| PM2.5 | µg/m3 | 27.884 | 19.048 | 5.768 | 99.182 |
| Biocapacity | Global hectares | 6.65 × 10⁷ | 2.11 × 10⁸ | 8636.7 | 1.80 × 10⁹ |
| GNI per capita | US dollars | 13481.73 | 17720.95 | 270 | 82,110 |
| Education level | Year | 8.539 | 3.162 | 1.500 | 14.100 |
| Social governance | Index | − 0.023 | 0. 936 | − 2.129 | 1.862 |
| Life expectancy | Year | 71.886 | 7.846 | 51.600 | 84.300 |
| Health inequality | % | 15.177 | 10.887 | 2.400 | 42.400 |
Spatial Econometric Model Results
For econometric model selection, whether spatial effects exist in the regression model needs to be identified. Moran’s I diagnostic test for error term spatial dependence was applied to verify whether the classical regression model was suitable or a spatial econometric model was more appropriate (Anselin et al., 2006). The Moran’s I in the health model was 9.800 (p < 0.001), indicating that the spatial econometric model was adaptable for variables estimation. Specific model selection was determined by the Lagrange multiplier (LM) test. The LM test results showed that the LM lag was 66.835 (p < 0.001) and robust LM lag was 22.524 (p < 0.001), indicating that the SLM was appropriate. The standardised regression results are shown in Table 3, eliminating the magnitude differences of variables. The SLM results of 145 countries were used for model analysis. As presented in Table 3, the SLM results showed that the R2 reached 0.794 and demonstrates that vulnerability variables have crucial effects on public health. Besides, the collinearity diagnostics of the variables were lower than 10, meaning there was no remarkable collinearity among these variables.
Table 3.
The results of the SLM for public health
| Variable | Coefficient | Std. Error | Z value | P value |
|---|---|---|---|---|
| Intercept | 0.050 | 0.036 | 1.383 | 0.167 |
| Ageing ratio | 0.013 | 0.036 | 0.351 | 0.725 |
| Urbanisation ratio | 0.175 | 0.052 | 3.361 | 0.001** |
| PM2.5 | 0.015 | 0.047 | 0.321 | 0.749 |
| Biocapacity | − 0.022 | 0.033 | -0.661 | 0.509 |
| GNI per capita | − 0.000 | 0.063 | -0.005 | 0.996 |
| Education level | 0.103 | 0.059 | 1.752 | 0.080* |
| Social governance | 0.378 | 0.075 | 5.009 | 0.000*** |
| W_health | 0.591 | 0.065 | 9.032 | 0.000*** |
| R-squared = 0.794, log likelihood = − 85.486, Akaike information criterion = 188.971, Schwarz criterion = 215.762 | ||||
Notes: *, **, and *** indicate significance at the 10%, 5%, and 1% levels
With respect to the vulnerability variables of the sensitivity dimension, the urbanisation ratio displayed a significantly positive influence on public health, implying a positive effect of urbanisation on public health improvement. In the dimension of capacity, social education level and social governance capacity were two significant factors that promoted public health. As illustrated in Table 3, social governance capacity was the most important variable in public health promotion. Apart from these variables, other vulnerability variables had no significant impacts on public health, suggesting that they might have non-linear effects on public health.
Similarly, for the health inequality model test, Moran’s I in error term was 5.909 (p < 0.001), suggesting that the spatial econometric model was essential. Then, the LM test results showed that the LM lag value was 33.608 (p < 0.001) with a robust LM lag value of 18.899 (p < 0.001). Therefore, the SLM was appropriate. In line with the health model, the collinearity diagnostics without remarkable collinearity was conducted. A total of 144 countries with valid values are illustrated in Table 4. The R2 of the SLM was 0.753 with a significant spatial lag for the independent variable W_health inequality in the model
Table 4.
The results of the SLM for health inequality
| Variable | Coefficient | Std. Error | Z value | P value |
|---|---|---|---|---|
| Intercept | − 0.035 | 0.041 | − 0.873 | 0.383 |
| Ageing ratio | − 0.023 | 0.040 | − 0.575 | 0.565 |
| Urbanisation ratio | − 0.144 | 0.058 | − 2.475 | 0.013** |
| PM2.5 | − 0.086 | 0.051 | − 1.676 | 0.094* |
| Biocapacity | 0.005 | 0.037 | 0.126 | 0.900 |
| GNI per capita | 0.123 | 0.071 | 1.725 | 0.084* |
| Education level | − 0.338 | 0.067 | − 5.032 | 0.000*** |
| Social governance | − 0.383 | 0.085 | − 4.506 | 0.000*** |
| W_health inequality | 0.472 | 0.079 | 6.004 | 0.000*** |
| R-squared = 0.753, log likelihood = − 99.578, Akaike information criterion = 217.156, Schwarz criterion = 243.884 | ||||
Notes: *, **, and *** indicate significance at the 10%, 5%, and 1% levels
As shown in Table 4, the urbanisation ratio and PM2.5 risk of sensitivity dimensions displayed significant influences on health inequality. In terms of urbanisation, a high level of urbanisation helped to eliminate health inequality. Along with globalisation, urbanisation has become a mainstream part of world development. As depicted in Tables 2 and 60.09% of the world population lives in cities and the ratio is likely to reach 70% over the next 15 years, according to the World Urbanization Prospects (United Nations, 2014). Regarding the capacity dimension, GNI per capita, social education level, and social governance capacity significantly affected health inequality globally. For economic capacity, it showed that a higher GNI per capita enlarged health inequality. This implies that economic capacity did not equally improve the health statuses of people in all socio-economic strata. The current study indicates that social indicators of vulnerability, both social education level and social governance capacity, were two vital factors for health inequality reduction
Geographically Weighted Regression Results
Research on health science shows that it is popular for scholars to consider the spatial heterogeneity of health-related determinants (Vallée et al., 2020). Thus, the geographically weighted regression (GWR) models were conducted to clarify the country level heterogeneity of the vulnerability effects on public health and health inequality. The GWR analysis and the mapping of the regression coefficients were conducted by MGWR and Geoda software, respectively. Since the global countries differ greatly in shape and size, an adaptive kernel function with corrected Akaike information criterion was used to adapt the degree of spatial heterogeneity (Yu, 2007).
Regarding model adaptability, the GWR model for public health (R2 = 0.890, AIC = 175.844) was a better fit than the OLS model (R2 = 0.685, AIC = 260.226), suggesting a distinct country difference of vulnerability effects on public health. The standardised geographically weighted regression results for public health are summarised in Table 5 and mapped in Fig. 3. As shown in Fig. 3a, the local R2 of public health ranged from 0.620 to 0.907, exhibiting significantly different degrees of model fit across these 145 counties. As shown in Fig. 3a for local R2 in health models, most countries (e.g. Sudan, Mauritania, and Djibouti) with a high R2 were distributed in Sub-Saharan Africa and North Africa, indicating that the integrated vulnerability framework could comprehensively explain the state of public health in those countries. On the contrary, countries with a low R2 were mainly located in Latin America and North America (e.g. Mexico, Belize, and the United States).
Table 5.
The results of the GWR on public health
| Variable | Mean coefficient | Std. Dev. | Min | Max |
|---|---|---|---|---|
| Intercept | 0.138 | 0.259 | − 0.312 | 0.632 |
| Ageing ratio | 0.011 | 0.063 | − 0.181 | 0.173 |
| Urbanisation ratio | 0.152 | 0.146 | − 0.106 | 0.714 |
| PM2.5 | − 0.160 | 0.193 | − 0.743 | 0.172 |
| Biocapacity | − 0.026 | 0.069 | 0.237 | 0.304 |
| GNI per capita | 0.134 | 0.387 | − 0.604 | 1.153 |
| Education level | 0.130 | 0.240 | − 0.315 | 0.504 |
| Social governance | 0.373 | 0.159 | − 0.052 | 0.731 |
| R-squared = 0.890, log likelihood = − 45.752, Akaike information criterion = 175.844, Bayesian information criterion = 301.372 | ||||
Fig. 3.

The local vulnerability effects on public health and health inequality1
Figure 3b–3d further show the local coefficients of vulnerability variables that significantly affected public health. First, high coefficients of urbanisation were found in African countries with relatively low urbanisation ratios (Fig. 3b). Besides, these countries mainly feature low-income and lower-middle-income economies. This implies that urbanisation helped to promote public health in these underdeveloped countries. Second, the impact of the social education level on public health improvement in Brazil, Paraguay, and many other Latin America countries was powerful (Fig. 3c). Finally, social governance capacity in Tonga, Guyana, and many other Sub-Saharan African and Latin American countries significantly promoted public health. According to Fig. 3d, countries with high coefficients of social governance exhibit relatively good social governance capacity in general. In addition, apart from Tonga (classified as a low-income economy), social governance capacity remarkably increased public health in many upper-middle-income economies (e.g. Guyana, Dominica, and Fiji) and high-income economies (e.g. Barbados, Antigua, and Barbuda). This result indicates that in these economically advanced countries, social governance could easily play a positive role in citizens’ health promotion. To sum up, the effects of vulnerability on public health varied significantly worldwide.
In terms of model adaptability for health inequality, the GWR model (R2 = 0.785, AIC = 235.885) was a better fit than the OLS model (R2 = 0.691, AIC = 255.619). Consistent with the health results, there were apparent differences among countries regarding the vulnerability effects on health inequality globally. The standardised GWR results for health inequality are summarised in Table 6; Fig. 3e–3h. The local R2 in health inequality models ranged from 0.621 to 0.819, implying differences of model fit across countries. As illustrated in Fig. 3e, most countries (e.g. Saudi Arabia, Bahrain, and Qatar) with high R2 were located in the Middle East and North Africa. Different from public health, the integrated vulnerability framework had good explanations for health inequality in countries with poor social security
Table 6.
The results of the GWR on health inequality
| Variable | Mean coefficient | Std. Dev. | Min | Max |
|---|---|---|---|---|
| Intercept | − 0.037 | 0.123 | − 0.261 | 0.217 |
| Ageing ratio | 0.043 | 0.055 | − 0.144 | 0.146 |
| Urbanisation ratio | − 0.202 | 0.098 | − 0.329 | 0.019 |
| PM2.5 | 0.020 | 0.044 | − 0.101 | 0.172 |
| Biocapacity | − 0.026 | 0.069 | 0.237 | 0.304 |
| GNI per capita | 0.071 | 0.144 | − 0.407 | 0.309 |
| Education level | − 0.451 | 0.075 | − 0.552 | − 0.279 |
| Social governance | − 0.365 | 0.119 | − 0.657 | − 0.236 |
| R-squared = 0.785, log likelihood = − 93.533, Akaike information criterion = 235.885, Bayesian information criterion = 308.407 | ||||
The local coefficients of vulnerability indicator that significantly affected health inequality are presented in Fig. 3f–3h. For the urbanisation ratio of the sensitivity dimension, the high coefficients of urbanisation related to health inequality were mainly found in developed countries with high urbanisation ratios (e.g. France, Switzerland, and the Netherlands). In terms of the capacity dimension, social education played an important role in eliminating health inequalities in Sub-Saharan African countries with poor education levels (e.g. Uganda, Kenya, and Ethiopia). The impact of social governance on health inequality in Peru, Bolivia, Colombia, and many other Latin American countries was remarkable (Fig. 3h). In general, these countries are predominantly underdeveloped countries with poor social governance capacity and low economic development levels. Similar to social education level, social governance helped social inequality elimination, especially in countries with poor governance. In summary, the effects of vulnerability on health inequality varied greatly across countries.
Discussion
In general, most countries globally experienced poor public health and high health inequality. As has been demonstrated in the literature, a country’s high inequality level was harmful to social trust and cooperation, subsequently affecting social development and stability (Wang et al., 2020). In particular, it could be proposed that health inequality among citizens destroyed the equality of health resource allocation and the optimal configuration of health services. Therefore, it is crucial to identify factors that contribute to reducing health inequality. This is in line with previous studies which reported that most Nordic countries (e.g. Norway, Finland, and Iceland) exhibited high life expectancy, but many African countries (e.g. the Central African Republic, and Mali) presented low life expectancy in during the period 1950–2015 (Liou et al., 2020). The current study confirms that this feature persisted, at least until 2016.
According to our results, the integrated vulnerability framework provides a powerful explanation of public health and health inequality. Compared with economic and environmental factors, social indicators are the main factors affecting public health. Specifically, it was found that the rapid urbanisation of social structure transformation contributed significantly to public health promotion and health inequality elimination. It can be explained that, in urban areas, because of the scale effect in industrial zones under the guidance of urban planning, people do benefit from a high environmental quality. In addition, urbanisation as a symbol of regional development has potential advantages for public care and medical service system construction. There is also an interesting comparison of urbanisation effects on public health and health inequality across countries. Based on GWR results, urbanisation promoted public health in many low urbanised countries and reduced health inequality in many highly urbanised counties. This implies that urbanisation helps to increase public health with sufficient health service support and alleviate health inequality with optimised health resources. As the ‘healthy city’ concept suggests, public health in cities can be improved by efficient land use (Nieuwenhuijsen, 2020). Thus, it can be deduced that reasonable public resource allocation and excellent public service systems in cities are beneficial in that they reduce health inequality.
It is a bit surprising that PM2.5 risk slightly reduced health inequality in the SLM analysis. In essence, health inequality has been viewed as a kind of social structure rather than a simple medical or epidemiological problem (Reeves & Mackenbach, 2019). Though it has been confirmed that PM2.5 risk was negatively related to human health (Liu et al., 2017), it has not further lead to health inequality among citizens in the current study. Therefore, it can be understood that health inequality problems are not triggered by a direct and simplified pollution consequence pathway. Compared to the PM2.5 quality guideline proposed by the WHO (2005), the global PM2.5 concentration (27.884 µg/m3) was markedly higher than the safe threshold (10 µg/m3). It can be concluded that high PM2.5 risk puts the entire public at risk, and the health inequality level is therefore low.
For social indicators of the capacity dimension, our findings confirmed that social education and social governance promotion contributed to increasing public health and reducing health inequality globally. Education, as a health-related social resource, has been proven to be closely related to the social health gradient (Vallée et al., 2020). Consistent with previous studies (Côté-Sergent et al., 2020; Silles, 2009), GWR results showed that people in high-income countries generally had long education year than the world’s average education year. In addition, the GWR results also signified that social education was the most important indicator of vulnerability which contributed to eliminating health inequality in countries with relatively low education levels. This result inspires governments in poor-educated countries to promote public education, not only for educational purposes but also for health inequality reduction.
Our findings of social governance effects extend the existing literature about the influencing factors of public health, revealing that not only health care governance but also general social governance was conducive to public health improvement. As noted, social governance is the most important factor for both public health and health inequality in the SLM results. Moreover, the cross-country difference of the effects of vulnerability on public health and health inequality signify that distinguished policies are essential to cope with health challenges for policymakers. As has been found in previous study that governance was correlated with public health (Olafsdottir et al., 2014), the current study further quantitatively revealed social governance could notably improve public health and reduce health inequality. In addition, studies have found that some underdeveloped countries (e.g. Ghana and Sierra Leone) in Africa with weak governance did not have sufficient ability to cope with global risks (Johnson, 2019). It is not difficult to understand that the cost of health care in these underdeveloped countries is relatively high, which may lead to uneven health statuses among people. Similar to social education, social governance is usually driven and supported by national governments. It is, therefore, essential for governments to provide sufficient education resources and good social governance conditions for public health promotion. Thus, a comprehensive health promotion project should be established by governments, with integrated considerations of social structure, economic development level, social education level, and social governance capacity.
Conclusions
The current study constructed an integrated vulnerability framework of social, economic, and environmental indicators’ effects on public health and health inequality. Following the construction of the vulnerability concept, the sensitivity dimensions of social structure and environmental risk; and the capacity dimensions of biocapacity, economic capacity, social education level, and social governance capacity were selected as vulnerability indicators for public health and health inequality. Considering the spatial heterogeneity across countries, the spatial econometric models and geographically weighted regressions were conducted to examine the effects of vulnerability indicators on public health and health inequality. Results showed that social indicators, including the urbanisation ratio, social education level, and social governance capacity, contributed to improving public health and reducing health inequality worldwide. In addition, environmental risk and economic capacity had relative low impacts on health inequality globally. Furthermore, the geographically weighted regression models indicated that the effects of vulnerability on both public health and health inequality differed greatly across countries.
The strengths of this study are embodied in three aspects. First, it provides an integrated theoretical framework for social, economic, and environmental indicators related to health and health inequality from a vulnerability perspective. Second, using spatial econometric models, the effects of vulnerability indicators on health and health inequality globally are examined. Finally, geographically weighted regressions are conducted for local analysis among variables, considering the spatial heterogeneity of regional vulnerability to the extent possible.
With regard to weakness, this research also has several limitations. The limitations of the current study and the propose of future studies are as follows: First, the data analyzed in the study were cross-sectional, which limits time-series analysis. Future research on long-term effects analysis globally is constructive if the annual data available. Another limitation is that the environmental risk was confined to PM2.5 risk. Future research may expand our research to include other environmental risk indicators, if appropriate data available for analysis. In addition, this novel vulnerability framework could be extended to other social issues such as income inequality and education inequality where related data are available.
Funding
This study was funded by the National Social Science Foundation of China (Grant number 18BSH122) and Fundamental Research Funds for the Central Universities (Grant number 010914370122). The founders had no role in study design, data collection and analysis, decision to publish, or preparation of the manuscript.
Availability of data and material
The datasets generated and analysed during the current study are available in the UNDP database [http://hdr.undp.org/]; OECD statistics database [https://stats.oecd.org/]; Global Footprint Network database [http://www.footprintnetwork.org]; World Bank database [https://data.worldbank.org/region/world]; and GWI database [http://info.worldbank.org/governance/wgi/].
Code Availability
Spatial econometric model analysis was conducted in GeoDa software (version, 1.14). GeoDa software is a spatial data analysis tool developed by Center for Spatial Data Science, the University of Chicago. Geographically weighted regression (GWR) was conducted in MGWR software (version, 2.2.1). MGWR software is a multi-level geographically weighted regression analysis software developed by Spatial Analysis Research Center (SPARC), Arizona State University, Tempe, USA.
Declarations
Competing interests
The authors declare that they have no competing interests.
Footnotes
Notes: 3a is the local R2 effects of vulnerability on public health; 3b is the local urbanisation effects on public health; 3c is the local social education effects on public health; 3d is the local social governance effects on public health; 3e is the local R2 effects of vulnerability on health inequality; 3f is the local urbanisation effects on health inequality; 3 g is the local economic effects on health inequality; 2 h is the local social governance effects on health inequality.
Publisher’s Note
Springer Nature remains neutral with regard to jurisdictional claims in published maps and institutional affiliations.
References
- Acemoglu D, Johnson S. Disease and Development: The Effect of Life Expectancy on Economic Growth. Journal of Political Economy. 2007;115(6):925–985. doi: 10.1086/529000. [DOI] [Google Scholar]
- Anselin, L., Syabri, I., & Kho, Y. (2006). GeoDa: An Introduction to Spatial Data Analysis. Geographical Analysis, 38(1), 5–22. 10.1007/978-3-642-03647-7_5
- Bera S, Das A, Mazumder T. A multi-objective framework for multidimensional vulnerability assessment-Case of a coastal district of West Bengal, India. Journal of Environmental Management. 2019;249:109411. doi: 10.1016/j.jenvman.2019.109411. [DOI] [PubMed] [Google Scholar]
- Brooks N, Adger N, Mick Kelly P. The determinants of vulnerability and adaptive capacity at the national level and the implications for adaptation. Global Environmental Change. 2005;15(2):151–163. doi: 10.1016/j.gloenvcha.2004.12.006. [DOI] [Google Scholar]
- Cáceres CF, Mendoza W. Changing care and prevention needs for global public health: In pursuit of a comprehensive perspective. Global Public Health. 2012;7:S29–S45. doi: 10.1080/17441692.2012.657664. [DOI] [PubMed] [Google Scholar]
- Chankrajang T, Muttarak R. Green Returns to Education: Does Schooling Contribute to Pro-Environmental Behaviours? Evidence from Thailand. Ecological Economics. 2017;131:434–448. doi: 10.1016/j.ecolecon.2016.09.015. [DOI] [Google Scholar]
- Clark R, Snawder K. A cross-national analysis of lifespan inequality, 1950-2015: examining the distribution of mortality within countries. Social Indicators Research. 2020;148(3):1–28. doi: 10.1007/s11205-019-02216-7. [DOI] [Google Scholar]
- Cole WM. Wealth and health revisited: Economic growth and wellbeing in developing countries, 1970 to 2015. Social Science Research. 2019;77:45–67. doi: 10.1016/j.ssresearch.2018.09.003. [DOI] [PubMed] [Google Scholar]
- Côté-Sergent A, Fonseca R, Strumpf E. Comparing the education gradient in health deterioration among the elderly in six OECD countries. Health Policy. 2020;124:326–335. doi: 10.1016/j.healthpol.2019.12.015. [DOI] [PubMed] [Google Scholar]
- De Breij S, Huisman M, Deeg DJH. Macro-level determinants of post-retirement health and health inequalities: A multilevel analysis of 18 European countries. Social Science & Medicine. 2019;245:112669. doi: 10.1016/j.socscimed.2019.112669. [DOI] [PubMed] [Google Scholar]
- Fu Z, Li R. The contributions of socioeconomic indicators to global PM2.5 based on the hybrid method of spatial econometric model and geographical and temporal weighted regression. Science of The Total Environment. 2020;703:135481. doi: 10.1016/j.scitotenv.2019.135481. [DOI] [PubMed] [Google Scholar]
- Global Footprint Network (2019). Global Footprint Network advancing the science of sustainability. Retrieved June 3, 2020, from http://www.footprintnetwork.org
- Gilbert A, Chakraborty J. Using geographically weighted regression for environmental justice analysis: Cumulative cancer risks from air toxics in Florida. Social Science Research. 2011;40(1):273–286. doi: 10.1016/j.ssresearch.2010.08.006. [DOI] [Google Scholar]
- Gillespie DOS, Trotter MV, Tuljapurkar SD. Divergence in Age Patterns of Mortality Change Drives International Divergence in Lifespan Inequality. Demography. 2014;51(3):1003–1017. doi: 10.1007/s13524-014-0287-8. [DOI] [PMC free article] [PubMed] [Google Scholar]
- Guldbrandsson K, Bremberg S. Cross-sectoral cooperation at the ministerial level in three Nordic countries-With a focus on health inequalities. Social Science & Medicine. 2020;256:112999. doi: 10.1016/j.socscimed.2020.112999. [DOI] [PubMed] [Google Scholar]
- Ivaldi E, Parra Saiani P, Primosich J, Bruzzi C. Health and Deprivation: A New Approach Applied to 32 Argentinian Urban Areas. Social Indicators Research. 2020;151:155–179. doi: 10.1007/s11205-020-02369-w. [DOI] [Google Scholar]
- Johnson MF. Strong (green) institutions in weak states: Environmental governance and human (in) security in the Global South. World Development. 2019;122:433–445. doi: 10.1016/j.worlddev.2019.06.010. [DOI] [Google Scholar]
- Kim K. Which Income Inequality Influences Which Health Indicators? Analysis of the Income Inequality Hypothesis with Market and Disposable Gini Indicators. Social Indicators Research. 2019;146:473–485. doi: 10.1007/s11205-019-02129-5. [DOI] [Google Scholar]
- Li B, Cheng S, Xiao D. The impacts of environmental pollution and brain drain on income inequality. China Economic Review. 2020;62:101481. doi: 10.1016/j.chieco.2020.101481. [DOI] [Google Scholar]
- Liou, L., Joe, W., Kumar, A., & Subramanian, S. V. (2020). Inequalities in life expectancy: An analysis of 201 countries, 1950–2015. Social Science & Medicine, 253, 112964. 10.1016/j.socscimed.2020.112964 [DOI] [PubMed]
- Liu H, Fang C, Zhang X, Wang Z, Bao C, Li F. The effect of natural and anthropogenic factors on haze pollution in Chinese cities: A spatial econometrics approach. Journal of Cleaner Production. 2017;165:323–333. doi: 10.1016/j.jclepro.2017.07.127. [DOI] [Google Scholar]
- Mackenbach JP. The persistence of health inequalities in modern welfare states: The explanation of a paradox. Social Science & Medicine. 2012;75(4):761–769. doi: 10.1016/j.socscimed.2012.02.031. [DOI] [PubMed] [Google Scholar]
- Mandal I, Pal S. Modelling Human Health Vulnerability Using Different Machine Learning Algorithms in Stone Quarrying and Crushing Areas of Dwarka River Basin, Eastern India. Advances in Space Research. 2020;66:1351–1371. doi: 10.1016/j.asr.2020.05.032. [DOI] [Google Scholar]
- McNeeley SM, Even TL, Gioia JBM, Knapp CN, Beeton TA. Expanding vulnerability assessment for public lands: The social complement to ecological approaches. Climate Risk Management. 2017;16:106–119. doi: 10.1016/j.crm.2017.01.005. [DOI] [Google Scholar]
- Mia S, Uddin M, Kader M, Ahsan A, Mannan M, Hossain M, Solaiman Z. Pyrolysis and co-composting of municipal organic waste in Bangladesh: A quantitative estimate of recyclable nutrients, greenhouse gas emissions, and economic benefits. Waste Management. 2018;75:503–513. doi: 10.1016/j.wasman.2018.01.038. [DOI] [PubMed] [Google Scholar]
- Niccolucci V, Tiezzi E, Pulselli FM, Capineri C. Biocapacity vs Ecological Footprint of world regions: A geopolitical interpretation. Ecological Indicators. 2012;16:23–30. doi: 10.1016/j.ecolind.2011.09.002. [DOI] [Google Scholar]
- Nieuwenhuijsen MJ. Urban and transport planning pathways to carbon neutral, liveable and healthy cities; A review of the current evidence. Environment International. 2020;140:105661. doi: 10.1016/j.envint.2020.105661. [DOI] [PubMed] [Google Scholar]
- OECD (2018). Environment Database: Exposure to PM 2.5 in countries and regions. Retrieved June 3, 2020, from https://stats.oecd.org/
- Olafsdottir S, Bakhtiari E, Barman E. Public or private? The role of the state and civil society in health and health inequalities across nations. Social Science & Medicine. 2014;123:174–181. doi: 10.1016/j.socscimed.2014.09.045. [DOI] [PubMed] [Google Scholar]
- Ortega F, Orsini M. Governing COVID-19 without government in Brazil: Ignorance, neoliberal authoritarianism, and the collapse of public health leadership. Global Public Health. 2020;15(9):1–21. doi: 10.1080/17441692.2020.1795223. [DOI] [PubMed] [Google Scholar]
- Parkes M, Horwitz P. Water, ecology and health: ecosystems as settings for promoting health and sustainability. Health Promotion International. 2009;24(1):94–102. doi: 10.1093/heapro/dan044. [DOI] [PubMed] [Google Scholar]
- Parkes, M., Morrison, K., Bunch, M., Hallström, L., Neudoerffer, R., Venema, H., & Waltner-Toews, D. (2010). Towards integrated governance for water, health and social?ecological systems: The watershed governance prism. Global Environmental Change, 20(4), 693–704. 10.1016/j.gloenvcha.2010.06.001
- Quiroga S, Suárez C, Diego Solís J, Martinez-Juarez P. Framing vulnerability and coffee farmers’ behaviour in the context of climate change adaptation in Nicaragua. World Development. 2020;126:104733. doi: 10.1016/j.worlddev.2019.104733. [DOI] [Google Scholar]
- Razavi SD, Kapiriri L, Wilson M, Abelson J. Applying priority-setting frameworks: A review of public and vulnerable populations’ participation in health-system priority setting. Health Policy. 2020;124:133–142. doi: 10.1016/j.healthpol.2019.12.005. [DOI] [PubMed] [Google Scholar]
- Reeves A, Mackenbach J. Can inequalities in political participation explain health inequalities? Social Science & Medicine. 2019;234:112371. doi: 10.1016/j.socscimed.2019.112371. [DOI] [PubMed] [Google Scholar]
- Rosenberg D, Kozlov V, Libman A. Political regimes, income and health: Evidence from sub-national comparative method. Social Science Research. 2019;77:20–37. doi: 10.1016/j.ssresearch.2018.02.001. [DOI] [PubMed] [Google Scholar]
- Silles MA. The causal effect of education on health: Evidence from the United Kingdom. Economics of Education Review. 2009;28(1):122–128. doi: 10.1016/j.econedurev.2008.02.003. [DOI] [Google Scholar]
- Singh R, Murty H, Gupta S, Dikshit A. An overview of sustainability assessment methodologies. Ecological indicators. 2009;9(2):189–212. doi: 10.1016/j.ecolind.2011.01.007. [DOI] [Google Scholar]
- UNDP (2016). Human Development Indicators. Retrieved June 3, 2020, from http://hdr.undp.org/
- United Nations (2014). World Urbanization Prospects. The 2014 Revision, Highlights. Retrieved June 3, 2020, from http://esa.un.org/unpd/wup/Highlights/WUP2014-Highlights.pdf
- Vačkář D. Ecological Footprint, environmental performance and biodiversity: A cross-national comparison. Ecological Indicators. 2012;16:40–46. doi: 10.1016/j.ecolind.2011.08.008. [DOI] [Google Scholar]
- Vallée J, Shareck M, Le Roux G, Kestens Y, Frohlich K. Is accessibility in the eye of the beholder? Social inequalities in spatial accessibility to health-related resources in Montréal, Canada. Social Science & Medicine. 2020;245:112702. doi: 10.1016/j.socscimed.2019.112702. [DOI] [PubMed] [Google Scholar]
- Vommaro F, Menezes J, de Lima Barata M. Contributions of Municipal Vulnerability Map of the Population of the State of Maranhão (Brazil) to the Sustainable Development Goals. Science of The Total Environment. 2020;706:134629. doi: 10.1016/j.scitotenv.2019.134629. [DOI] [PubMed] [Google Scholar]
- Wang S, Wu J. Spatial heterogeneity of the associations of economic and health care factors with infant mortality in China using geographically weighted regression and spatial clustering. Social Science & Medicine. 2020;263:113287. doi: 10.1016/j.socscimed.2020.113287. [DOI] [PubMed] [Google Scholar]
- Ward H, Dorussen H. Public Information and Performance: The Role of Spatial Dependence in the Worldwide Governance Indicators among African Countries. World Development. 2015;74:253–263. doi: 10.1016/j.worlddev.2015.05.002. [DOI] [Google Scholar]
- Wang J, Wang S, Li S. Examining the spatially varying effects of factors on PM2.5 concentrations in Chinese cities using geographically weighted regression modeling. Environmental Pollution. 2019;248:792–803. doi: 10.1016/j.envpol.2019.02.081. [DOI] [PubMed] [Google Scholar]
- Wang Z, Xu N, Wei W, Zhao N. Social inequality among elderly individuals caused by climate change: Evidence from the migratory elderly of mainland China. Journal of Environmental Management. 2020;272:111079. doi: 10.1016/j.jenvman.2020.111079. [DOI] [PubMed] [Google Scholar]
- Weißhuhn P, Müller F, Wiggering H. Ecosystem Vulnerability Review: Proposal of an Interdisciplinary Ecosystem Assessment Approach. Environmental Management. 2018;61(6):904–915. doi: 10.1007/s00267-018-1023-8. [DOI] [PubMed] [Google Scholar]
- WHO (2005). Air quality guidelines: global update 2005. Particulate matter, ozone, nitrogen dioxide and sulfur dioxide. Retrieved June 3, 2020, from https://www.euro.who.int/__data/assets/pdf_file/0005/78638/E90038.pdf
- WHO (2016). Preventing disease through healthy environments: a global assessment of the burden of disease from environmental risks. Retrieved June 3, 2020, from https://www.who.int/quantifying_ehimpacts/publications/preventing-disease/en/
- WHO (2018). Factsheet on ambient air quality and health. Retrieved June 3, 2020, from http://www.who.int/news-room/fact-sheets/detail/ambient-(outdoor)-air-quality-and-health
- Wu H, Gai Z, Guo Y, Li Y, Hao Y, Lu Z. Does environmental pollution inhibit urbanization in China? A new perspective through residents’ medical and health costs. Environmental Research. 2020;182:109128. doi: 10.1016/j.envres.2020.109128. [DOI] [PubMed] [Google Scholar]
- Xie Y, Gong H, Lan H, Zeng S. Examining shrinking city of Detroit in the context of socio-spatial inequalities. Landscape and Urban Planning. 2018;177:350–361. doi: 10.1016/j.landurbplan.2018.03.002. [DOI] [Google Scholar]
- Yang T, Liu W. Does air pollution affect public health and health inequality? Empirical evidence from China. Journal of Cleaner Production. 2018;203:43–52. doi: 10.1016/j.jclepro.2018.08.242. [DOI] [Google Scholar]
- Yang X, Wu Y, Shen Q, Dang H. Measuring the degree of speculation in the residential housing market: A spatial econometric model and its application in China. Habitat International. 2017;67:96–104. doi: 10.1016/j.habitatint.2017.06.005. [DOI] [Google Scholar]
- Yu D. Modeling Owner-Occupied Single-Family House Values in the City of Milwaukee: A Geographically Weighted Regression Approach. GIScience & Remote Sensing. 2007;44(3):267–282. doi: 10.2747/1548-1603.44.3.267. [DOI] [Google Scholar]
- Zhang Z, Shao C, Guan Y, Xue C. Socioeconomic factors and regional differences of PM2.5 health risks in China. Journal of Environmental Management. 2019;251:109564. doi: 10.1016/j.jenvman.2019.109564. [DOI] [PubMed] [Google Scholar]
- Zhao Y, Li K, Zhang L. A meta-analysis of online health adoption and the moderating effect of economic development level. International Journal of Medical Informatics. 2019;127:68–79. doi: 10.1016/j.ijmedinf.2019.04.015. [DOI] [PubMed] [Google Scholar]
Associated Data
This section collects any data citations, data availability statements, or supplementary materials included in this article.
Data Availability Statement
The datasets generated and analysed during the current study are available in the UNDP database [http://hdr.undp.org/]; OECD statistics database [https://stats.oecd.org/]; Global Footprint Network database [http://www.footprintnetwork.org]; World Bank database [https://data.worldbank.org/region/world]; and GWI database [http://info.worldbank.org/governance/wgi/].
Spatial econometric model analysis was conducted in GeoDa software (version, 1.14). GeoDa software is a spatial data analysis tool developed by Center for Spatial Data Science, the University of Chicago. Geographically weighted regression (GWR) was conducted in MGWR software (version, 2.2.1). MGWR software is a multi-level geographically weighted regression analysis software developed by Spatial Analysis Research Center (SPARC), Arizona State University, Tempe, USA.