

Abstract
The effect of low health literacy (HL) on outcomes in end-stage liver disease (ESLD) is largely unknown. The association of low HL on clinical outcomes was investigated in a prospective cohort of outpatients with ESLD undergoing liver transplantation (LT) evaluation. From 2014 to 2017, 276 patients underwent LT evaluation with assessments of liver disease severity, medical and psychosocial comorbidities, physical frailty, and malnutrition. Literacy was measured with the Newest Vital Sign, a brief validated assessment. Multivariate models assessed relationships between HL and clinical outcomes adjusting for clinical and psychosocial variables. The median Model for End-Stage Liver Disease–sodium score of the study sample was 15 (interquartile range, 11–19), 71 (25.7%) of candidates were frail, 117 (42.4%) had malnutrition, 151 (54.7%) had hepatic encephalopathy, 104 (37.7%) had low HL, and 85 (39.2%) had marginal or poor social support. Adjusting for education level, socioeconomic factors, and severity of illness, low HL was independently associated with physical frailty (adjusted odds ratio [aOR], 3.59; 95% confidence interval [CI], 1.50–8.59; P = 0.004) and not being wait-listed (aOR 1.96; 95% CI, 1.03–3.75; P = 0.04). Strong social support attenuated the relationship between low HL and not being wait-listed (aOR, 1.58; 95% CI, 0.74–3.36; P = 0.24). Low HL is common and a largely unrecognized risk factor for poor health outcomes among patients with ESLD. Patient-oriented infrastructure and support are needed at the health system level to ensure all patients can successfully navigate the complex process of LT evaluation and wait-listing.
Recent studies have increased recognition of important factors beyond the Model for End-Stage Liver Disease (MELD) score in predicting outcomes in end-stage liver disease (ESLD). In addition to the physiologic disturbances of liver failure, the associated decline in physical and nutritional health independently predict liver-specific morbidity and mortality. Frailty, defined as the loss of physiologic reserve and increased susceptibility to stressors, is common and increases the risk of hospitalization and death in ESLD.(1,2) As a result, it is now recommended that liver transplantation (LT) candidates be assessed for the physical components of frailty as part of their transplant eligibility determination and be assessed longitudinally while active on the LT list.(3)
An additional component that affects outcomes in ESLD is cognitive impairment, particularly given the frequent presence of hepatic encephalopathy (HE). Both physical frailty and cognitive impairment have been associated with increased health care utilization among patients with HE and diminished quality of life for those without preexisting HE.(4,5) In the geriatric population, research has shown that frailty and cognitive decline are closely linked processes,(6,7) which has led to the development of comprehensive frailty measurement tools that incorporate measures of cognitive function.(8,9)
Health literacy (HL) is a distinct and important construct that may additionally affect outcomes in ESLD.(10) HL is defined as the set of cognitive (ie, the capacity to think) and noncognitive (ie, the capacity to act) skills that allow individuals to access and use information to promote and maintain good health.(11) HL is a partial mediator in the causal relationship between education and health, and particularly impacts health outcomes in patients with low education.(12) Inadequate HL has been linked to many adverse health outcomes such as poor self-care, increased hospitalizations, and mortality among patients with chronic illnesses.(10) In the geriatric population, HL has been shown to predict frailty independent of other patient characteristics, including educational attainment.(13,14) Noncognitive HL attributes, such as the ability to set goals, adapt to adverse events, make good choices, and take action, do not consistently correlate with educational level. Yet, these skills are particularly important for self-care, and they may even have a greater impact on health outcomes than cognitive skills and educational level altogether.(11,15)
The ability to navigate complex health systems and engage in self-management behaviors are critically important for patients with ESLD, particularly in the context of LT evaluation and transplantation. However, to date, empirical evidence on the effect of HL in health outcomes in ESLD is limited to a single study on its influence on post-LT immunosuppression management.(16) The objectives of this study were to address this evidence gap; to investigate the relationship between HL and frailty in a prospective cohort of patients with ESLD; and to evaluate the impact of HL on pretransplant and posttransplant outcomes accounting for sociodemographic factors, physical function, nutritional status, and clinical characteristics.
Patients and Methods
STUDY DESIGN AND PROCEDURE
This was a prospective cohort study of outpatients with ESLD evaluated for LT from July 2014 to February 2017 at the University of Pennsylvania, which is a large urban transplant center located in the northeastern United States. The vast majority of LT evaluation referrals arise from urban, suburban, and rural regions of Pennsylvania; New Jersey; Delaware; Maryland; Washington, DC; and Virginia. The demographics of adults listed at the University of Pennsylvania versus all other centers nationally using data from the United Network for Organ Sharing (UNOS) are shown in Supporting Table 1. Notably, evidence of active health insurance coverage is a requirement for patients to be seen for an LT evaluation clinic at our center.
Frailty and literacy assessments were conducted at the time of the initial LT evaluation office visit. During this appointment, LT candidates met with a multidisciplinary transplant team that included a transplant coordinator, a transplant hepatologist, a transplant surgeon, a social worker, and a registered dietitian. Candidates also received an educational presentation on the day of their clinic visit, which is a standardized component of LT evaluation at our center. The registered dietitian administered the functional status, nutritional status, and HL assessments as detailed later. HL measurements were obtained as part of the standard-of-care procedure on select outpatient LT evaluation clinic dates between July 2014 and February 2017. On each LT evaluation clinic session during which HL assessments were obtained, all patients scheduled that date were approached. As a result, patient informed consent was not required for HL measurements. HL assessments were not performed in 7/283 patients due to being non-English speaking. This research was approved by the institutional review board at the University of Pennsylvania with a waiver of informed consent.
MEASURES AND STUDY DEFINITIONS
Frailty Assessment
Physical frailty was assessed in 2 ways:
Age-adjusted and body mass index (BMI)–adjusted grip strength alone, which is a single validated measure of frailty.(17)
A composite measure using 3 of the 5 components of the Fried frailty index,(18) which was abbreviated to efficiently integrate the assessment into the clinical workflow of a busy transplant clinic.
The 3 components included in the composite measure were shrinking, weakness, and self-reported exhaustion. Shrinking was defined as an unintentional weight loss ≥10 pounds or ≥5% of body weight in the past 12 months. Weakness was present if a patient’s grip strength scored in the lowest 20th percentile adjusted for age and BMI. Grip strength was measured in kilograms using the Jamar Hydraulic Hand Dynamometer (Jamar™, Chicago, IL) with the mean of 3 measurements of the patient’s dominant hand to obtain the final value. Exhaustion was reported subjectively by patient recall over the preceding week and defined as present if they responded “a moderate amount of the time (3–4 days/week)” or “all of the time (5–7 days/week)” to the following items on the Center for Epidemiological Studies Depression scale: “I felt that everything I did was an effort” or “I could not get going.”(18) The range of scores was 0–3, with 1 point for each domain.
Nutrition Assessment
Nutrition evaluation was performed using the abridged self-reported Patient-Generated Subjective Global Assessment (SGA). This abridged validated questionnaire assesses dietary intake, gastrointestinal symptoms, and physical activity.(17,19) The SGA tool is particularly effective in the early identification of malnutrition among patients undergoing surgery, and it has also been used in multiple prior studies for the detection of malnutrition in patients with ESLD.(20,21) Nutritional status categories according to the SGA questionnaire are as follows: A, well-nourished; B, moderately malnourished; and C, severely malnourished.
HL Assessment
HL was measured with the Newest Vital Sign (NVS), which contains 6 questions based on the information contained on an ice cream nutrition label. A score of 0–1 suggests a high likelihood of low HL, whereas a score of 2–6 suggests marginal or adequate literacy.(22) The NVS has been effectively used to assess HL in diverse health care settings.(23,24)
Clinical Covariates and Outcomes
Electronic health record (EHR) and center-specific UNOS data on patient age, sex, race/ethnicity, highest education level (high school [HS] or less, some college, and college or higher), BMI, etiology of liver disease, presence of ascites, presence and severity of HE, Model for End-Stage Liver Disease–sodium (MELD-Na) score, and medical comorbidities, such as diabetes, heart disease, lung disease, or chronic kidney disease (CKD), at transplant evaluation were obtained by trained research coordinators supervised by a transplant hepatologist (M.S.). Social support was assessed with the Stanford Integrated Psychosocial Assessment for Transplantation (SIPAT), a score that evaluates psychosocial transplant suitability.(25) Social support summary scores were obtained from sections 6 and 7 of the SIPAT questionnaire, which assess social support availability, functionality, and appropriateness of living space with lower scores indicating higher social support. Social support was analyzed as a binary variable: excellent or good support versus marginal or poor (scores of 0–1 versus 2 or greater). Social support is a well-known moderator of the effects of HL on health outcomes and is an important confounder to consider.(26) Neighborhood poverty level was assessed using patient’s permanent residence zip code and defined as the percent of individuals residing below the federal poverty level in each zip code, per 2000 United States census data (obtained as part of a prior study). Neighborhood poverty level was categorized as follows: <5%, 5%–9.9%, 10%–19.9%, and ≥20%.(27) Clinical outcomes included transplant listing, dying before transplant or becoming too sick for LT (the latter as per UNOS coding), and transplantation. Among patients transplanted (n = 91), 1-year post-LT survival was evaluated. Follow-up occurred until date of death, date of last recorded follow-up in the EHR or July 1, 2019, whichever came first.
STATISTICAL ANALYSIS
The primary exposure of interest was HL status as a binary variable: low HL (ie, NVS 0–1) versus marginal/adequate HL (ie, NVS 2–6).(22) Given the nonnormal distribution of the data, chi-square and Kruskal-Wallis tests were used for descriptive comparisons of categorical and continuous variables, respectively, across HL groups. In addition, Spearman’s rank correlation was used to evaluate the relationship between educational attainment and NVS score.
Separate logistic regression models were used to evaluate the association of HL with 3 different physical frailty outcomes: overall physical frailty, defined as being positive for 3 of 3 points of the Fried frailty criteria; weakness (ie, grip strength in the lowest 20th percentile adjusted for age and BMI); and self-reported exhaustion. Covariates were included in the final 3 multivariate models if they were significantly associated with HL or the outcome of overall physical frailty in univariate analyses with P < 0.1. BMI was excluded from these models due to grip strength being already a BMI-adjusted value. Because of the concern that educational attainment and socioeconomic factors influence HL, these 2 variables were forced into the models. Odds ratios (ORs) and adjusted odds ratios (aORs) were obtained from these analyses.
Multivariate logistic regression models were fit to evaluate the association between low HL and not being wait-listed for LT. In addition to education and socioeconomic factors, additional covariates were included in the multivariate model if they were significantly associated with HL or the primary outcome in univariate analyses with P < 0.1. The original multivariate model did not include social support as a covariate. In this model, low HL was found to be independently associated with not being wait-listed. The effect of strong social support (defined previously as good or excellent from the SIPAT assessment) as a potential mechanism for the relationship between HL and not being wait-listed was then investigated post hoc. Separate models were presented without (model 1) and with (model 2) this covariate to help explain the different associations observed.
Given that most of the deaths were observed prior to LT, survival analyses focused on the associations between HL and dying before LT or becoming too sick for LT whereby LT was a competing risk for the outcome. Subhazard ratios (SHRs) and adjusted SHRs were obtained from these analyses. Covariates were included in the multivariate model if they were significantly associated with the exposure or outcome with P < 0.1. Given the small number of posttransplant deaths, the association of HL and posttransplant mortality was evaluated descriptively using chi-square tests. All analyses were performed with Stata, version 15 (StataCorp, College Station, TX).
Results
In total, 283 LT outpatient candidates were evaluated for inclusion into the study between July 2014 and February 2017. Seven were nonnative English-speaking and were excluded from participation, leaving 276 participants in the final cohort. Overall, 37.7% (n = 104/276) had low HL. Figure 1 describes the outcomes of the final study cohort after initial LT evaluation. Over a median follow-up time of 3 years (interquartile range [IQR], 1.3–4.0 years), 133 patients were wait-listed, 91 underwent transplantation, and 52 total deaths were observed during follow-up: 33 before wait-listing, 12 while listed, and 7 after LT. For an additional 7 patients, LT was not pursued due to being too sick during either evaluation or listing. The primary reason for not pursuing listing was available for 118 of the 131 patients (90.1%) whose evaluation was closed, with the most frequent reasons being the following: medical contraindication (n = 37, 28.2%), LT not indicated or condition improved (n = 18, 13.7%), psychosocial contraindication (n = 15, 11.5%), loss to follow-up (n = 12, 9.2%), and patient choice (n = 8, 6.1%).
FIG. 1.
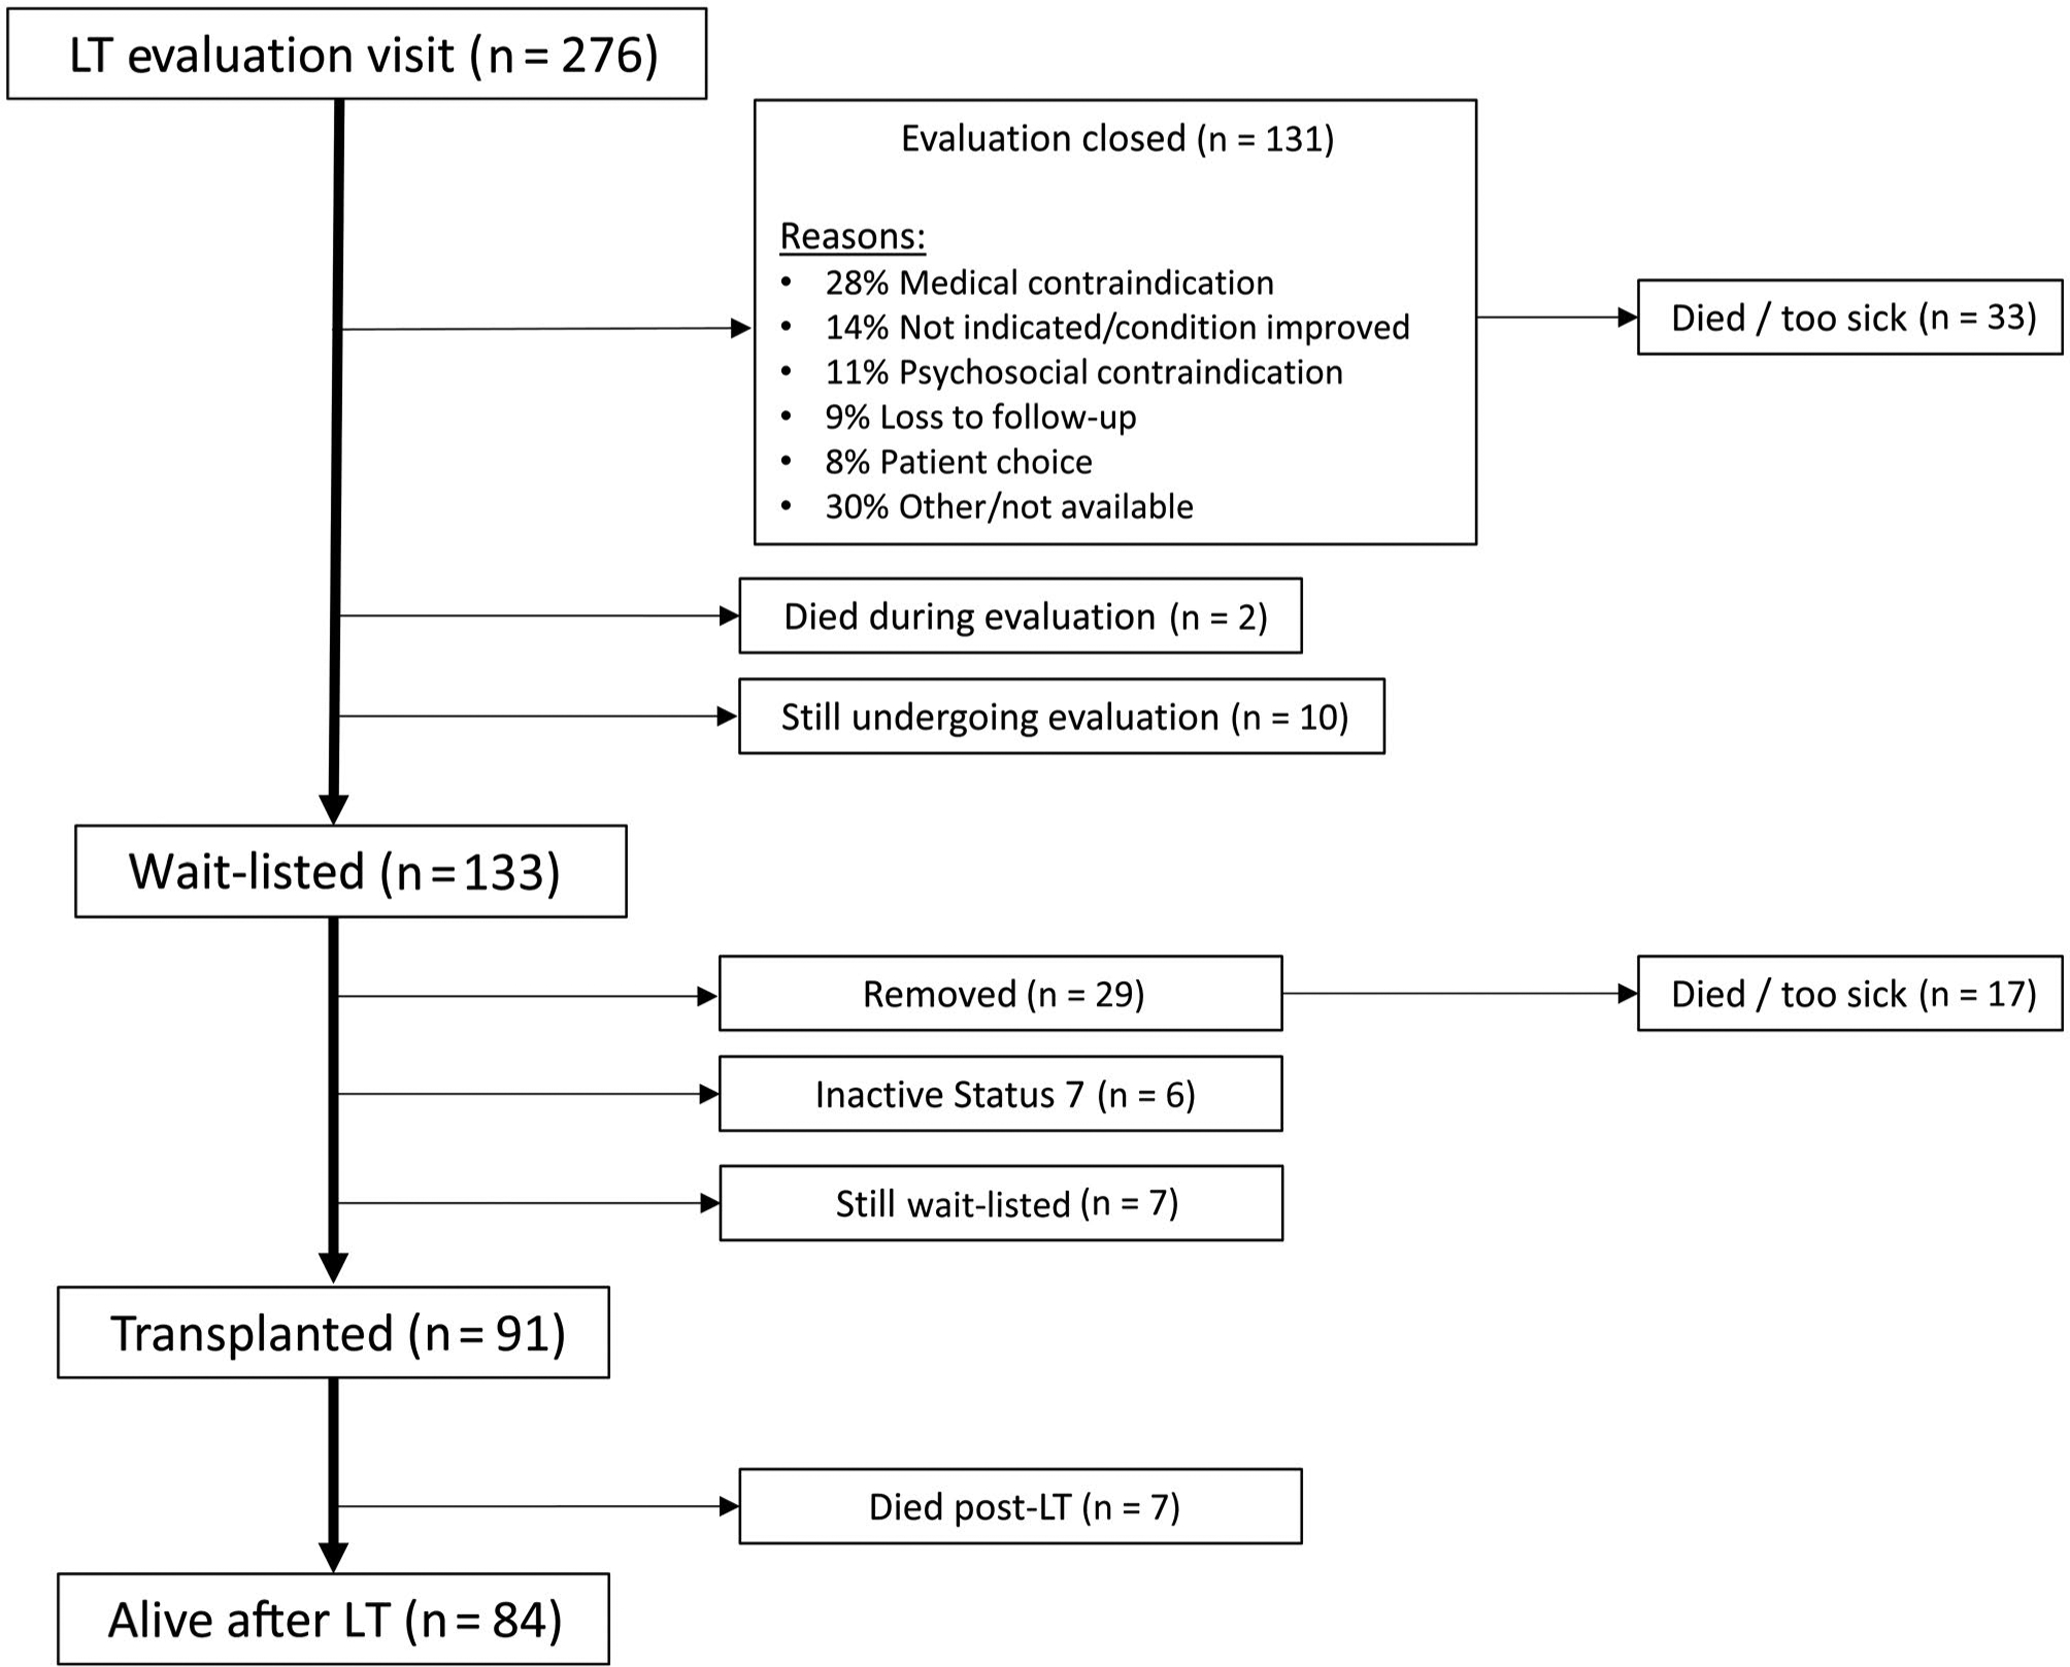
Patient flow diagram of candidates included in the final study cohort.
CLINICAL FACTORS ASSOCIATED WITH LOW HL
Table 1 shows the demographic, psychosocial, and clinical characteristics of the study cohort measured at the time of transplant evaluation according to HL status. Sex, age, and race/ethnicity did not significantly differ according to HL status. Patients with low HL were more likely to have a HS degree or less (56.4% versus 36.7%; P = 0.005 in pairwise comparisons). Social support and neighborhood poverty level were not associated with HL (P = 0.47 and P = 0.89, respectively). Unlike literacy, neighborhood poverty level was closely linked to education attainment: for example, 63.6% of patients with a HS degree or less lived in zip codes in which ≥20% of the population was below the federal poverty level, whereas 53.1% of those with a college degree or more lived in areas with <5% below (P < 0.001 in pairwise comparisons).
TABLE 1.
Demographic and Clinical Characteristics at the Time of Transplant Evaluation of Study Cohort According to HL
| Study Cohort (n = 276) | Low HL (n = 104) | Marginal/Adequate HL (n = 172) | P Value* | |
|---|---|---|---|---|
| Sex, male | 164 (59.4) | 68 (65.4) | 96 (55.8) | 0.12 |
| Age, years | 59 (51–64) | 61 (53–65) | 58 (49–64) | 0.07 |
| Race | 0.28 | |||
| White | 199 (72.1) | 69 (66.3) | 130 (75.6) | |
| Black | 49 (17.8) | 24 (23.1) | 25 (14.5) | |
| Hispanic/Latino | 9 (3.3) | 3 (2.9) | 6 (3.5) | |
| Asian | 4 (1.4) | 3 (2.9) | 1 (0.6) | |
| Other/unknown | 15 (5.4) | 5 (4.8) | 10 (5.8) | |
| Education level | 0.005 | |||
| HS degree or less | 111 (44.1) | 53 (56.4) | 58 (36.7) | |
| Some college | 58 (23.0) | 20 (21.3) | 38 (24.1) | |
| College or more | 84 (32.9) | 21 (22.3) | 62 (39.2) | |
| Excellent/good social support† | 129 (60.9) | 48 (57.8) | 81 (62.8) | 0.47 |
| Zip code poverty‡ | 0.89 | |||
| <5% | 51 (19.8) | 20 (20.8) | 31 (19.3) | |
| 5%−9.9% | 100 (38.9) | 39 (40.6) | 61 (37.9) | |
| 10%−19.9% | 60 (23.4) | 20 (20.8) | 40 (24.8) | |
| ≥20% | 46 (17.9) | 17 (17.7) | 29 (18.0) | |
| Diagnosis | 0.01 | |||
| HCV | 97 (35.1) | 45 (43.3) | 52 (30.2) | |
| Alcohol | 70 (25.4) | 32 (30.8) | 38 (22.1) | |
| NASH | 37 (13.4) | 10 (9.6) | 27 (15.7) | |
| HBV | 5 (1.8) | 1 (1.0) | 4 (2.3) | |
| Other | 67 (24.3) | 16 (15.4) | 51 (29.7) | |
| HCC | 62 (22.5) | 26 (25.0) | 36 (20.9) | 0.43 |
| HE | 151 (54.7) | 68 (65.4) | 83 (48.3) | 0.006 |
| On chronic HE medication§ | 132 (87.4) | 61 (89.7) | 71 (85.5) | 0.44 |
| History of HE hospitalization§ | 74 (49.3) | 35 (51.5) | 39 (47.6) | 0.63 |
| Ascites | 165 (59.8) | 73 (70.2) | 92 (53.5) | 0.006 |
| Diabetes | 97 (35.1) | 35 (33.7) | 62 (36.0) | 0.69 |
| CKD | 53 (19.2) | 19 (18.3) | 34 (19.8) | 0.76 |
| Heart disease | 53 (19.2) | 22 (21.2) | 31 (18.0) | 0.52 |
| Lung disease | 30 (10.9) | 9 (8.7) | 21 (12.2) | 0.36 |
| Laboratory MELD-Na‖ | 15 (11–19) | 15 (12–20) | 15 (11–18) | 0.39 |
| BMI, kg/m2 | 28.0 (23.8–32.7) | 28.8 (24.9–32.8) | 27.2 (23.2–32.7) | 0.09 |
NOTE: Data are given as median (IQR) or n (%). Low HL is an NVS score of 0–1, and marginal/adequate HL is an NVS score of 2–6.
Comparing low HL versus marginal/adequate HL groups.
Social support data available for 214 (78%) of candidates.
Defined as percent of individuals residing below the federal poverty level in each zip code, per 2000 United States census data (n = 19 with missing poverty level data). Low HL group, n = 96; Marginal/adequate HL group, n = 161.
Among those with a history of HE at baseline only (n = 151): Low HL, n = 68; Marginal/adequate HL, n = 83.
Among non-HCC candidates.
Compared with patients with adequate HL, those with low HL were significantly more likely to have hepatitis C virus (HCV; 43.3% versus 30.2%) and alcohol-related liver disease (30.8% versus 22.1%), and less likely to have other liver disease etiologies (P = 0.01 in pairwise comparisons). Hepatic decompensations, such as HE and ascites, were significantly more prevalent among patients with low HL (65.4% [P = 0.01] and 70.2%, [P = 0.01], respectively; Table 1), regardless of whether these decompensations were controlled or uncontrolled. Specifically, among those with HE (n = 151), the severity of HE was not different according to HL status: 51.5% of patients with low HL were previously hospitalized for HE compared with 47.6% of those with adequate HL (P = 0.63).
Frailty measures according to HL status are shown in Table 2. With the exception of shrinking, low HL was associated with the other components of the Fried frailty index, such as weakness and exhaustion. For example, low grip strength was present in 48.1% of LT candidates with low HL compared with 25.6% with marginal/adequate HL (P < 0.001). Similarly, the proportion of patients meeting 3 of 3 Fried criteria in the low-HL group was double that in the marginal/adequate HL group (37.5% versus 18.6%; P = 0.001). After exclusion of patients with a history of prior HE that could have impacted the accuracy of the HL assessment (n = 151), the prevalence of patients meeting 3 of 3 Fried frailty criteria in the low HL was more than twice that seen in the marginal/adequate HL group (30.6% versus 13.5%; P = 0.03). No significant differences in nutrition were noted by HL status (P = 0.25).
TABLE 2.
Distribution of Frailty Domain Measurements According to Health Literacy Status
| Study Cohort (n = 276) | Low HL (n = 104) | Marginal/Adequate HL (n = 172) | P Value* | |
|---|---|---|---|---|
| Shrinking | ||||
| Unintentional weight loss† | 125 (45.3) | 45 (43.3) | 80 (46.5) | 0.60 |
| Weakness | ||||
| Grip strength, kg | 28.5 (22.6–37.3) | 27.7 (22–35.8) | 29.7 (23.8–38.8) | 0.09 |
| Low grip strength‡ | 94 (34.1) | 50 (48.1) | 44 (25.6) | <0.001 |
| Exhaustion | ||||
| “Everything is an effort” ≥3 days/week | 142 (51.4) | 66 (63.5) | 76 (44.2) | 0.002 |
| “Could not get going” ≥3 days/week | 89 (32.4) | 46 (44.7) | 43 (25.0) | 0.001 |
| Physical frailty assessment | ||||
| Meets ≥1 Fried criteria | 209 (75.7) | 90 (86.5) | 119 (69.2) | 0.001 |
| 3/3 of the Fried criteria | 71 (25.7) | 39 (37.5) | 32 (18.6) | 0.001 |
| Nutritional assessment | ||||
| SGA score§ | 0.25 | |||
| A | 159 (57.6) | 56 (53.8) | 103 (59.9) | |
| B‖ | 81 (29.3) | 30 (28.8) | 51 (29.7) | |
| C | 36 (13.0) | 18 (17.3) | 18 (10.5) |
NOTE: Data are given as median (IQR) or n (%). Low HL is an NVS score of 0–1, and marginal/adequate HL is an NVS score of 2–6.
Comparing low HL versus marginal/adequate HL groups.
Loss of ≥10 pounds or ≥5% of body weight in the past 12 months.
Grip strength score in lowest 20th percentile adjusted for age and BMI.
Definition: A = well-nourished or at risk for malnutrition; B = mild/moderate malnutrition; C = severe malnutrition.
Includes 1 patient scored as “B/C.”
HL AND PHYSICAL FRAILTY
The univariable (Table 3) and multivariable (Table 4) associations are given for low HL with overall physical frailty (meeting 3 of 3 Fried frailty criteria), weakness (low grip strength), and self-reported exhaustion. Accounting for socioeconomic factors and comorbidities, patients with low HL had more than 3 times the odds of having overall physical frailty, and more than twice the odds of having weakness and self-reported exhaustion compared with those with adequate HL: aORs of 3.59 (95% confidence interval [CI], 1.50–8.59; P = 0.004), 2.82 (95% CI, 1.33–5.98; P = 0.007), and 2.85 (95% CI, 1.36–6.00; P = 0.006), respectively. Interestingly, the presence of HE was independently associated with weakness (low grip strength; aOR 2.84; 95% CI, 1.28–6.32; P = 0.01) but not with other frailty components. Liver disease etiology, ascites, MELD-Na, and strong social support were not associated with frailty in multivariate models.
TABLE 3.
Univariable Analysis for the Association of Clinical Factors With Overall Physical Frailty, Weakness, and Exhaustion at the Time of LT Evaluation
| Overall Physical Frailty (n = 276)* | Weakness (n = 276)† | Exhaustion (n = 276)‡ | ||||
|---|---|---|---|---|---|---|
| OR (95% CI) | P Value | OR (95% CI) | P Value | OR (95% CI) | P Value | |
| Low HL | 2.63 (1.51–4.56) | 0.001 | 2.69 (1.61–4.51) | <0.001 | 2.19 (1.33–3.62) | 0.002 |
Binary outcome of being positive for all (3/3) versus 2 or fewer Fried frailty criteria.
Defined as having a grip strength in the lowest 20th percentile adjusted for age and BMI.
Defined as answering at least “a moderate amount of the time” to 1 of the self-reported exhaustion questions (see Methods, Frailty Assessment).
TABLE 4.
Multivariable Analysis for the Association of Clinical Factors With Overall Physical Frailty, Weakness, and Exhaustion at the Time of LT Evaluation
| Overall Physical Frailty (n = 214)* | Weakness (n = 214)† | Exhaustion (n = 214)‡ | ||||
|---|---|---|---|---|---|---|
| aOR (95% CI) | P Value | aOR (95% CI) | P Value | aOR (95% CI) | P Value | |
| Low HL | 3.59 (1.50–8.59) | 0.004 | 2.82 (1.33–5.98) | 0.007 | 2.85 (1.36–6.00) | 0.006 |
| SGA score | 0.002 | 0.03 | <0.001 | |||
| A | Reference | Reference | Reference | |||
| B | 1.38 (0.50–3.82) | 0.59 (0.24–1.48) | 4.34 (1.87–10.06) | |||
| C | 7.76 (2.48–24.34) | 2.93 (1.00–8.62) | 5.45 (1.75–16.99) | |||
| Liver disease | 0.52 | 0.18 | 0.93 | |||
| HBV/HCV | Reference | Reference | Reference | |||
| Alcohol | 2.03 (0.63–6.51) | 2.67 (1.01–7.09) | 0.97 (0.37–2.51) | |||
| NASH | 2.26 (0.60–8.49) | 1.65 (0.54–5.10) | 1.37 (0.44–4.00) | |||
| Other | 2.05 (0.65–6.45) | 2.53 (0.93–6.91) | 1.13 (0.44–2.87) | |||
| Ascites | 1.04 (0.41–2.59) | 0.94 | 0.99 (0.42–1.93) | 0.78 | 1.59 (0.77–3.28) | 0.21 |
| HE | 1.51 (0.62–3.70) | 0.37 | 2.84 (1.28–6.32) | 0.01 | 1.59 (0.77–3.26) | 0.21 |
| Laboratory MELD-Na score (per point) | 1.03 (0.96–1.11) | 0.43 | 1.01 (0.94–1.08) | 0.79 | 1.00 (0.94–1.07) | 0.89 |
| Strong social support | 0.57 (0.25–1.29) | 0.18 | 0.72 (0.35–1.48) | 0.37 | 0.78 (0.38–1.59) | 0.50 |
| Education | 0.30 | 0.14 | 0.13 | |||
| HS or less | Reference | Reference | Reference | |||
| Some college | 2.12 (0.69–6.58) | 2.52 (0.97–6.55) | 1.86 (0.75–4.61) | |||
| College or more | 1.98 (0.72–5.39) | 1.13 (0.47–2.68) | 2.34 (0.98–5.11) | |||
| Neighborhood poverty | 0.82 | 0.92 | 0.51 | |||
| <5% | Reference | Reference | Reference | |||
| 5%−9.9% | 0.78 (0.24–2.52) | 0.71 (0.26–1.93) | 1.47 (0.56–3.87) | |||
| 10%−19.9% | 1.14 (0.34–3.83) | 0.75 (0.24–2.22) | 1.95 (0.67–5.68) | |||
| ≥20% | 1.40 (0.37–5.32) | 0.76 (0.22–2.58) | 2.25 (0.70–7.24) | |||
NOTE: Covariates evaluated in the univariate analyses and not significantly associated with HL or having 3/3 score for the Fried frailty criteria included age, sex, race, CKD, lung disease, heart disease, and diabetes. BMI was not included in the multivariate model because it was not associated with HL and was collinear with low grip strength.
Binary outcome of being positive for all (3/3) versus 2 or fewer Fried frailty criteria.
Defined as having a grip strength in the lowest 20th percentile adjusted for age and BMI.
Defined as answering at least “a moderate amount of the time” to 1 of the self-reported exhaustion questions (see Methods, Frailty Assessment).
ASSOCIATION OF HL AND PATIENT OUTCOMES
Figure 2 depicts associations between HL categories (low, marginal, and adequate) and patient outcomes. There was a stepwise increase in the proportion of patients whose LT evaluations were closed with decreasing HL: 35.4% with adequate HL, 43.8% with marginal HL, and 61.5% with low HL (P = 0.001). Similarly, lower HL scores were significantly associated with reduced wait-listing and LT (P = 0.01 and P = 0.005, respectively). Among the patients evaluated without preexisting HE (n = 125), low HL was also associated with a lower prevalence of wait-listing (50.0% versus 68.5% marginal/adequate HL; P = 0.05), and a numerically but not statistically lower rate of LT (36.1% versus 50.6%; P = 0.14). Although not statistically significant, the proportion of patients overall who died or became too sick for LT was also observed to increase with decreasing HL scores: 13.1% with adequate HL, 17.8% with marginal HL, and 25.0% with low HL (P = 0.09). Similar trends were also noted among those without preexisting HE: 19.4% for low HL versus 10.1% for marginal/adequate HL (P = 0.16). Of the 49 confirmed pre-LT deaths, the most frequent causes were complications of ESLD (42.9%), infection (18.4%), and malignancy (16.3%; hepatocellular carcinoma [HCC], n = 6; cholangiocarcinoma, n = 1; and squamous cell carcinoma, n = 1). There was no statistical difference in pre-LT cause of death according to HL (P = 0.20), though patients with low HL were numerically more likely to die of infection (24.0% versus 12.5% for marginal/adequate HL) or cardiac causes (12.0% versus 4.2%), and less likely to die of malignancy (4.0% versus 29.2%).
FIG. 2.
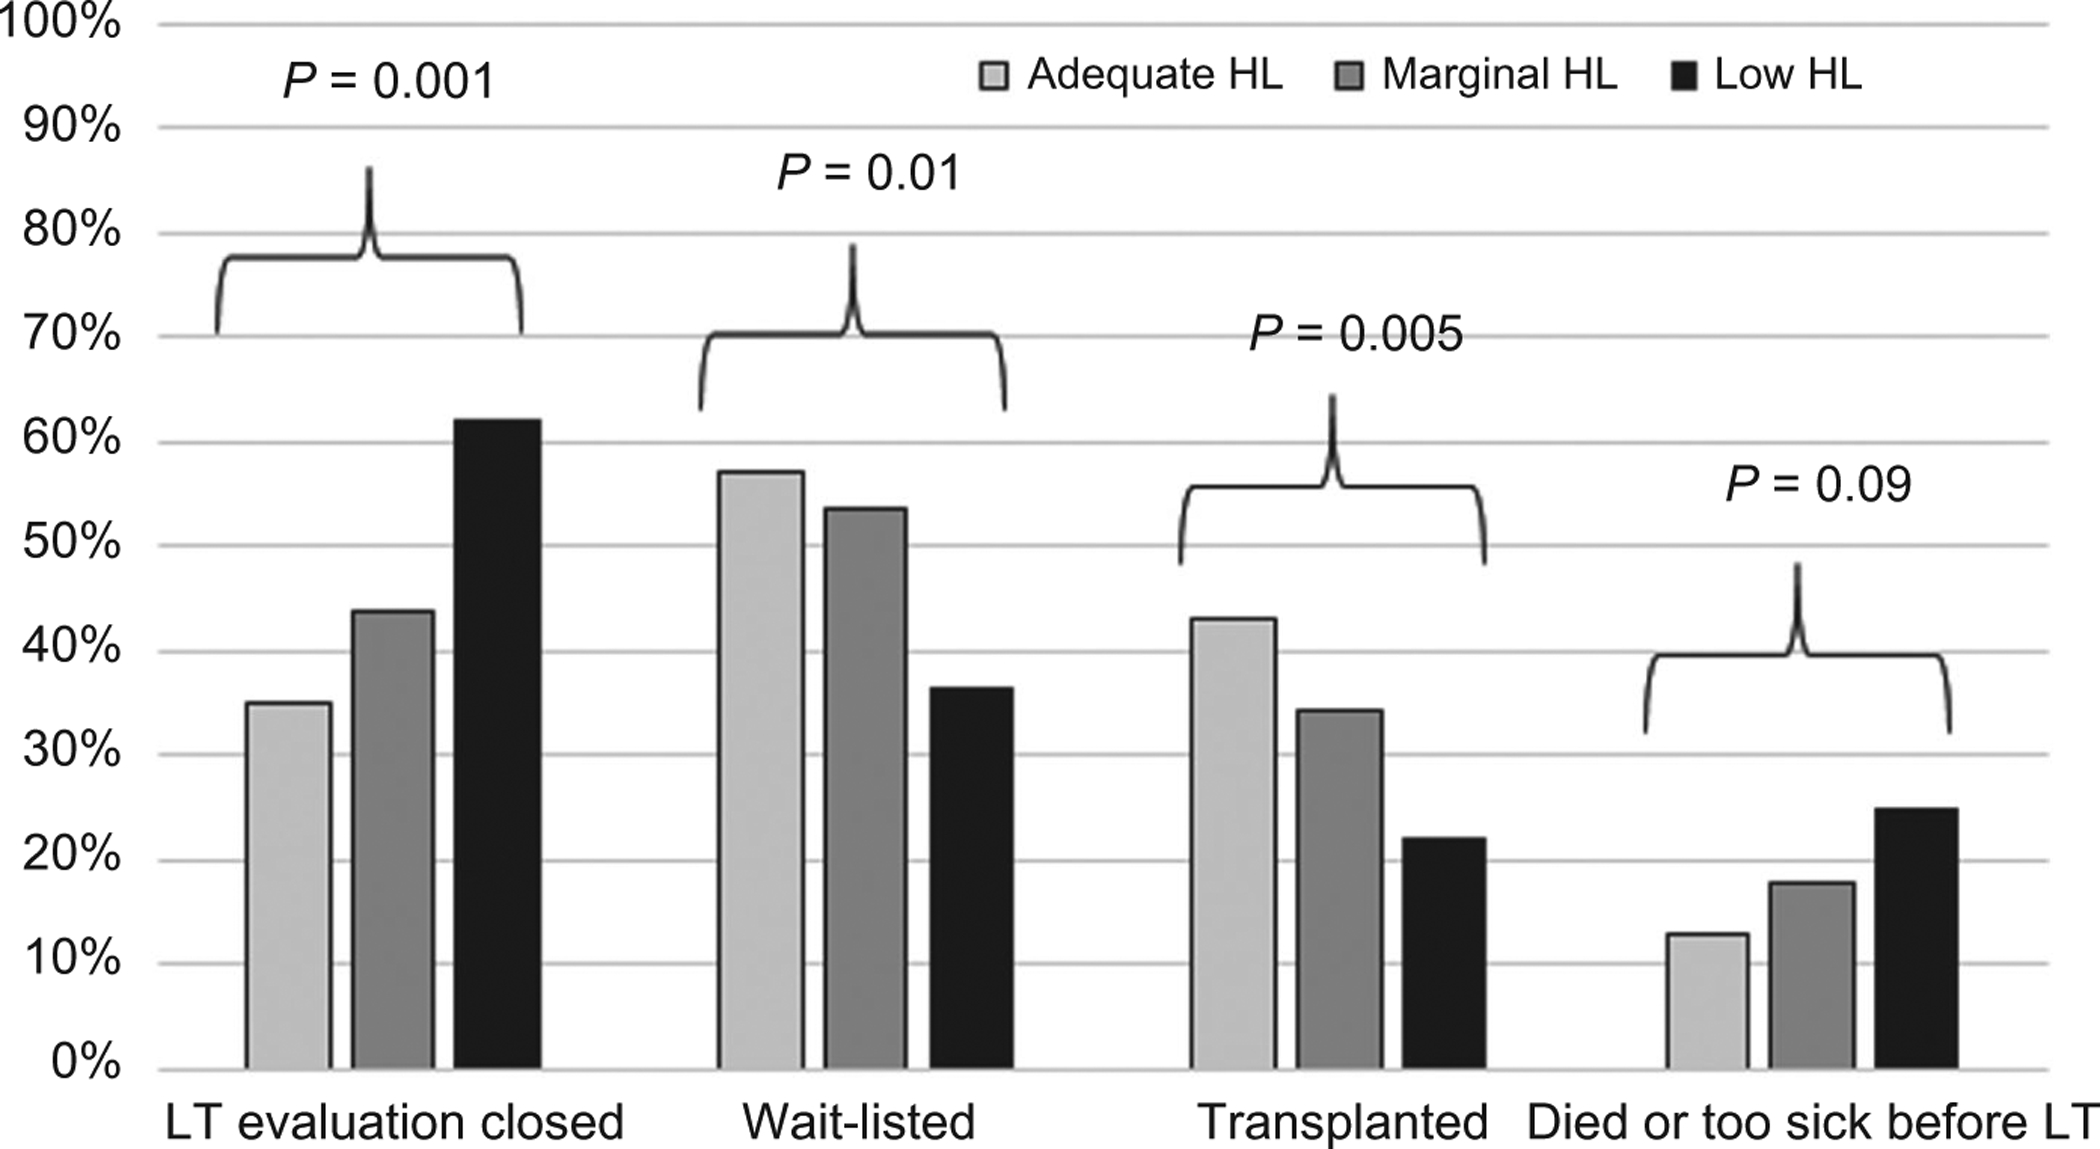
Patient outcomes after transplant evaluation visit by HL group (n = 276).
Overall, median follow-up time after LT was 2.8 years (IQR, 2.1–3.4 years). During this time, 7 post-LT deaths were observed after a median of 175 days (IQR, 31–503 days). There were significantly more posttransplant deaths in the low-HL group compared with the marginal/adequate low-HL group: 17.4% (n = 4/23) versus 4.4% (n = 3/68; P = 0.04). None of the deaths in either group were the result of allograft failure, and there were no trends in the post-LT cause of death according to HL status. Post-LT deaths in the low-HL group resulted from posttransplant lymphoproliferative disorder, recurrent HCC, infection and stroke, while those in the marginal/adequate HL group were attributed to cardiac arrest, infection, gastrointestinal bleeding, and unknown causes.
ASSOCIATION BETWEEN HL AND NOT BEING WAIT-LISTED FOR LT
In the univariate analyses, low HL was significantly associated with the odds of not being wait-listed for LT (OR, 2.14; 95% CI, 1.30–3.53; P = 0.003). The results of 2 multivariate models evaluating the association of low HL and not being wait-listed for LT are shown in Table 5. Model 1 demonstrates the significant association between HL and not being wait-listed for LT, adjusted for medical comorbidities and socioeconomic factors, with aOR 1.96 (95% CI, 1.03–3.75; P = 0.04). However, when social support was included post hoc in model 2 to investigate the potential mechanism of this relationship, the association between low HL and not being wait-listed was attenuated and no longer statistically significant (aOR, 1.58; 95% CI, 0.74–3.36; P = 0.24). Notably, social support was not an independent predictor of the outcome in the adjusted multivariate model (P = 0.14). In both multivariate analyses, physical frailty according to the Fried frailty criteria was a significant predictor of not being wait-listed, though it was a weaker predictor when social support was also accounted for: model 1, aOR, 0.43; 95% CI, 0.20–0.90; P = 0.03; and model 2, 0.42, 95% CI, 0.18–0.99; P = 0.049. HE was additionally observed to be associated with an increased odds of not being wait-listed in both models: aOR of 3.41 (95% CI, 1.78–6.54; P < 0.001) in model 1 and aOR of 4.83 (95% CI, 2.24–10.43; P < 0.001) in model 2.
TABLE 5.
Multivariate Associations Between Low HL and Not Being Wait-Listed for LT
| Model 1 (n = 276)* | Model 2 (n = 185)† | |||
|---|---|---|---|---|
| aOR (95% CI) | P Value | aOR (95% CI) | P Value | |
| Low HL | 1.96 (1.03–3.75) | 0.04 | 1.58 (0.74–3.36) | 0.24 |
| Strong social support | — | — | 0.59 (0.29–1.20) | 0.14 |
| Liver disease | 0.08 | 0.18 | ||
| HBV/HCV | Reference | Reference | ||
| Alcohol | 2.75 (1.18–6.40) | 2.61 (0.94–7.21) | ||
| NASH | 2.49 (0.96–6.49) | 2.59 (0.86–7.82) | ||
| Other | 1.79 (0.75–4.30) | 1.66 (0.62–4.46) | ||
| HE | 3.41 (1.78–6.54) | <0.001 | 4.83 (2.24–10.43) | <0.001 |
| Ascites | 0.99 (0.52–1.88) | 0.97 | 0.82 (0.39–7.82) | 0.61 |
| Diabetes | 2.02 (1.04–3.92) | 0.04 | 2.06 (0.96–4.43) | 0.06 |
| Age (per year) | 1.01 (0.98–1.03) | 0.73 | 1.00 (0.97–1.04) | 0.91 |
| BMI (per kg/m2) | 1.01 (0.97–1.06) | 0.62 | 1.03 (0.98–1.04) | 0.29 |
| 3/3 Fried criteria positive | 0.43 (0.20–0.90) | 0.03 | 0.42 (0.18–0.99) | 0.049 |
| Education | 0.08 | 0.11 | ||
| HS or less | Reference | Reference | ||
| Some college | 0.53 (0.24–1.12) | 0.62 (0.25–1.51) | ||
| College or more | 0.48 (0.23–0.98) | 0.41 (0.17–0.94) | ||
| Neighborhood poverty | 0.12 | 0.07 | ||
| <5% | Reference | Reference | ||
| 5%−9.9% | 0.52 (0.23–1.16) | 0.39 (0.15–1.01) | ||
| 10%-l 9.9% | 0.94 (0.37–2.36) | 0.73 (0.26–2.07) | ||
| ≥20% | 2.26 (0.85–5.97) | 1.39 (0.44–4.43) | ||
NOTE: Covariates evaluated in the univariate analyses and not significantly associated with HL or not being listed for LT included age, sex, MELD-Na score, CKD, lung disease, and heart disease.
Model 1 is adjusted for HL, socioeconomic factors, and comorbidities.
Model 2 is adjusted for HL, socioeconomic factors, comorbidities, and social support.
ASSOCIATION BETWEEN HL AND DYING OR BECOMING TOO SICK FOR LT
Given that most of the deaths occurred prior to LT, the association between HL status and dying or becoming too sick for LT was evaluated with LT as a competing risk. In the unadjusted analyses, low HL compared with marginal/adequate HL was associated with a higher likelihood of having the adverse outcome (SHR, 1.85; 95% CI, 1.08–3.17; P = 0.03). In the unadjusted analyses, the following covariates were also significant predictors of dying or becoming too sick for LT: HE (SHR, 2.61; 95% CI, 1.48–4.61; P = 0.001), ascites (SHR, 1.99; 95% CI, 1.11–3.57; P = 0.02), having 3/3 of the Fried frailty criteria (SHR, 1.78; 95% CI, 1.02–3.13; P = 0.043) and heart disease (SHR, 2.43; 95% CI, 1.35–4.37; P = 0.003). In the multivariate analyses, HE (SHR, 2.08; 95% CI, 1.16–3.75; P = 0.01), and heart disease (SHR, 2.56; 95% CI, 1.40–4.68; P = 0.002) were the only factors associated with dying or becoming too sick for LT. Low HL was not a significant predictor of the outcome (SHR, 1.50; 95% CI, 0.86–2.64; P = 0.16).
Discussion
Over the last decade, a sizeable body of literature has elucidated multiple factors that predict pretransplant and posttransplant clinical outcomes and health-related quality of life beyond the MELD score such as frailty, sarcopenia, and HE.(1,4) However, comparatively little attention has been paid to the important psychosocial determinants governing patients’ access to health care or their ability to navigate complex health care systems and multidrug regimens. In this study, we investigated the impact of HL, a key component of effective self-care and disease self-management shown to affect clinical outcomes in diverse health care settings.(10) After 3 years of longitudinal follow-up, we showed that inadequate HL was present in one-third of patients with ESLD undergoing LT evaluation. Moreover, patients with low HL were more than 3 times as likely to have advanced physical frailty, independent of the presence of HE, liver disease severity, educational attainment or other socioeconomic factors, such as neighborhood poverty level.
In this study, patients with low HL were less likely to be wait-listed for LT despite having a greater prevalence of HE, ascites, and similar MELD scores as the adequate HL group. This association was independent of educational attainment or socioeconomic factors. However, when social support was accounted for, the relationship between HL and not being wait-listed was no longer observed, potentially providing a mechanism for this association, and highlights the essential role of caregivers throughout the wait-listing process. From the patient perspective, understanding the transplant evaluation process is inherently complex, and there is mounting evidence in other clinical contexts that low HL is associated with difficulties in navigating health care systems and processes of care.(10) Prior research has also indicated that transplant-related materials are frequently difficult to comprehend and not tailored to patients with lower literacy levels.(28,29) Future studies should investigate caregiver involvement and caregiver HL as viable means to address these issues. Additionally, patient support and navigation strategies using caregivers, transplant center staff (eg, social workers), and even peers, such as past transplant recipients, may help overcome barriers to health care access and transplant wait-listing.(30)
The results from our study highlight the concept that assessment of HL provides important information distinct from educational level, socioeconomic factors, and HE-related cognitive changes. Moreover, HL also appears to be more strongly associated with frailty and wait-listing in the ESLD population than education and socioeconomic factors. Supporting this finding is an expanse of prospective studies concluding that HL is consistently a stronger determinant of health outcomes compared with educational attainment.(10,31) Therefore, there is a strong case to routinely assess HL at the point of care among patients with ESLD similar to the well-established disease severity, frailty indices, and psychosocial factors. The NVS literacy measure employed in this study is one of the most widely used assessments, is free and publicly available, takes 2–3 minutes to administer, and has been validated in English and Spanish.(22) The NVS tool assesses not only reading and numeracy but also the ability to use information to make health-related decisions.(32) This latter skill set cannot be reliably ascertained from educational attainment alone.(33)
The practical implication of routinely assessing HL is the ability to identify at-risk patients, whom prior studies have shown are not readily identifiable by clinicians due to stigma, are not likely to self-identify, and, consequently, may misunderstand medical advice and struggle to adhere to treatment or to make informed health care decisions. Therefore, screening for HL in the transplant setting would allow for additional resources or possibly even time to be allocated to support these more vulnerable patients to engage in their care, undergo LT, and ultimately thrive thereafter. Figure 3 depicts a proposed conceptual framework of the relationships between sociodemographics, psychosocial factors, cognitive function, and HL and how these may affect access to health care and LT, interactions with medical providers, and self-care behaviors, such as medication adherence, seeking preventive care, and abstinence from drugs and alcohol. Although the precise causal relationships have not been elucidated and continue to be the subject of social and behavioral research, they plausibly influence health care use and health outcomes in ESLD patients.(34)
FIG. 3.
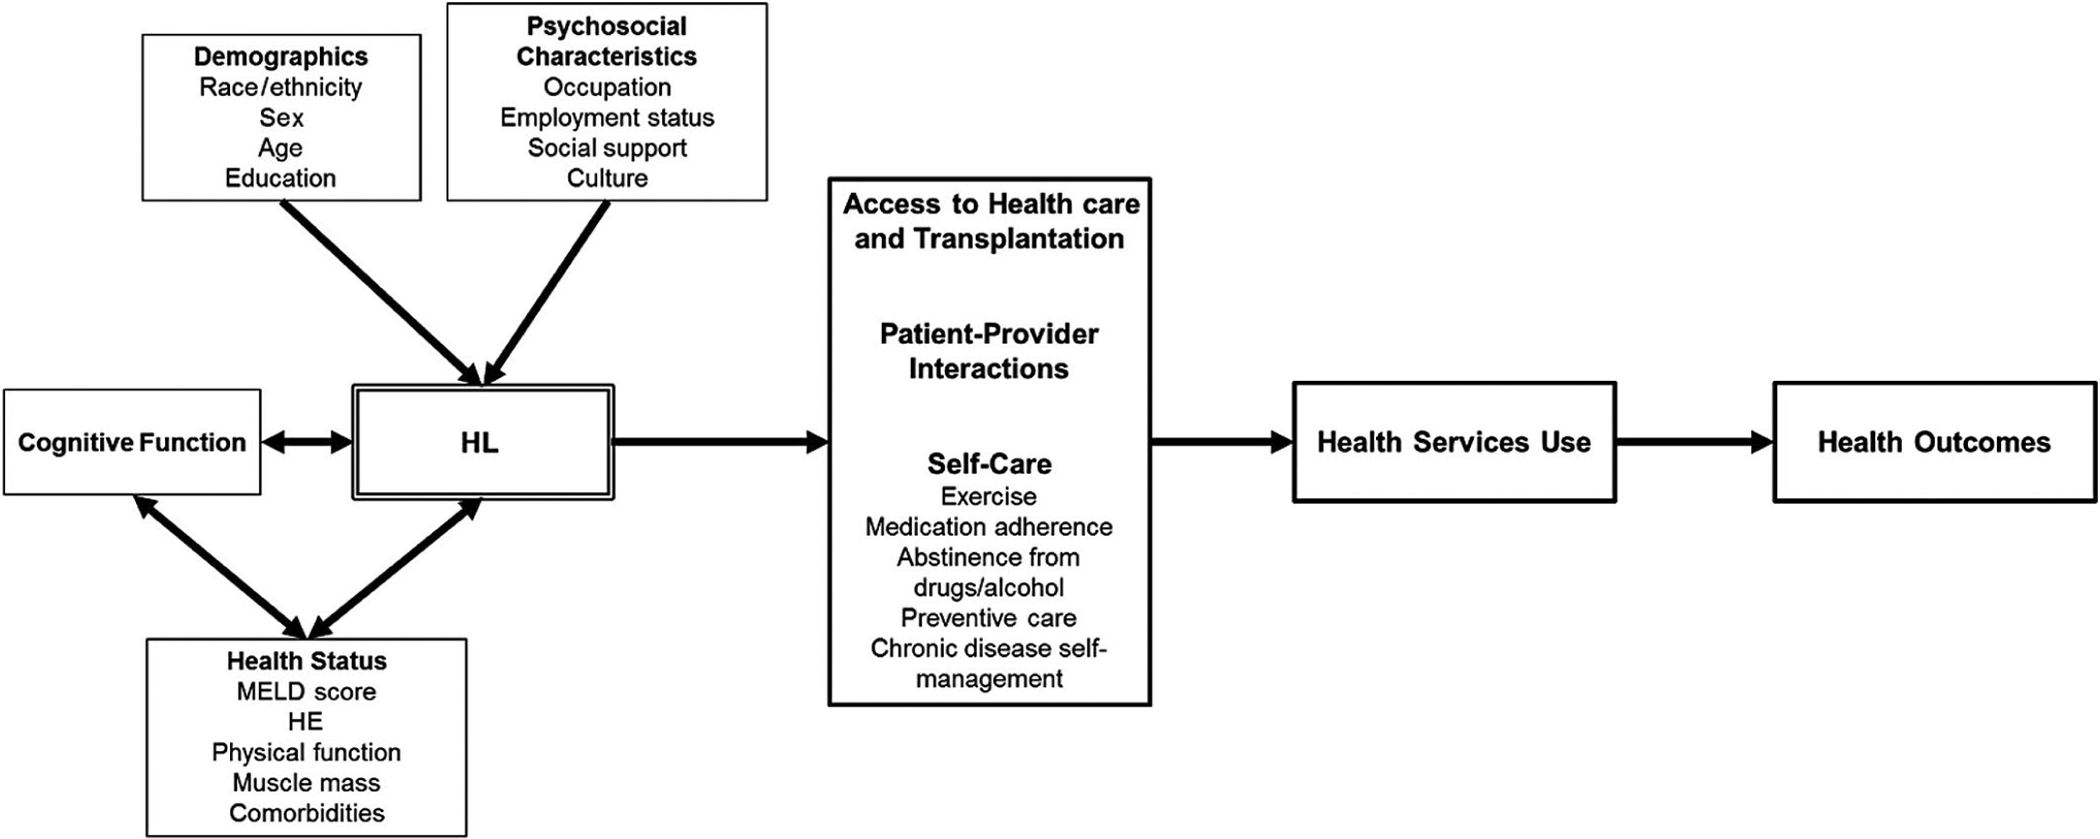
Proposed conceptual model linking HL to outcomes in LT.
HL has long been recognized and prioritized beyond the transplant setting. A “National Action Plan to Improve Health Literacy” has been set forth by the US Department of Health and Human Services as part of its “Healthy People 2020” initiative, and there is evidence that HL is a modifiable construct through the implementation of both health system level and community-based interventions.(35–37) Moreover, the National Academy of Medicine has called on health care organizations and policy makers to recognize HL as an essential component of high-quality health care services.(38) Multiple resources, such as the Centers for Disease Control and Prevention’s Clear Communication Index(39) and the Agency for Healthcare Research and Quality Health Literacy Universal Precautions Toolkit, are available for medical centers to measure and subsequently tailor the HL of educational materials, improve patient communication, and reduce health care complexity.(40) These national initiatives and directives have not been routinely incorporated into the day-to-day management or wait-listing of ESLD patients thereby highlighting the need to focus on HL in future research.
There are certain limitations that we need to acknowledge. First, this was a single-center study measuring HL at one point in time, although our cohort is ethnically and sociodemographically diverse. Moreover, although modifiable through interventions, it should be noted that HL is believed to be otherwise stable throughout much of adulthood.(41,42) Our patients had a lower prevalence of Medicaid insurance and higher educational attainment than the national average possibly limiting the generalizability of our findings. However, we may also be underestimating the prevalence of low HL among wait-listed candidates nationally. Prior studies have demonstrated that HL is particularly important among patients with low educational attainment.(11,15) Thus, our results may, in fact, be more relevant at other centers across the United States.
Despite identifying associations between HL, physical frailty, and LT wait-listing, we fully acknowledge the inability to assess causation or directionality among these interrelated components. This will require prospective investigations with repeat measurements before and after LT. Moreover, the relationship between low HL, social support, and wait-list outcomes should be further investigated using a larger cohort that would permit more granular subgroup analyses. Although we adjusted for HE, it was assessed by clinical history during the evaluation visit; therefore, subclinical HE was potentially missed. Future studies should investigate whether optimization of HE would improve HL and self-care. This study was not powered to assess post-LT outcomes, and future efforts with longer post-LT follow-up and serial HL assessment will need to be conducted. Identifying the patients in whom inadequate HL before LT persists after LT would allow for the creation of interventions specifically focused on medication adherence and other aspects of self-care associated with optimal longterm outcomes.(16) Lastly, only 3 of the 5 components of the Fried frailty index were measured due to practical considerations in transplant clinic and time limitations, though grip strength is a validated predictor of frailty on its own.(17) Future research should investigate how the Liver Frailty Index is associated with HL and outcomes.(43)
In conclusion, low HL was highly prevalent and associated with increased physical frailty and lower likelihood LT wait-listing in ESLD independent of HE, educational attainment, and other clinical and socioeconomic factors. Future studies should investigate whether routine HL assessments and tailored interventions may improve access to care and self-care, physical frailty, and health outcomes in this population.
Supplementary Material
Acknowledgments
Therese Bittermann receives research grant funding from the National Institute of Diabetes and Digestive and Kidney Diseases (1-K08-DK117013-01). Marina Serper is supported by an award from the National Institute of Diabetes and Digestive and Kidney Diseases (1-K23-DK115897-01).
Abbreviations:
- aOR
adjusted odds ratio
- BMI
body mass index
- CI
confidence interval
- CKD
chronic kidney disease
- EHR
electronic health record
- ESLD
end-stage liver disease
- HBV
hepatitis B virus
- HCC
hepatocellular carcinoma
- HCV
hepatitis C virus
- HE
hepatic encephalopathy
- HL
health literacy
- HS
high school
- IQR
interquartile range
- LT
liver transplantation
- MELD
Model for End-Stage Liver Disease
- MELD-Na
Model for End-Stage Liver Disease–sodium
- NASH
nonalcoholic steatohepatitis
- NVS
Newest Vital Sign
- OR
odds ratio
- SGA
Subjective Global Assessment
- SHR
subhazard ratio
- SIPAT
Stanford Integrated Psychosocial Assessment for Transplantation
- UNOS
United Network for Organ Sharing
Footnotes
Additional supporting information may be found in the online version of this article.
Potential conflict of interest: Nothing to report.
REFERENCES
- 1).Lai JC, Feng S, Terrault NA, Lizaola B, Hayssen H, Covinsky K. Frailty predicts waitlist mortality in liver transplant candidates. Am J Transplant 2014;14:1870–1879. [DOI] [PMC free article] [PubMed] [Google Scholar]
- 2).Dunn MA, Josbeno DA, Tevar AD, Rachakonda V, Ganesh SR, Schmotzer AR, et al. Frailty as tested by gait speed is an independent risk factor for cirrhosis complications that require hospitalization. Am J Gastroenterol 2016;111:1768–1775. [DOI] [PubMed] [Google Scholar]
- 3).Lai JC, Sonnenday CJ, Tapper EB, Duarte-Rojo A, Dunn MA, Bernal W, et al. Frailty in liver transplantation: an expert opinion statement from the American Society of Transplantation Liver and Intestinal Community of Practice. Am J Transplant 2019;19:1896–1906. [DOI] [PMC free article] [PubMed] [Google Scholar]
- 4).Tapper EB, Baki J, Parikh ND, Lok AS. Frailty, psychoactive medications, and cognitive dysfunction are associated with poor patient-reported outcomes in cirrhosis. Hepatology 2019;69: 1676–1685. [DOI] [PMC free article] [PubMed] [Google Scholar]
- 5).Ney M, Tangri N, Dobbs B, Bajaj J, Rolfson D, Ma M, et al. Predicting hepatic encephalopathy-related hospitalizations using a composite assessment of cognitive impairment and frailty in 355 patients with cirrhosis. Am J Gastroenterol 2018;113:1506–1515. [DOI] [PubMed] [Google Scholar]
- 6).Arai H, Satake S, Kozaki K. Cognitive frailty in geriatrics. Clin Geriatr Med 2018;34:667–675. [DOI] [PubMed] [Google Scholar]
- 7).Robertson DA, Savva GM, Kenny RA. Frailty and cognitive impairment—a review of the evidence and causal mechanisms. Ageing Res Rev 2013;12:840–851. [DOI] [PubMed] [Google Scholar]
- 8).De Roeck EE, Dury S, De Witte N, De Donder L, Bjerke M, De Deyn PP, et al. CFAI-Plus: adding cognitive frailty as a new domain to the comprehensive frailty assessment instrument. Int J Geriatr Psychiatry 2018;33:941–947. [DOI] [PubMed] [Google Scholar]
- 9).Aprahamian I, Suemoto CK, Aliberti MJR, de Queiroz Fortes Filho S, de Araújo Melo J, Lin SM, Filho WJ. Frailty and cognitive status evaluation can better predict mortality in older adults? Arch Gerontol Geriatr 2018;77:51–56. [DOI] [PubMed] [Google Scholar]
- 10).Berkman ND, Sheridan SL, Donahue KE, Halpern DJ, Crotty K. Low health literacy and health outcomes: an updated systematic review. Ann Intern Med 2011;155:97–107. [DOI] [PubMed] [Google Scholar]
- 11).Rademakers J, Heijmans M. Beyond reading and understanding: health literacy as the capacity to act. Int J Environ Res Public Health. 2018;15:1676. [DOI] [PMC free article] [PubMed] [Google Scholar]
- 12).van der Heide I, Wang J, Droomers M, Spreeuwenberg P, Rademakers J, Uiters E. The relationship between health, education, and health literacy: results from the Dutch Adult Literacy and Life Skills Survey. J Health Commun 2013;18(suppl 1):172–184. [DOI] [PMC free article] [PubMed] [Google Scholar]
- 13).Huang CH, Lay YC, Lee YC, Teong XT, Kuzuya M, Kuo KM. Impact of health literacy on frailty among community-dwelling seniors. J Clin Med 2018;7:481. [DOI] [PMC free article] [PubMed] [Google Scholar]
- 14).Shirooka H, Nishiguchi S, Fukutani N, Adachi D, Tashiro Y, Hotta T, et al. Association between comprehensive health literacy and frailty level in community dwelling older adults: a cross-sectional study in Japan. Geriatr Gerontol Int 2017;17:804–809. [DOI] [PubMed] [Google Scholar]
- 15).Hibbard JH, Peters E, Dixon A, Tusler M. Consumer competencies and the use of comparative quality information: it isn’t just about literacy. Med Care Res Rev 2007;64:379–394. [DOI] [PubMed] [Google Scholar]
- 16).Serper M, Patzer RE, Reese PP, Przytula K, Koval R, Ladner DP, et al. Medication misuse, nonadherence, and clinical outcomes among liver transplant recipients. Liver Transpl 2015;21:22–28. [DOI] [PMC free article] [PubMed] [Google Scholar]
- 17).Tandon P, Low G, Mourtzakis M, Zenith L, Myers RP, Abraldes JG, et al. A model to identify sarcopenia in patients with cirrhosis. Clin Gastroenterol Hepatol 2016;14:1473–1480. [DOI] [PubMed] [Google Scholar]
- 18).Fried LP, Tangen CM, Walston J, Newman AB, Hirsch C, Gottdiener J, et al. Frailty in older adults: evidence for a phenotype. J Gerontol A Biol Sci Med Sci 2001;56:M146–M57. [DOI] [PubMed] [Google Scholar]
- 19).Gabrielson DK, Scaffidi D, Leung E, Stoyanoff L, Robinson J, Nisenbaum R, et al. Use of an abridged scored Patient-Generated Subjective Global Assessment (abPG-SGA) as a nutritional screening tool for cancer patients in an outpatient setting. Nutr Cancer 2013;65:234–239. [DOI] [PubMed] [Google Scholar]
- 20).da Silva Fink J, Daniel de Mello P, Daniel de Mello E. Subjective global assessment of nutritional status—a systematic review of the literature. Clin Nutr 2015;34:785–792. [DOI] [PubMed] [Google Scholar]
- 21).Chiu E, Marr K, Taylor L, Lam L, Stapleton M, Tandon P, Raman M. Malnutrition impacts health-related quality of life in cirrhosis: a cross-sectional study. Nutr Clin Pract 2020;35:119–125. [DOI] [PubMed] [Google Scholar]
- 22).Weiss BD, Mays MZ, Martz W, Castro KM, DeWalt DA, Pignone MP, et al. Quick assessment of literacy in primary care: the newest vital sign. Ann Fam Med 2005;3:514–522. [DOI] [PMC free article] [PubMed] [Google Scholar]
- 23).Hjorth M, Sjöberg D, Svanberg A, Kaminsky E, Langenskiöld S, Rorsman F. Nurse-led clinic for patients with liver cirrhosis—effects on health-related quality of life: study protocol of a pragmatic multi-center randomised controlled trial. BMJ Open 2018;8:e023064. [DOI] [PMC free article] [PubMed] [Google Scholar]
- 24).Escobedo W, Weismuller P. Assessing health literacy in renal failure and kidney transplant patients. Prog Transplant 2013;23:47–54. [DOI] [PubMed] [Google Scholar]
- 25).Maldonado JR, Dubois HC, David EE, Sher Y, Lolak S, Dyal J, Witten D. Integrated Psychosocial Assessment for Transplantation (SIPAT): a new tool for the psychosocial evaluation of pretransplant candidates. Psychosomatics 2012;53:123–132. [DOI] [PubMed] [Google Scholar]
- 26).Lee SYD, Arozullah AM, Cho YI. Health literacy, social support, and health: a research agenda. Soc Sci Med 2004;58:1309–1321. [DOI] [PubMed] [Google Scholar]
- 27).Bittermann T, Makar G, Goldberg D. Exception point applications for 15 points: an unintended consequence of the Share 15 policy. Liver Transpl 2012;18:1302–1309. [DOI] [PMC free article] [PubMed] [Google Scholar]
- 28).Gordon EJ, Bergeron A, McNatt G, Friedewald J, Abecassis MM, Wolf MS. Are informed consent forms for organ transplantation and donation too difficult to read? Clin Transplant 2012;26:275–283. [DOI] [PubMed] [Google Scholar]
- 29).Rodrigue JR, Feranil M, Lang J, Fleischman A. Readability, content analysis, and racial/ethnic diversity of online living kidney donation information. Clin Transplant 2017;31:e13039. [DOI] [PMC free article] [PubMed] [Google Scholar]
- 30).Patzer RE, Larsen CP. Patient navigators in transplantation-where do we go from here? Transplantation 2019;103:1076–1077. [DOI] [PubMed] [Google Scholar]
- 31).Wolf MS, Gazmararian JA, Baker DW. Health literacy and functional health status among older adults. Arch Intern Med 2005;165:1946–1952. [DOI] [PubMed] [Google Scholar]
- 32).Pfizer Health Literacy. Newest Vital Sign Toolkit: “Why an Ice Cream Label Works as a Predictor of Health Literacy”; 2011. https://pfe-pfizercom-prod.s3.amazonaws.com/health/2016_nvs_flipbook_english_final.pdf. Accessed May 8, 2020.
- 33).Rothman RL, Housam R, Weiss H, Davis D, Gregory R, Gebretsadik T, et al. Patient understanding of food labels: the role of literacy and numeracy. Am J Prev Med 2006;31:391–398. [DOI] [PubMed] [Google Scholar]
- 34).Paasche-Orlow MK, Wolf MS. The causal pathways linking health literacy to health outcomes. Am J Health Behav 2007;31(suppl 1):19–26. [DOI] [PubMed] [Google Scholar]
- 35).U.S. Department of Health and Human Services, Office of Disease Prevention and Health Promotion. National Action Plan to Improve Health Literacy 2010. https://health.gov/our-work/health-literacy/national-action-plan-improve-health-literacy. Accessed April 15, 2020.
- 36).Dunn P, Conard S. Improving health literacy in patients with chronic conditions: a call to action. Int J Cardiol 2018;273:249–251. [DOI] [PubMed] [Google Scholar]
- 37).Edwards M, Wood F, Davies M, Edwards A. The development of health literacy in patients with a long-term health condition: the health literacy pathway model. BMC Public Health 2012;12:130. [DOI] [PMC free article] [PubMed] [Google Scholar]
- 38).Institute of Medicine (US) Committee on Health Literacy, In: Nielsen-Bohlman L, Panzer AM, Kindig DA, Ed. Health literacy: a prescription to end confusion. Washington, DC: National Academy of Sciences; 2004. https://www.ncbi.nlm.nih.gov/books/NBK216032/. Accessed July 13, 2020. [PubMed] [Google Scholar]
- 39).Bruix J, Sherman M; for Practice Guidelines Committee, American Association for the Study of Liver Diseases. Management of hepatocellular carcinoma. Hepatology 2005;42:1208–1236. [DOI] [PubMed] [Google Scholar]
- 40).Goldberg DS, French B, Abt P, Feng S, Cameron AM. Increasing disparity in waitlist mortality rates with increased model for end-stage liver disease scores for candidates with hepatocellular carcinoma versus candidates without hepatocellular carcinoma. Liver Transpl 2012;18:434–443. [DOI] [PMC free article] [PubMed] [Google Scholar]
- 41).Kobayashi LC, Wardle J, Wolf MS, von Wagner C. Cognitive function and health literacy decline in a cohort of aging English adults. J Gen Int Med 2015;30:958–964. [DOI] [PMC free article] [PubMed] [Google Scholar]
- 42).Murray C, Johnson W, Wolf MS, Deary IJ. The association between cognitive ability across the lifespan and health literacy in old age: the Lothian Birth Cohort 1936. Intelligence 2011;39:178–187. [Google Scholar]
- 43).Lai JC, Covinsky KE, Dodge JL, Boscardin WJ, Segev DL, Roberts JP, Feng S. Development of a novel frailty index to predict mortality in patients with end-stage liver disease. Hepatology 2017;66:564–574. [DOI] [PMC free article] [PubMed] [Google Scholar]
Associated Data
This section collects any data citations, data availability statements, or supplementary materials included in this article.