

Visual Abstract

Keywords: Chronic Kidney Disease, biomarkers, C-reactive protein, chronic kidney disease, depression, major depressive disorder, fatigue, high-sensitivity C-reactive protein, inflammation, interleukin-6, medically unexplained symptoms, quality of life, Sertraline
Abstract
Background
Inflammatory biomarkers are elevated in patients with CKD and associated with poor outcomes. Major depressive disorder (MDD) is prevalent in CKD and associated with inflammation. No studies investigated the effect of MDD treatment on plasma inflammatory biomarkers in patients with nondialysis CKD.
Methods
In a prespecified analysis of the randomized, double-blind CKD Antidepressant Sertraline Trial, we investigated whether treatment with sertraline versus placebo or response to treatment would affect plasma levels of albumin, prealbumin, IL-6, and high-sensitivity C-reactive protein (hsCRP), measured at baseline and after 12 weeks of treatment. We also explored whether somatic versus nonsomatic depressive symptoms, measured using the Quick Inventory of Depressive Symptomatology, and quality-of-life subscales, measured using the Kidney Disease Quality of Life Short Form, were associated with baseline levels of these inflammatory biomarkers.
Results
Of the 193 participants, mean age was 58.4 (SD 13) years and 58% were black, 42% were white, and 18% were Hispanic. Higher baseline hsCRP correlated with somatic depressive symptoms (r=0.21; P=0.01), fatigue (r=0.22; P=0.005), and poorer physical functioning (r=−0.26; P=0.001). There was no change in hsCRP in the sertraline group. hsCRP increased in placebo nonresponders from baseline (median, 3.7 mg/L; interquartile range [IQR], 1.7–10.0 mg/L) to exit (median, 4.9 mg/L; IQR, 1.8–8.8 mg/L; P=0.01). The change from baseline to exit differed between placebo responders (median, −0.4 mg/L; IQR, −9.3 to 0.2 mg/L) and nonresponders (median, 0.8 mg/L; IQR, −0.1 to 3.9 mg/L; P=0.008). There were no differences in changes in albumin, prealbumin, or IL-6 from baseline in any group.
Conclusions
Among patients with CKD and MDD, hsCRP correlated with somatic symptoms of depression and fatigue, but not with nonsomatic symptoms. Sertraline treatment was not associated with a longitudinal change in hsCRP from baseline regardless of treatment effect on depressive symptoms, but those who failed to respond to placebo had an increase in hsCRP over time. This area deserves further investigation.
Clinical Trial registry name and registration number:
CKD Antidepressant Sertraline Trial (CAST), NCT00946998.
Introduction
Major depressive disorder (MDD) is prevalent in approximately 20% of individuals with CKD, a rate disproportionately higher than in the general population, and is associated with death, cardiovascular events, hospitalization, and dialysis initiation (1–5). The CKD Antidepressant Sertraline Trial (CAST) demonstrated that treatment of MDD with sertraline versus placebo for 12 weeks was not associated with an improvement in depressive symptoms, but did cause greater gastrointestinal side effects in individuals with CKD stages 3–5 (6). This trial added to a growing literature base demonstrating a lack of efficacy of selective serotonin reuptake inhibitors (SSRIs) in individuals with comorbid medical illnesses such as heart failure, acute coronary syndrome, and asthma (7–10).
It has been postulated that chronic inflammation associated with CKD and other chronic diseases may mediate comorbid MDD, the association of MDD with long-term adverse outcomes, and resistance to treatment with first-line antidepressant medications that were shown to be effective in the general population (1,11). One study in 28 patients with ESKD treated with chronic hemodialysis reported that lower plasma IL-6 at the time of fluoxetine initiation for treatment of depression was associated with improvement in depressive symptoms (12). However, in the general population, elevation of plasma levels of the inflammatory biomarker IL-17 was associated with improvement in depression symptom severity after combined antidepressant treatment with bupropion and SSRIs (13). These data raise the question of whether treatment with sertraline versus placebo affects inflammatory biomarkers, and whether those effects associate with treatment response. Prior studies of this question in patients with ESKD on hemodialysis or peritoneal dialysis presented variable results, but were limited by small sample sizes, short antidepressant treatment duration, or inadequate SSRI dose (12,14–18). None have addressed this question in patients with nondialysis CKD.
The first aim of this prespecified secondary analysis of CAST was to determine associations of plasma inflammatory biomarkers with depression severity, somatic versus nonsomatic symptoms of depression, and quality of life at baseline. The second aim was to determine whether treatment with sertraline versus placebo or response to treatment was associated with a change in the levels of these plasma inflammatory biomarkers.
Materials and Methods
Study Participants
This analysis used data from the CAST parallel-arm, randomized clinical trial, the methods of which were previously published (19). Participants were adults aged at least 21 years with CKD stages 3–5, defined as an eGFR<60 ml/min per 1.73 m2 not requiring maintenance dialysis or kidney transplantation. Individuals were recruited from outpatient nephrology clinics at the University of Texas Southwestern, Parkland Hospital, and the Veterans Affairs North Texas Health Care System Hospital in Dallas, Texas. All participants met criteria for current MDD as diagnosed by the Mini International Neuropsychiatric Interview (MINI), which is a gold-standard tool on the basis of the Diagnostic and Statistical Manual of Mental Disorders, Fourth Edition (20,21). Exclusion criteria included psychosis or mania, current drug treatment or psychotherapy for depression, maintenance dialysis or with a functioning kidney transplant, and inability to provide consent. The study was reviewed and approved by the institutional review boards at each recruitment site, and informed consent was obtained from participants according to the Declaration of Helsinki prior to any research procedures. Participants were randomized to receive a 12-week course of either sertraline or placebo, which was dose-escalated from 50 mg to 200 mg once daily, as tolerated.
Clinical and Laboratory Variables
Demographic variables, past medical history, and medication data were collected at the time of enrollment. Severity of depression symptoms was quantified using the clinician-rated Quick Inventory of Depressive Symptomatology (QIDS-C16), a 16-item questionnaire that measures the nine domains of MDD and has been validated in individuals with CKD (22,23). Somatic symptoms were defined a priori as the items addressing sleep, appetite/weight, concentration, fatigue, and psychomotor agitation/retardation on the QIDS-C16, whereas nonsomatic symptoms were defined as items addressing sadness, self-perception, suicide, and anhedonia. The Kidney Disease Quality of Life Short Form (KDQOL-SF), version 1.3, was administered at baseline to quantify quality of life as related to physical symptoms, mental symptoms, kidney disease, and overall health on a scale of 0–100, with higher numbers indicating better quality of life. The Charlson Comorbidity Index quantified medical comorbidities, with a higher score indicating greater burden of comorbidity.
The main predictor variables were treatment assignment to sertraline or placebo and achievement of treatment response or improvement in depressive symptoms. The QIDS-C16 was completed at baseline and at each of six study visits for the 12-week treatment course. Treatment response was defined as a decrease of at least 50% from baseline QIDS-C16 score. Symptom improvement was defined as a decrease of at least three points from baseline QIDS-C16 score, which is equivalent to one domain of the QIDS-C16. Improvement and response were defined on the basis of the change from baseline to exit (last available visit during the 12-week treatment phase of the trial). If the criteria for response or improvement were met and then lost by the final visit, that individual was not counted as a responder or improver.
Outcome Measures
The primary outcome measure, determined a priori, was the change in plasma high-sensitivity C-reactive protein (hsCRP) from baseline to exit. Secondary outcomes were changes in plasma levels of IL-6, albumin, and prealbumin from baseline to exit. Blood and urine samples were collected at randomization and after 12 weeks of sertraline or placebo. Blood was centrifuged immediately after phlebotomy and stored at 4°C for up to 4 hours. IL-6 was measured by a highly sensitive ELISA assay (Quest Diagnostics, San Juan Capistrano, CA), and C-reactive protein was measured by a high-sensitivity assay (Quest Diagnostics, Irving, TX). Albumin was measured using the bromocresol green assay.
Statistical Analyses
Baseline characteristics were compared between treatment responders and nonresponders in the sertraline and placebo groups using chi-squared tests for categorical and t tests for Gaussian and Wilcoxon rank-sum tests for non-Gaussian continuous variables. Spearman correlations assessed associations between inflammatory biomarkers and depressive symptoms and quality-of-life subscales at baseline. Wilcoxon signed-rank and rank-sum tests were used to compare baseline and exit biomarker levels and investigate whether the changes from baseline in each biomarker differed for sertraline versus placebo groups, improvers versus nonimprovers, and responders versus nonresponders to treatment. The interaction between treatment group and improver or responder status was tested using two-way ANOVA applied to the ranks rather than the raw data, owing to the non-normal distribution of the data. A P value <0.1 was considered statistically significant for interaction terms.
Results
Baseline Characteristics
Of the 201 participants randomized, 102 were assigned to sertraline and received sertraline and 99 were assigned to placebo and received placebo (Figure 1). Of those, 193 (97 in the sertraline and 96 in the placebo group) were included in the modified intention-to-treat analysis, given that five participants in the sertraline and three in the placebo group exited before the first ascertainment of depressive symptoms after treatment initiation (6). The mean (SD) age of the 193 participants was 58.4 (13) years and the sample comprised 58% black, 42% white, and 18% Hispanic individuals. The proportions with CKD stages 3a, 3b, 4, and 5 were 11%, 36%, 36%, and 17%, respectively. Median hsCRP was 3.2 (interquartile range [IQR], 1.2–8.0) mg/L (normal range: 0.0–3.0 mg/L) and median IL-6 was 3.9 (IQR, 2.3–7.0) pg/ml (normal range: 0.31–5.00 pg/ml).
Figure 1.

Flow of participants through the study. MDD, major depressive disorder; QIDS-SR16, 16-Item Quick Inventory of Depressive Symptomatology-Self-Report.
A total of 31 (32%) of the sertraline group and 24 (25%) of the placebo group achieved response (P=0.28). Among the sertraline group, there were no significant differences in demographic characteristics between responders and nonresponders, except that responders were older with a higher proportion of black and male participants. Median baseline hsCRP was 5.0 (IQR, 2.0–14.6) mg/L in sertraline responders and 2.7 (IQR, 0.8–6.0) mg/L in sertraline nonresponders (P=0.03) (Table 1). Median hsCRP was also higher in those who did versus did not achieve improvement in the sertraline group (5.0 [IQR, 1.7–8.6] versus 1.4 [IQR, 0.6–3.7] mg/L, respectively; P=0.005). In the placebo group, baseline levels of inflammatory biomarkers were not significantly different according to response or improvement status. There were no differences in comorbid medical conditions, baseline eGFR, urinary albumin-to-creatinine ratio, serum albumin, prealbumin, and plasma IL-6 between responders and nonresponders in either treatment group (Table 1).
Table 1.
Baseline characteristics
| Variables, Median (IQR) or N (%) | Sertraline | Placebo | ||
| Responders, n=31 | Nonresponders, n=66 | Responders, n=24 | Nonresponders, n=72 | |
| Demographic factors | ||||
| Age, yr | 59.0 (12.4) | 57.1 (15.4) | 58.4 (12.6) | 59.3 (12.2) |
| Male sex | 25 (80.7) | 49 (74.2) | 21 (87.5) | 45 (63.4)a |
| Race | ||||
| Black | 22 (71.0) | 34 (48.5) | 17 (70.8) | 38 (52.8) |
| White | 9 (29.0) | 32 (48.5) | 7 (29.1) | 33 (45.8) |
| Other | 0 (0.0) | 0 (0.0) | 0 (0.0) | 1 (1.4) |
| Hispanic ethnicity | 4 (12.9) | 17 (25.8) | 2 (8.3) | 12 (16.7) |
| Education >high school | 25 (80.7) | 48 (73.9) | 21 (87.5) | 58 (84.1) |
| Married | 10 (34.5) | 23 (35.9) | 13 (56.5) | 24 (33.8) |
| Lives alone | 10 (34.5) | 15 (23.4) | 5 (21.7) | 20 (28.2) |
| Employed | 8 (27.6) | 12 (19.1) | 1 (4.4) | 10 (13.9) |
| Clinical factors | ||||
| CKD stage at randomization | ||||
| Stage 3 | 17 (54.8) | 29 (43.9) | 14 (58.3) | 30 (41.7) |
| Stage 4 | 10 (32.3) | 24 (36.4) | 6 (25.0) | 30 (41.7) |
| Stage 5 | 4 (12.9) | 13 (19.7) | 4 (16.7) | 12 (16.7) |
| Charlson Comorbidity Index | 5.7 (1.7) | 6.0 (2.5) | 6.7 (3.0) | 6.1 (2.4) |
| Hypertension | 31 (100.0) | 63 (96.9) | 24 (100.0) | 70 (97.2) |
| Diabetes mellitus | 19 (61.3) | 39 (60.0) | 16 (66.7) | 39 (54.2) |
| Coronary artery disease | 7 (22.6) | 15 (23.1) | 9 (37.5) | 12 (16.9) |
| Congestive heart failure | 10 (32.3) | 21 (32.3) | 9 (37.5) | 22 (30.6) |
| Cerebrovascular disease | 4 (12.9) | 13 (20.0) | 2 (12.5) | 10 (13.9) |
| Peripheral vascular disease | 6 (19.4) | 11 (16.9) | 1 (4.2) | 9 (12.9) |
| Liver disease | 2 (6.5) | 7 (10.9) | 3 (12.5) | 6 (8.6) |
| Lung disease | 3 (10.0) | 11 (16.9) | 4 (16.7) | 10 (14.3) |
| Cancer | 3 (9.7) | 10 (15.4) | 6 (25.0) | 9 (12.7) |
| Drug abuse | 7 (24.1) | 13 (20.3) | 6 (25.0) | 17 (23.6) |
| Alcohol abuse | 13 (44.8) | 23 (35.9) | 11 (45.8) | 32 (44.4) |
| Tobacco use, current | 6 (20.7) | 14 (22.2) | 6 (27.3) | 16 (22.5) |
| Laboratory measurements | ||||
| eGFR, ml/min per 1.73 m2 | 30.0 (18.0–39.0) | 26.5 (16.0–35.0) | 35.0 (15.5–43.0) | 26.0 (17.0–33.5) |
| ACR, mg/g | 803.5 (1171.7) | 1364.5 (2097.8) | 1089.9 (1313.3) | 1022.8 (1349.9) |
| Hemoglobin, g/dl | 12.0 (1.9) | 11.9 (2.2) | 12.0 (2.2) | 12.0 (2.2) |
| Albumin, g/dl | 3.8 (0.5) | 3.7 (0.7) | 3.8 (0.5) | 3.9 (0.5) |
| Prealbumin, mg/dl | 30.1 (7.3) | 32.5 (8.4) | 29.1 (10.6) | 30.4 (8.1) |
| hsCRP, mg/L | 5.0 (2.0–14.6) | 2.7 (0.8–6.0)b | 3.2 (1.3–9.1) | 3.7 (1.7–10.0) |
| IL-6, pg/ml | 3.9 (2.5–7.0) | 3.7 (2.1–8.0) | 3.1 (2.3–6.8) | 4.1 (2.5–6.7) |
Reference ranges: albumin, 3.0–5.0 g/dl; prealbumin, 20–40 mg/dl; hsCRP, 0.0–3.0 mg/L; and IL-6, 0.31–5.00 pg/ml. IQR, interquartile range; ACR, albumin-to-creatinine ratio; hsCRP, high-sensitivity C-reactive protein.
P<0.05 for responders versus nonresponders in the placebo group.
P<0.05 for responders versus nonresponders in the sertraline group.
No significant differences were observed in the severity of baseline depressive symptoms as measured by the total QIDS-C16 score or in the somatic or nonsomatic subscales in responders versus nonresponders in either group (Table 2). In the sertraline group, there were no significant differences in quality-of-life scores such as physical functioning by the KDQOL-SF. However, compared with nonresponders, responders in the placebo group had higher scores (indicating better perceived quality of life at baseline) on several measures, including burden and effects of kidney disease, cognitive function, physical role limits, emotional wellbeing, social function, and energy/fatigue (Table 2).
Table 2.
Baseline depression and quality-of-life measures
| Variables, Median (IQR) or N (%) | Sertraline | Placebo | ||
| Responders, n=31 | Nonresponders, n=66 | Responders, n=24 | Nonresponders, n=72 | |
| QIDS-C 16 | ||||
| Total score | 15.0 (12.0–17.0) | 13.0 (12.0–15.0) | 13.0 (11.5–15.0) | 14.0 (12.0–16.0) |
| Somatic subscale total | 9.0 (8.0–10.0) | 8.0 (7.0–9.0) | 9.0 (7.0–9.0) | 9.0 (8.0–10.0) |
| Sleep | 3.0 (2.0–3.0) | 3.0 (2.0–3.0) | 3.0 (2.0–3.0) | 3.0 (2.0–3.0) |
| Appetite/weight | 2.0 (1.0–2.0) | 2.0 (1.0–2.0) | 1.0 (1.0–2.0) | 2.0 (1.0–2.0) |
| Concentration | 2.0 (1.0–2.0) | 1.0 (1.0–2.0) | 1.0 (1.0–2.0) | 1.0 (1.0–2.0) |
| Fatigue | 2.0 (1.0–2.0) | 2.0 (1.0–2.0) | 2.0 (2.0–2.0) | 2.0 (2.0–2.0) |
| Psychomotor agitation/retardation | 1.0 (1.0–2.0) | 1.0 (1.0–1.0) | 1.0 (1.0–1.5) | 1.0 (1.0–2.0) |
| Nonsomatic subscale total | 6.0 (4.0–7.0) | 5.0 (4.0–6.0) | 5.0 (5.0–4.0) | 5.0 (4.0–7.0) |
| Sadness | 2.0 (1.0–2.0) | 2.0 (1.0–2.0) | 1.0 (1.0–2.0) | 2.0 (1.0–2.0) |
| Self-perception | 2.0 (1.0–2.0) | 1.0 (1.0–2.0)a | 1.0 (0.0–2.0) | 1.0 (1.0–2.0) |
| Suicide | 0.0 (0.0–1.0) | 0.0 (0.0–1.0) | 0.0 (0.0–1.0) | 0.0 (0.0–1.0) |
| Anhedonia | 2.0 (2.0–3.0) | 2.0 (2.0–2.0) | 2.0 (2.0–3.0) | 2.0 (2.0–3.0) |
| KDQOL-SF 1.3 subscales | ||||
| Kidney disease component | ||||
| Burden of kidney disease | 50.0 (25.0–68.8) | 40.6 (25.0–62.5) | 50.0 (37.5–65.6) | 37.5 (18.8–56.3)b |
| Symptoms/problems | 68.2 (59.1–77.3) | 67.4 (56.8–77.3) | 68.2 (55.1–85.2) | 68.2 (56.8–75.0) |
| Effects of kidney disease | 62.5 (43.8–81.2) | 65.6 (46.9–81.2) | 73.4 (60.9–90.6) | 65.6 (43.8–78.1)b |
| Work status | 0.0 (0.0–50.0) | 0.0 (0.0–50.0) | 0.0 (0.0–50.0) | 0.0 (0.0–0.0) |
| Cognitive function | 66.7 (46.7–80.0) | 66.7 (53.3–80.0) | 76.7 (60.0–96.7) | 60.0 (46.7–80.0)b |
| Quality of social interaction | 60.0 (53.3–73.3) | 66.7 (53.3–80.0) | 60.0 (46.7–76.7) | 53.3 (46.7–66.7) |
| Sexual function | 43.8 (25.0–75.0) | 62.5 (25.0–87.5) | 87.5 (25.0–87.5) | 62.5 (37.5–100.0) |
| Sleep | 50.0 (40.0–67.5) | 51.3 (40.0–62.5) | 60.0 (45.0–72.5) | 50.0 (37.5–60.0) |
| Social support | 66.7 (50.0–83.3) | 66.7 (50.0–83.3) | 50.0 (33.3–83.3) | 66.7 (33.3–66.7) |
| Patient satisfaction | 66.7 (58.3–83.3) | 66.7 (50.0–83.3) | 66.7 (66.7–100.0) | 66.7 (50.0–83.3) |
| Physical functioning component | ||||
| Physical functioning | 37.5 (20.0–60.0) | 35.0 (15.0–55.0) | 30.0 (20.0–67.5) | 25.0 (15.0–50.0) |
| Role limits, physical | 0.0 (0.0–25.0) | 0.0 (0.0–0.0) | 0.0 (0.0–62.5) | 0.0 (0.0–0.0)b |
| Pain | 35.0 (22.5–67.5) | 45.0 (22.5–67.5) | 45.0 (22.5–80.0) | 35.0 (22.5–55.0) |
| General health | 30.0 (15.0–45.0) | 35.0 (20.0–45.0) | 32.5 (22.5–50.0) | 30.0 (15.0–35.0) |
| Mental functioning component | ||||
| Emotional wellbeing | 60.0 (44.0–72.0) | 58.0 (44.0–68.0) | 62.5 (50.0–74.0) | 52.0 (44.0–60.0)b |
| Role limits, emotional | 33.3 (0.0–66.7) | 0.0 (0.0–66.7) | 33.3 (0.0–83.3) | 0.0 (0.0–33.3) |
| Social function | 50.0 (25.0–75.0) | 50.0 (37.5–62.5) | 50.0 (37.5–87.5) | 37.5 (25.0–50.0)b |
| Energy/fatigue | 35.0 (20.0–50.0) | 35.0 (20.0–46.7) | 37.5 (25.0–55.0) | 25.0 (15.0–40.0)b |
| Overall health | 50.0 (30.0–60.0) | 50.0 (30.0–50.0) | 50.0 (35.0–50.0) | 50.0 (30.0–50.0) |
| SF-36 physical composite | 29.1 (26.7–35.2) | 27.9 (24.0–35.3) | 25.7 (23.8–45.0) | 26.8 (23.2–34.9) |
| SF-36 mental composite | 42.4 (32.2–47.0) | 38.6 (34.5–46.5) | 39.9 (36.3–50.5) | 37.9 (29.2–42.8)b |
| SF-12 physical composite | 29.1 (26.3–39.9) | 29.1 (25.7–36.2) | 29.2 (27.3–39.7) | 28.5 (23.9–34.9) |
| SF-12 mental composite | 40.5 (33.6–48.0) | 37.1 (33.0–43.9) | 39.9 (34.8–49.8) | 37.7 (31.5–41.5) |
IQR, interquartile range; QIDS-C16, clinician-rated 16-item Quick Inventory of Depressive Symptomatology scale; KDQOL-SF 1.3, Kidney Disease Quality of Life Survey Short Form, Version 1.3; SF-36, Short Form 36 Health Survey; SF-12, Short Form 12.
P<0.05 for responders versus nonresponders in the sertraline group.
P<0.05 for responders versus nonresponders in the placebo group.
Association of Inflammatory Biomarkers and Clinical Variables
Age correlated with lower prealbumin and higher IL-6, but not with other inflammatory biomarkers (Table 3). Baseline eGFR correlated with albumin and IL-6, but not with hsCRP or prealbumin. Increased severity of medical comorbidity by the Charlson Comorbidity Index correlated negatively with albumin and prealbumin and positively with IL-6. Baseline severity of depressive symptoms by QIDS-C16 correlated positively with hsCRP, but not with the other inflammatory biomarkers. Higher hsCRP levels correlated with worse physical symptoms, including the QIDS-C16 somatic subscale, which appeared to be primarily driven by the fatigue item, and the KDQOL-SF Physical Functioning, Overall Health, and Physical Composite scores (Table 3).
Table 3.
Correlations of baseline inflammatory biomarkers with clinical variables
| Variable | Albumin Spearman rho | Prealbumin Spearman rho | hsCRP Spearman rho | IL-6 Spearman rho |
| Age, yr | 0.029 | −0.345a | 0.034 | 0.179b |
| eGFR, ml/min per 1.73 m2 | 0.207a | 0.068 | −0.020 | −0.187b |
| CCI | −0.162b | −0.313a | 0.095 | 0.241a |
| Albumin-to-creatinine ratio, mg/g | −0.538a | 0.003 | 0.079 | 0.176b |
| QIDS-C 16 | ||||
| Total score | 0.051 | 0.041 | 0.162b | 0.017 |
| Somatic subscale total | −0.025 | −0.053 | 0.205b | 0.036 |
| Sleep | −0.033 | 0.012 | 0.027 | −0.011 |
| Appetite/weight | −0.116 | −0.184b | 0.080 | 0.051 |
| Concentration | 0.151b | 0.047 | 0.035 | −0.093 |
| Fatigue | −0.065 | 0.020 | 0.223a | 0.128 |
| Psychomotor agitation/retardation | 0.025 | 0.005 | 0.124 | 0.007 |
| Nonsomatic subscale total | 0.091 | 0.058 | 0.103 | 0.031 |
| Sadness | 0.085 | 0.092 | 0.109 | 0.011 |
| Self-perception | 0.018 | 0.012 | 0.032 | −0.008 |
| Suicide | 0.104 | −0.083 | 0.047 | 0.002 |
| Anhedonia | 0.051 | 0.130 | 0.131 | 0.071 |
| KDQOL-SF 1.3 subscales | ||||
| Kidney disease component | ||||
| Burden of kidney disease | 0.059 | −0.123 | −0.041 | −0.015 |
| Symptoms/problems | 0.103 | −0.012 | −0.008 | −0.050 |
| Effects of kidney disease | 0.053 | −0.085 | −0.075 | −0.086 |
| Work status | 0.030 | 0.079 | −0.160b | −0.289a |
| Cognitive function | −0.130 | −0.167b | 0.108 | 0.146b |
| Quality of social interaction | −0.102 | −0.225a | 0.033 | 0.028 |
| Sexual function | 0.085 | −0.018 | −0.152 | −0.319b |
| Sleep | 0.012 | −0.143 | −0.123 | −0.021 |
| Social support | −0.030 | 0.017 | −0.056 | −0.052 |
| Patient satisfaction | −0.024 | −0.067 | −0.038 | −0.022 |
| Physical functioning component | ||||
| Physical functioning | 0.212a | 0.111 | −0.263a | −0.213a |
| Role limits, physical | 0.032 | −0.040 | 0.000 | −0.024 |
| Pain | 0.095 | −0.078 | −0.125 | −0.148b |
| General health | 0.111 | −0.067 | −0.157b | −0.018 |
| Mental functioning component | ||||
| Emotional wellbeing | −0.075 | −0.090 | 0.003 | −0.026 |
| Role limits, emotional | −0.003 | −0.045 | 0.009 | −0.000 |
| Social function | −0.094 | −0.202a | −0.042 | −0.014 |
| Energy/fatigue | −0.029 | −0.017 | −0.121 | −0.109 |
| Overall health | 0.119 | 0.013 | −0.250a | −0.168b |
| SF-36 physical composite | 0.209a | 0.006 | −0.198b | −0.160b |
| SF-36 mental composite | −0.100 | −0.107 | −0.002 | −0.002 |
| SF-12 physical composite | 0.145 | −0.030 | −0.182b | −0.130 |
| SF-12 mental composite | −0.073 | −0.087 | −0.043 | −0.061 |
hsCRP, high-sensitivity C-reactive protein; CCI, Charlson Comorbidity Index; QIDS-C16, clinician-rated 16-item Quick Inventory of Depressive Symptomatology scale; KDQOL-SF 1.3, Kidney Disease Quality of Life Survey Short Form, Version 1.3; SF-36, Short Form 36 Health Survey; SF-12, Short Form 12.
P<0.01.
P<0.05.
Effect of Treatment on Depressive Symptoms and Inflammatory Biomarkers
There was a significant decrease in depressive symptoms as measured by the QIDS-C16 score over 12 weeks in both the sertraline and placebo groups that was not different on the basis of treatment assignment (Supplemental Table 1). Measured levels of plasma albumin, prealbumin, IL-6, and hsCRP were similar between the sertraline and placebo groups at baseline and exit. There were no significant differences in the changes in the levels of plasma inflammatory markers from baseline to exit in either treatment group (Supplemental Table 1).
Improvers in the sample taken as a whole, regardless of treatment assignment, had higher baseline hsCRP levels than nonimprovers (Supplemental Table 2), which was driven by a difference observed in the sertraline but not in the placebo subgroup (interaction P=0.04; Figure 2, A–C, Supplemental Tables 3–5). The baseline plasma level of hsCRP was higher in the sertraline improvers than in the nonimprovers (median, 5.0 [IQR, 1.7–8.6] mg/L versus 1.4 [IQR, 0.6–3.6] mg/L, respectively; P=0.005) (Supplemental Table 3). There were no differences in hsCRP at study exit between improvers and nonimprovers. Nonimprovers had a numerically greater increase than improvers in hsCRP over 12 weeks of treatment in the whole sample and in the sertraline and placebo groups, although the differences were not significant (Figure 2, A–D, Supplemental Tables 2–5). Baseline prealbumin was marginally higher in all-comer and sertraline nonimprovers than improvers (Supplemental Tables 2 and 3). There were no other differences in baseline, exit, or change in albumin, prealbumin, or IL-6 between improvers and nonimprovers (Supplemental Tables 2–5).
Figure 2.
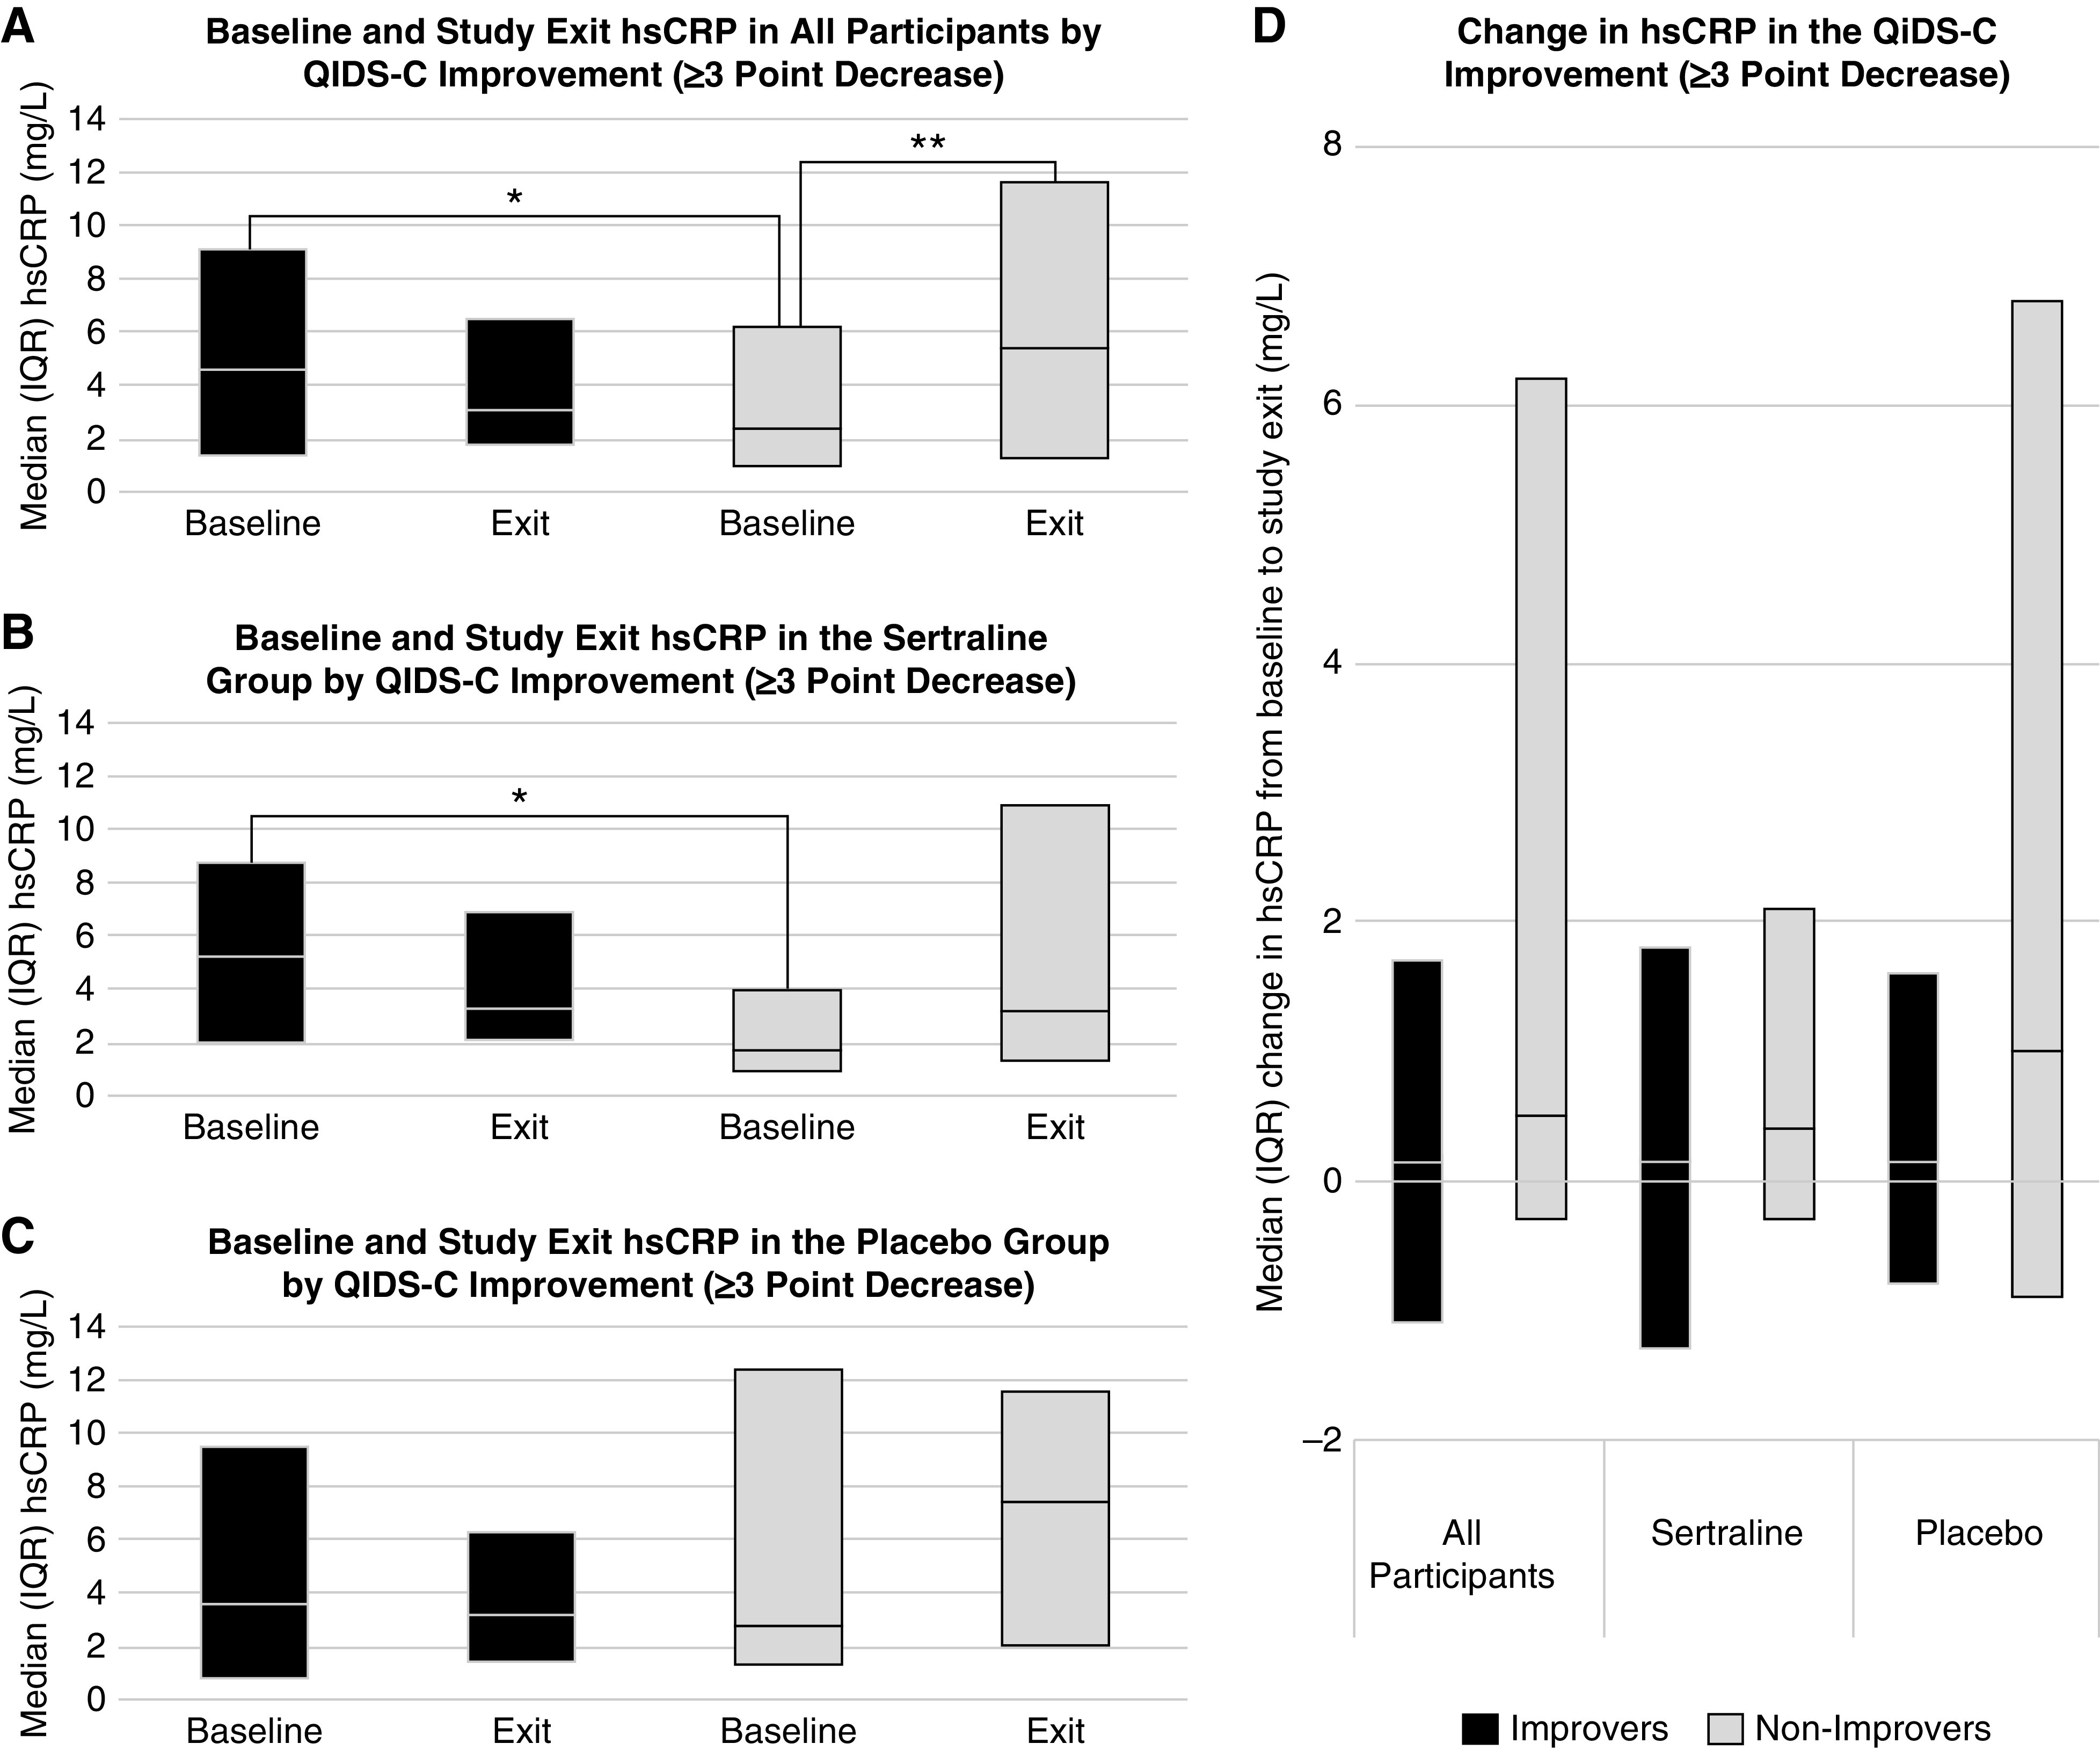
Baseline hsCRP was higher in those with than without improvement in depressive symptoms, and hsCRP increased from baseline to exit in those without improvement in depressive symptoms. Comparison of hsCRP at baseline and study exit among (A) all participants, (B) the sertraline group, and (C) the placebo group, and (D) the change in hsCRP from baseline to study exit between those who achieved a three-point improvement in depressive symptoms (black) and those who did not (gray). *P<0.05 for the indicated between-groups comparison at baseline; **P<0.05 for the indicated within-group comparison from baseline to study exit. hsCRP, high-sensitivity C-reactive protein; IQR, interquartile range; QIDS-C, clinician-rated Quick Inventory of Depressive Symptomatology.
A significant decrease in QIDS-C16 was seen in both responders and nonresponders, with a greater decrease and lower exit QIDS-C16 score seen in the responders (Supplemental Table 6). In the sertraline group, baseline hsCRP was higher in responders than nonresponders (median, 5.0 [IQR, 2.0–14.6] mg/L versus 2.7 [IQR, 0.8–6.0] mg/L, respectively; P=0.03) (Figure 3B, Supplemental Table 7). There were no differences in hsCRP at study exit between responders and nonresponders overall or according to treatment assignment (Figure 3, A–C, Supplemental Tables 6–9). In nonresponders, hsCRP increased after 12 weeks of treatment, but there was no change in responders (Figure 3A). This finding was seen in the placebo subgroup but not in the sertraline group (interaction P=0.08; Figure 3, B and C, Supplemental Table 9). The change in hsCRP from baseline to study exit differed between responders and nonresponders among all participants (Supplemental Table 6) and in those treated with placebo (Figure 3D, Supplemental Table 8). There were no differences between responders and nonresponders in baseline, exit, or change in albumin, prealbumin, or IL-6 within or between treatment groups (Supplemental Tables 6–9).
Figure 3.
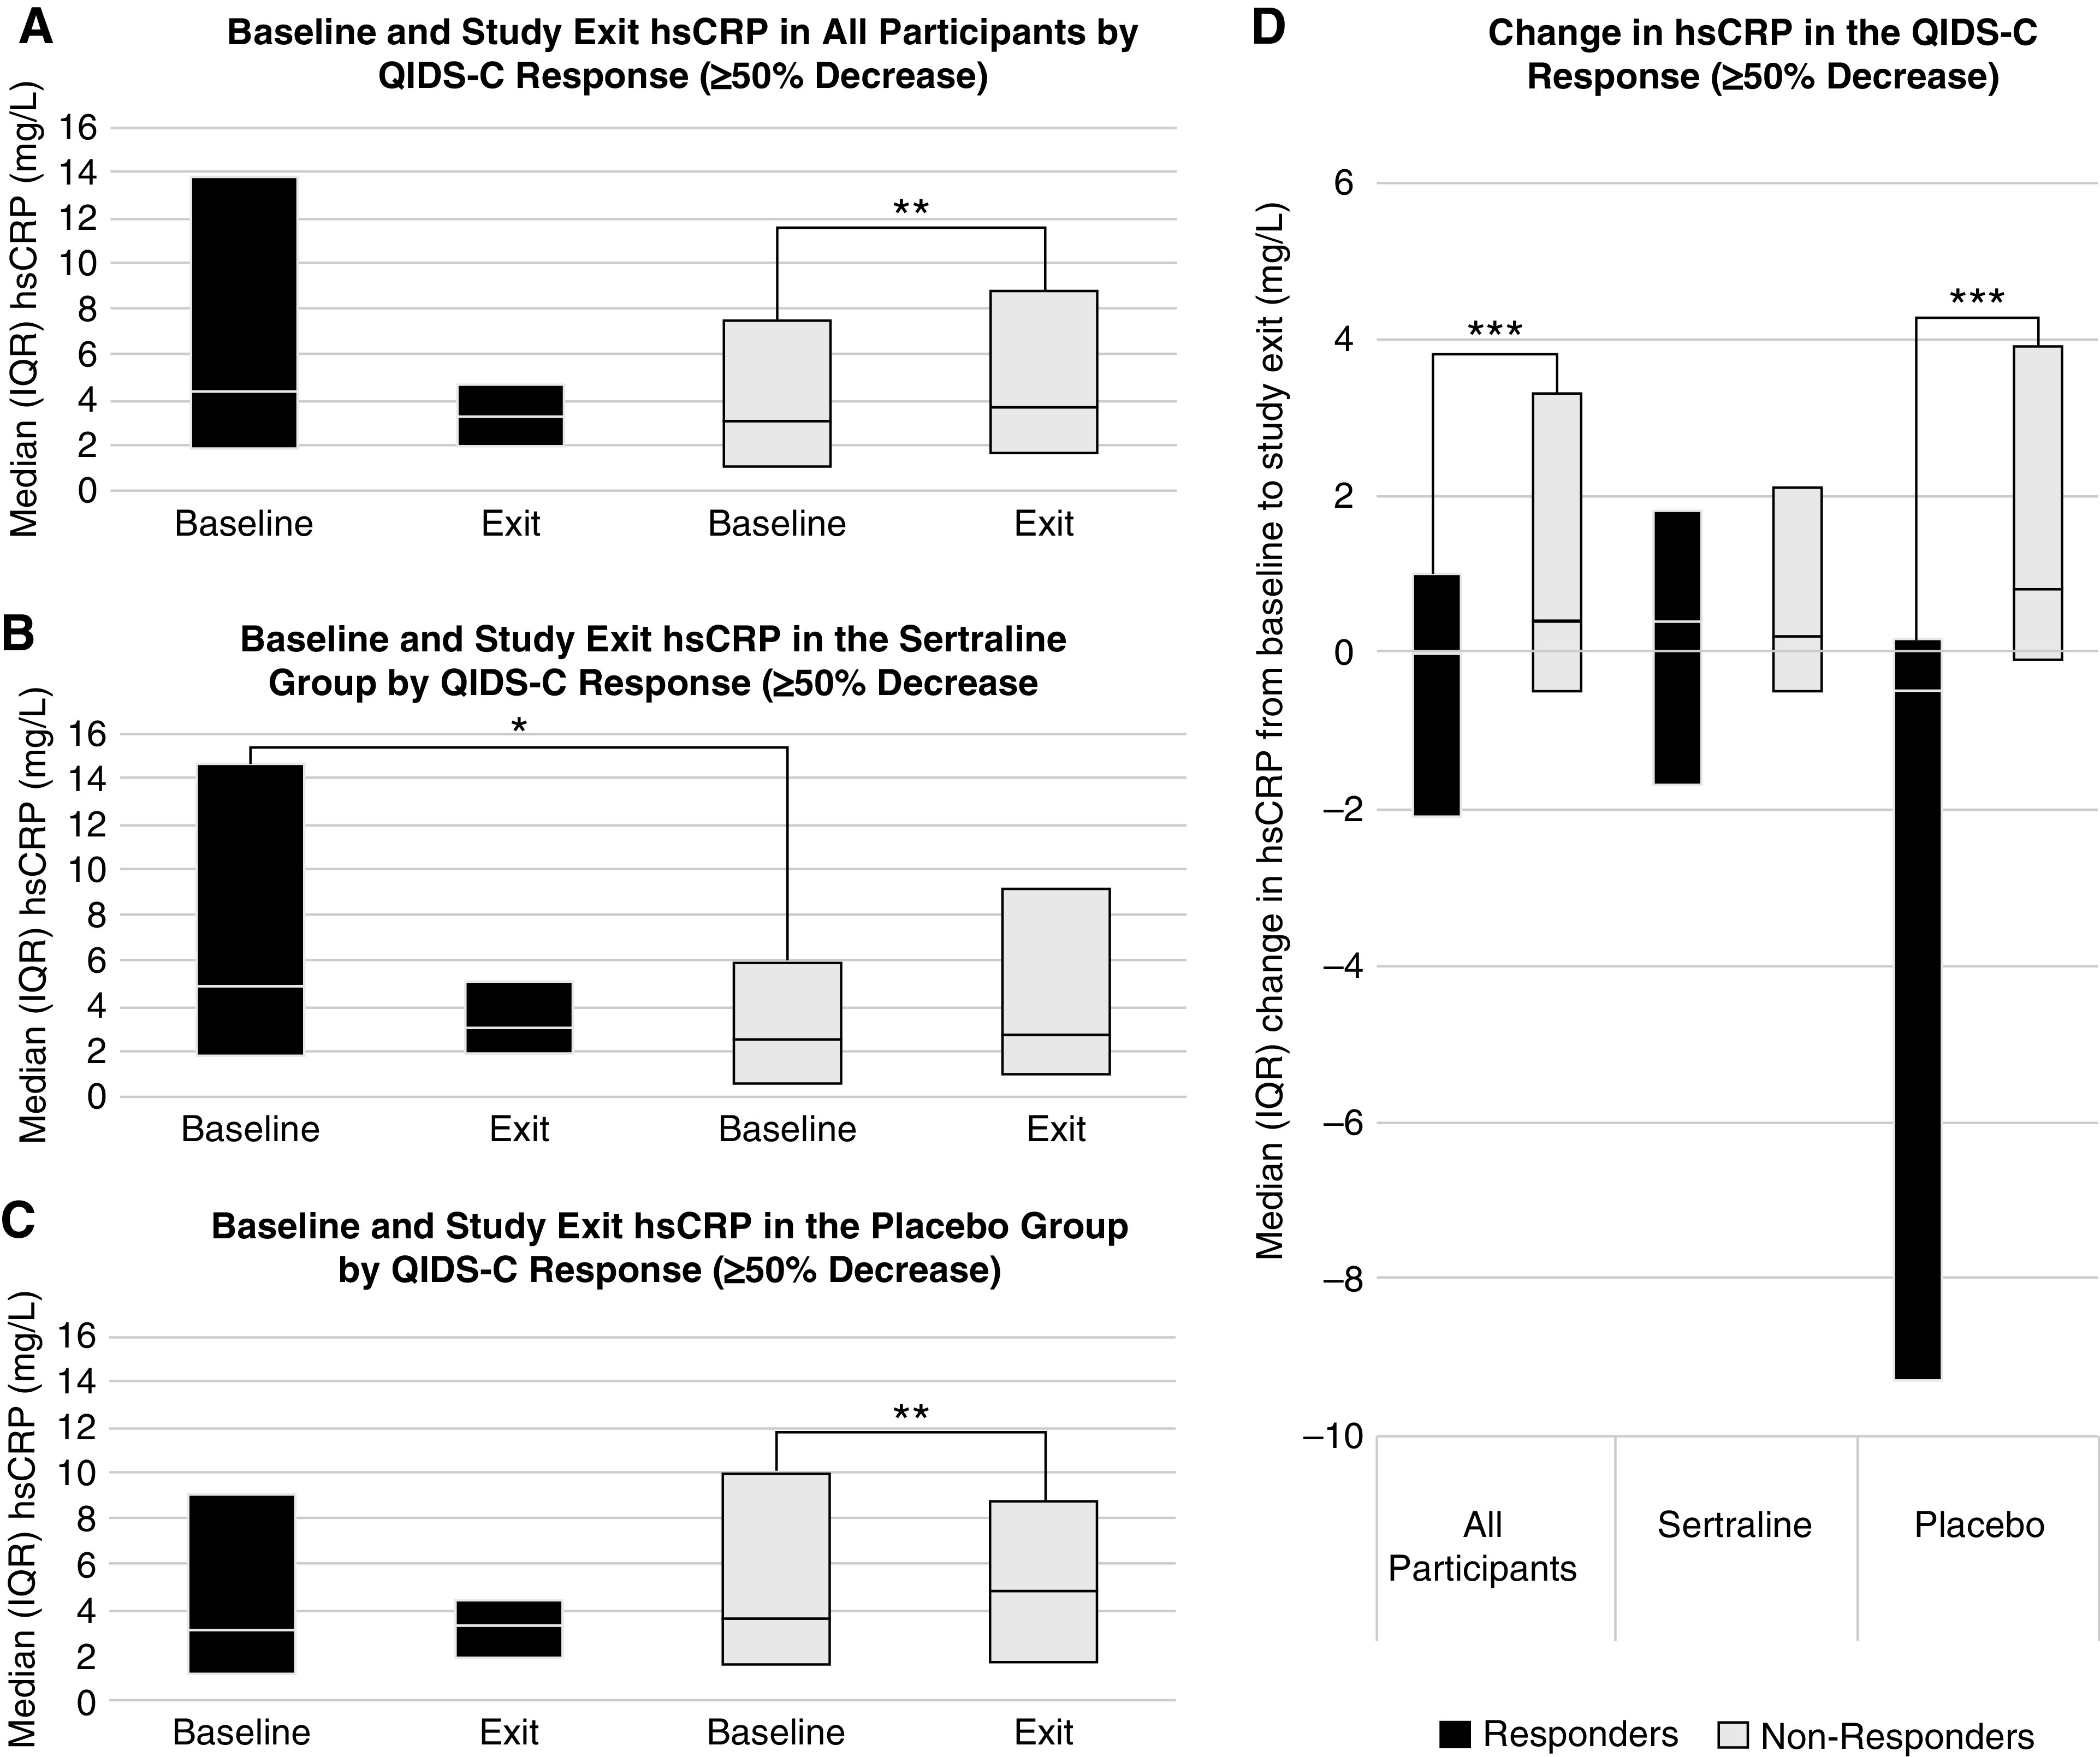
Baseline hsCRP was higher in sertraline responders than non-responders, and hsCRP increased from baseline to exit in those without placebo response. Comparison of at baseline and study exit among (A) all participants, (B) the sertraline group, and (C) the placebo group, and (D) the change in hsCRP from baseline to study exit between those who achieved depression treatment response (black) and those who did not (gray). *P<0.05 for the indicated between-groups comparison at baseline; **P<0.05 for the indicated within-group comparison from baseline to study exit; ***P<0.05 for the indicated between-groups comparison of the change in hsCRP from baseline to study exit.
Discussion
In this analysis, we observed that among individuals with CKD and MDD, higher baseline plasma hsCRP levels correlated with more severe somatic depressive symptoms and fatigue, and with lower levels of physical functioning, but not with nonsomatic symptoms. Also, failure to achieve MDD symptom improvement or response was associated with an increase in hsCRP, but there was no significant change in hsCRP among improvers and responders. Finally, sertraline treatment was not associated with a change in hsCRP from baseline regardless of treatment effect on depressive symptoms, but those who failed to respond to placebo had an increase in hsCRP over time.
Depression comorbid with medical illnesses, especially chronic diseases, has been shown to be associated with inflammation (24–28). However, data are scarce to demonstrate whether conventional antidepressant medications, such as SSRIs, have an effect on inflammatory biomarkers in patients with CKD and MDD. In individuals without kidney disease, a meta-analysis of 32 available studies showed that treatment with common antidepressant medications led to decreases in the plasma levels of IL-6, IL-4, and IL-10, a marginal decrease in IL-1, and no effect on CRP (29). To our knowledge no prior studies have investigated the change in inflammatory biomarkers with SSRI therapy in patients with nondialysis CKD, and only six studies investigated this question in patients with ESKD. Existing studies in patients with ESKD were limited by small sample sizes, with some as small as nine or ten total participants (14,15). Most used low doses or short treatment durations of SSRIs that may not have been sufficient to see a clinical effect (12,14–17). Only two included a control group to assess whether changes in biomarkers were because of SSRI treatment (17,18). Furthermore, only two of the studies used gold-standard criteria to diagnose depression (14,15), whereas the others used variable cut-offs of self-reported depression scales such as the Beck Depression Inventory (12,16–18). With these limitations in mind, the variable results of the studies are not surprising, with no consistent findings suggesting an effect of SSRI therapy on inflammatory biomarkers including albumin, CRP by the regular or high-sensitivity assay, or IL-6.
Furthermore, previous studies investigating the associations of depressive symptoms in patients with nondialysis CKD were frequently small, included patients with ESKD in addition to nondialysis CKD, and only measured two or three inflammatory biomarkers each. Studies in participants with ESKD are more extensive but were mostly limited by small sample size and presented heterogeneous results. Although several studies showed that hsCRP was associated with depressive symptom severity and somatic symptoms in patients receiving chronic dialysis, this has not previously been demonstrated in individuals with nondialysis CKD (25,27,30–34). Our study adds to the literature a large sample comprised exclusively of participants with nondialysis CKD, as well as measurement of several inflammatory biomarkers. These findings support that inflammation may be an important mediator or confounder of the associations of depression and fatigue with long-term death, hospitalization, and dialysis initiation that our group previously reported among patients with nondialysis CKD (2,3,35).
Notably, the correlation we observed between higher levels of baseline plasma hsCRP and depressive symptoms was primarily driven by the burden of somatic symptoms, especially fatigue. Baseline hsCRP was associated with a higher burden of the physical symptoms associated with depression and low quality of life, such as fatigue, poor overall physical functioning, and physical composite scores, but not with the nonsomatic mental symptoms such as suicidality, social functioning, or emotional wellbeing. It is possible that the observed association of higher baseline hsCRP with depressive symptom improvement and response to sertraline may represent associations of somatic symptoms of depression with favorable response to treatment. As decreases in depressive symptoms with sertraline were not associated with longitudinal changes in hsCRP from baseline, perhaps the phenotypic characteristics of a patient’s depressive symptoms (such as predominance of somatic rather than nonsomatic symptoms, which correlated with a heightened inflammatory state manifested as elevated hsCRP), may affect responsiveness to sertraline. Alternatively, it is possible that improvement in other physical conditions contributing to elevated inflammation may confound the relationship between the change in inflammation and somatic depressive symptoms. These explanations could fit with prior studies in patients with ESKD that found baseline associations between inflammation and depression but no longitudinal changes in inflammatory biomarkers, as observed in our analysis (36).
In our study, although baseline hsCRP was higher in those with a favorable sertraline response, there was no change in hsCRP or other inflammatory biomarkers from baseline to study exit in those treated with sertraline, regardless of change in depressive symptoms. This is consistent with prior data in patients with ESKD, in which three studies showed no difference in CRP or hsCRP after SSRI therapy (12,15,17). The one study that did show a difference included only individuals with a very high baseline CRP >5 mg/dl (16). The interaction effect of treatment group on baseline and change in hsCRP may be related to anti-inflammatory effects of sertraline (29,37). The data in patients with ESKD and in our study indicate that further study in those with elevated baseline CRP or hsCRP could be a promising area of investigation.
Importantly, we also identified that nonresponse to treatment, in particular to placebo, was associated with an increase in hsCRP levels from baseline, whereas placebo responders trended toward a decrease in hsCRP. To our knowledge, no studies have tracked the change in inflammatory biomarkers over time during a major depressive episode. This may suggest that in the natural course of untreated MDD, hsCRP may increase earlier in the course and decrease as depressive symptoms improve. We did not collect data about the duration of the participants’ major depressive episodes to further evaluate this hypothesis, but this could be an interesting area for future study.
Our study has several limitations. Our data showed that although median hsCRP did not change from baseline to study exit in sertraline or placebo groups, the IQR became narrower in the improvers and responders regardless of treatment assignment, suggesting that individuals with high baseline hsCRP may have a greater improvement in inflammation with treatment than those with lower baseline hsCRP. It is possible that we did not enroll enough participants with higher levels of baseline hsCRP to robustly examine this subgroup and show a difference. Alternatively, the sertraline and placebo improver and responder subgroups may have been underpowered to demonstrate a change in hsCRP from baseline to study exit. The changes in hsCRP observed, although statistically significant, were modest and may not be clinically relevant. Spurious findings owing to multiple comparisons cannot be ruled out. Finally, depressive and somatic symptoms are likely multifactorial in patients with CKD, particularly given the overlap in symptoms of depression and uremia (e.g. fatigue, weight changes), and may not closely correlate with changes in circulating inflammatory biomarkers. Sertraline responsiveness is also likely multifactorial. For example, sertraline responders had nonsignificantly lower urinary albumin-to-creatinine ratio at baseline than nonresponders, and given sertraline’s high level of plasma protein binding, albuminuria could potentially affect drug pharmacokinetics. However, our findings in the context of the larger literature base suggest a relationship between inflammation and depression that may reveal future promising intervenable targets to improve outcomes in patients with CKD and MDD.
In conclusion, in patients with CKD and MDD, higher plasma hsCRP levels correlated with somatic symptoms of depression such as fatigue and physical functioning, but not with mental symptoms such as anhedonia or sadness. Although elevated hsCRP at baseline was associated with improvement in depressive symptoms and response to sertraline treatment, sertraline treatment response was not associated with a longitudinal change in hsCRP or other inflammatory biomarkers from baseline. However, there was an increase in hsCRP in those who failed to respond overall, and to placebo specifically, which may indicate that hsCRP increases as part of the natural history of a major depressive episode left untreated. Further studies enrolling only individuals with elevated baseline hsCRP may be useful for determining whether those with high hsCRP are more likely to experience a decrease in levels with sertraline or placebo treatment.
Disclosures
M. Trivedi has served as an advisor or consultant to the following organizations: Allergan Sales LLC, Alkermes, Arcadia Pharmaceuticals Inc., AstraZeneca, Axon Advisors, Bristol-Myers Squibb Company, Eli Lilly & Company, Evotec, Johnson & Johnson, Lundbeck, MedAvante, Merck, MSI Methylation Sciences Inc., Nestle Health Science-PamLab Inc., Naurex, Neuronetics, One Carbon Therapeutics Ltd., Otsuka Pharmaceuticals, Roche Products Ltd., SHIRE Development, Takeda, and Tal Medical/Puretech Venture. M. Trivedi reports personal fees from Acadia, Akili Interactive (other), Alto Neuroscience Inc., Applied Clinical Intelligence LLC, Axome Therapeutics, Boehringer Ingelheim, Engage Health Media, GreenLight VitalSign6 Inc., Health Care Global Village, Janssen-Cilag, Janssen Research and Development LLC, Jazz Pharmaceuticals, Medscape LLC, Navitor Pharmaceuticals Inc, Otsuka Pharmaceutical Development & Commercialization Inc., Otsuka America Pharmaceutical Inc, Perception Neuroscience Holdings Inc., Pharmerit International LP, Policy Analysis Inc., Rexahn Pharmaceuticals Inc., Sage Therapeutics, Signant Health, SK Life Science Inc., and The Baldwin Group Inc. He also reports grants from the National Institute of Mental Health, Patient-Centered Outcomes Research Institute, Cancer Prevention Research Institute of Texas, other from Oxford University Press, and other from American Psychiatric Association (Deputy Editor for American Journal of Psychiatry), outside the submitted work. The coauthors have nothing to disclose.
Funding
This work was supported by National Institute of Diabetes and Digestive and Kidney Diseases (NIDDK) grant R01DK085512 and VA Merit grant CX000217-01 (to S. Hedayati). Support was also provided by the University of Texas Southwestern Medical CenterO’Brien Kidney Research Core Center (NIDDK, P30DK079328). This work is also conducted with support from Science Teacher Access to Resources at Southwestern (STARS), National Institutes of Health/National Center for Advancing Translational Sciencesgrant UL1RR024982. The content is solely the responsibility of the authors and does not necessarily represent the official views of the NIDDK, the National Institutes of Health, or the Department of Veterans Affairs.
Supplemental Material
This article contains supplemental material online at http://kidney360.asnjournals.org/lookup/suppl/doi:10.34067/KID.0000062020/-/DCSupplemental.
Inflammatory markers and total QIDS-C16 scores at baseline and week 12 based on treatment assignment. Download Supplementary Table 1, PDF file, 273 KB (272.2KB, pdf)
Inflammatory markers and total QIDS-C16 scores at baseline and week 12 based on treatment improvement (3-point decrease in QIDS-C16). Download Supplementary Table 2, PDF file, 273 KB (272.2KB, pdf)
Inflammatory markers and total QIDS-C16 scores at baseline and week 12 based on treatment improvement (3-point decrease in QIDS-C16) in the sertraline group. Download Supplementary Table 3, PDF file, 273 KB (272.2KB, pdf)
Inflammatory markers and total QIDS-C16 scores at baseline and week 12 on treatment improvement (3-point decrease in QIDS-C16) in the placebo group. Download Supplementary Table 4, PDF file, 273 KB (272.2KB, pdf)
Inflammatory markers and total QIDS-C16 scores at baseline and week 12 on treatment improvement (3-point decrease in QIDS-C16). Download Supplementary Table 5, PDF file, 273 KB (272.2KB, pdf)
Inflammatory markers and total QIDS-C16 scores at baseline and week 12 based on treatment response (≥50% decrease in QIDS-C16). Download Supplementary Table 6, PDF file, 273 KB (272.2KB, pdf)
Inflammatory markers and total QIDS-C16 scores at baseline and week 12 based on treatment response (≥50% decrease in QIDS-C16) in the sertraline group. Download Supplementary Table 7, PDF file, 273 KB (272.2KB, pdf)
Inflammatory markers and total QIDS-C16 scores at baseline and week 12 based on treatment response (≥50% decrease in QIDS-C16) in the placebo group. Download Supplementary Table 8, PDF file, 273 KB (272.2KB, pdf)
Inflammatory markers and total QIDS-C16 scores at baseline and week 12 on treatment response (≥50% decrease in QIDS-C16). Download Supplementary Table 9, PDF file, 273 KB (272.2KB, pdf)
Acknowledgments
We especially thank all of the patients who consented to be screened and participated in the Chronic Kidney Disaese Antidepressant Sertraline Trial (CAST). We are also grateful to the following persons who did not receive compensation for their role in the study: members of the Data and Safety Monitoring Board at the University of Texas Southwestern (UTSW) site (Beverley Adams-Huet Sherwood Brown, Kevin C. Kelly D. and Robert F. Reilly) and the Central Veterans Affairs (VA) (Clinical Science Research and Development, Central Data Monitoring Committee, Hines Cooperative Studies Program Coordinating Center), psychiatry consultants (Benji Kurian, UTSW and Collin Vas, Dallas VA), nephrology faculty (Peter Van Buren, UTSW), biostatistics (Charles South), and UTSW nephrology residents for contributions in recruiting CAST participants (Masoud Afshar, Lei Chen, Michael Concepcion, Vishal Jaikaransingh, Naseem Sunnoqrot, and Venkata Yalamanchili). We also thank the UTSW research personnel who were compensated for their role in the study: Anuoluwapo Adelodun, Patricia Alvarez, M.S.W., Mieshia Beamon Susamei Khamphong Ammar Nassri, Michael Phan, M.H.S.M., David Rezaei (Dallas VA site), Staci Schwartz Francisco Sanchez Kyle West and the UTSW Nephrology Clinical and Translational Research Center.
Author Contributions
N. Bharadwaj was responsible for manuscript writing (original draft, review, and editing); T. Carmody was responsible for data curation, formal analysis, and manuscript writing (original draft, review, and editing); L.P. Gregg was responsible for data curation, formal analysis, and manuscript writing (original draft, review, and editing); S. Hedayati conceptualized the study and was responsible for data curation, funding acquisition, investigation, methodology, project administration, resources, supervision, and manuscript writing (original draft, review, and editing); D. Le was responsible for formal analysis, and manuscript writing (original draft, review, and editing); M. Trivedi conceptualized the study and was responsible for project administration and manuscript writing (original draft, review, and editing).
References
- 1.Hedayati SS, Minhajuddin AT, Toto RD, Morris DW, Rush AJ: Prevalence of major depressive episode in CKD. Am J Kidney Dis 54: 424–432, 2009 [DOI] [PMC free article] [PubMed] [Google Scholar]
- 2.Hedayati SS, Bosworth HB, Briley LP, Sloane RJ, Pieper CF, Kimmel PL, Szczech LA: Death or hospitalization of patients on chronic hemodialysis is associated with a physician-based diagnosis of depression. Kidney Int 74: 930–936, 2008 [DOI] [PubMed] [Google Scholar]
- 3.Hedayati SS, Minhajuddin AT, Afshar M, Toto RD, Trivedi MH, Rush AJ: Association between major depressive episodes in patients with chronic kidney disease and initiation of dialysis, hospitalization, or death. JAMA 303: 1946–1953, 2010 [DOI] [PMC free article] [PubMed] [Google Scholar]
- 4.Kimmel PL, Peterson RA, Weihs KL, Simmens SJ, Alleyne S, Cruz I, Veis JH: Multiple measurements of depression predict mortality in a longitudinal study of chronic hemodialysis outpatients. Kidney Int 57: 2093–2098, 2000 [DOI] [PubMed] [Google Scholar]
- 5.Palmer SC, Vecchio M, Craig JC, Tonelli M, Johnson DW, Nicolucci A, Pellegrini F, Saglimbene V, Logroscino G, Hedayati SS, Strippoli GF: Association between depression and death in people with CKD: A meta-analysis of cohort studies. Am J Kidney Dis 62: 493–505, 2013 [DOI] [PubMed] [Google Scholar]
- 6.Hedayati SS, Gregg LP, Carmody T, Jain N, Toups M, Rush AJ, Toto RD, Trivedi MH: Effect of sertraline on depressive symptoms in patients with chronic kidney disease without dialysis dependence: The CAST randomized clinical trial. JAMA 318: 1876–1890, 2017 [DOI] [PMC free article] [PubMed] [Google Scholar]
- 7.Glassman AH, O’Connor CM, Califf RM, Swedberg K, Schwartz P, Bigger JT Jr, Krishnan KR, van Zyl LT, Swenson JR, Finkel MS, Landau C, Shapiro PA, Pepine CJ, Mardekian J, Harrison WM, Barton D, Mclvor M; Sertraline Antidepressant Heart Attack Randomized Trial (SADHEART) Group: Sertraline treatment of major depression in patients with acute MI or unstable angina [published correction appears in JAMA 288: 1720, 2002]. JAMA 288: 701–709, 2002 [DOI] [PubMed] [Google Scholar]
- 8.O’Connor CM, Jiang W, Kuchibhatla M, Silva SG, Cuffe MS, Callwood DD, Zakhary B, Stough WG, Arias RM, Rivelli SK, Krishnan R; SADHART-CHF Investigators: Safety and efficacy of sertraline for depression in patients with heart failure: Results of the SADHART-CHF (Sertraline Against Depression and Heart Disease in Chronic Heart Failure) trial. J Am Coll Cardiol 56: 692–699, 2010 [DOI] [PMC free article] [PubMed] [Google Scholar]
- 9.Angermann CE, Gelbrich G, Störk S, Gunold H, Edelmann F, Wachter R, Schunkert H, Graf T, Kindermann I, Haass M, Blankenberg S, Pankuweit S, Prettin C, Gottwik M, Böhm M, Faller H, Deckert J, Ertl G; MOOD-HF Study Investigators and Committee Members: Effect of escitalopram on all-cause mortality and hospitalization in patients with heart failure and depression: The MOOD-HF randomized clinical trial. JAMA 315: 2683–2693, 2016 [DOI] [PubMed] [Google Scholar]
- 10.Brown ES, Vigil L, Khan DA, Liggin JD, Carmody TJ, Rush AJ: A randomized trial of citalopram versus placebo in outpatients with asthma and major depressive disorder: A proof of concept study. Biol Psychiatry 58: 865–870, 2005 [DOI] [PubMed] [Google Scholar]
- 11.Leonard BE: Inflammation and depression: A causal or coincidental link to the pathophysiology? Acta Neuropsychiatr 30: 1–16, 2018 [DOI] [PubMed] [Google Scholar]
- 12.Lee SK, Lee HS, Lee TB, Kim DH, Koo JR, Kim YK, Son BK: The effects of antidepressant treatment on serum cytokines and nutritional status in hemodialysis patients. J Korean Med Sci 19: 384–389, 2004 [DOI] [PMC free article] [PubMed] [Google Scholar]
- 13.Jha MK, Minhajuddin A, Gadad BS, Greer TL, Mayes TL, Trivedi MH: Interleukin 17 selectively predicts better outcomes with bupropion-SSRI combination: Novel T cell biomarker for antidepressant medication selection. Brain Behav Immun 66: 103–110, 2017 [DOI] [PMC free article] [PubMed] [Google Scholar]
- 14.Cilan H, Oguzhan N, Unal A, Turan T, Koc AN, Sipahioglu MH, Utas C, Oymak O: Relationship between depression and proinflammatory cytokine levels in hemodialysis patients. Ren Fail 34: 275–278, 2012 [DOI] [PubMed] [Google Scholar]
- 15.Cilan H, Sipahioglu MH, Oguzhan N, Unal A, Turan T, Koc AN, Tokgoz B, Utas C, Oymak O: Association between depression, nutritional status, and inflammatory markers in peritoneal dialysis patients. Ren Fail 35: 17–22, 2013 [DOI] [PubMed] [Google Scholar]
- 16.Zahed NS, Sharifi M, Karimi M, Nikbakht H: Impact of sertraline on serum concentration of CRP in hemodialysis patients with depression. J Renal Inj Prev 6: 65–69, 2016 [DOI] [PMC free article] [PubMed] [Google Scholar]
- 17.Taraz M, Khatami MR, Dashti-Khavidaki S, Akhonzadeh S, Noorbala AA, Ghaeli P, Taraz S: Sertraline decreases serum level of interleukin-6 (IL-6) in hemodialysis patients with depression: Results of a randomized double-blind, placebo-controlled clinical trial. Int Immunopharmacol 17: 917–923, 2013 [DOI] [PubMed] [Google Scholar]
- 18.Zhao C, Ma H, Yang L, Xiao Y: Long-term bicycle riding ameliorates the depression of the patients undergoing hemodialysis by affecting the levels of interleukin-6 and interleukin-18. Neuropsychiatr Dis Treat 13: 91–100, 2016 [DOI] [PMC free article] [PubMed] [Google Scholar]
- 19.Jain N, Trivedi MH, Rush AJ, Carmody T, Kurian B, Toto RD, Sarode R, Hedayati SS: Rationale and design of the Chronic Kidney Disease Antidepressant Sertraline Trial (CAST). Contemp Clin Trials 34: 136–144, 2013 [DOI] [PMC free article] [PubMed] [Google Scholar]
- 20.Amorim P, Lecrubier Y, Weiller E, Hergueta T, Sheehan D: DSM-IH-R Psychotic Disorders: Procedural validity of the Mini International Neuropsychiatric Interview (MINI). Concordance and causes for discordance with the CIDI. Eur Psychiatry 13: 26–34, 1998 [DOI] [PubMed] [Google Scholar]
- 21.Sheehan DV, Lecrubier Y, Sheehan KH, Amorim P, Janavs J, Weiller E, Hergueta T, Baker R, Dunbar GC: The Mini-International Neuropsychiatric Interview (M.I.N.I.): The development and validation of a structured diagnostic psychiatric interview for DSM-IV and ICD-10. J Clin Psychiatry 59[Suppl 20]: 22–33; quiz 34–57, 1998 [PubMed] [Google Scholar]
- 22.Rush AJ, Trivedi MH, Ibrahim HM, Carmody TJ, Arnow B, Klein DN, Markowitz JC, Ninan PT, Kornstein S, Manber R, Thase ME, Kocsis JH, Keller MB: The 16-Item Quick Inventory of Depressive Symptomatology (QIDS), clinician rating (QIDS-C), and self-report (QIDS-SR): A psychometric evaluation in patients with chronic major depression. Biol Psychiatry 54: 573–583, 2003 [DOI] [PubMed] [Google Scholar]
- 23.Hedayati SS, Minhajuddin AT, Toto RD, Morris DW, Rush AJ: Validation of depression screening scales in patients with CKD. Am J Kidney Dis 54: 433–439, 2009 [DOI] [PMC free article] [PubMed] [Google Scholar]
- 24.Xiong GL, Prybol K, Boyle SH, Hall R, Streilein RD, Steffens DC, Krishnan R, Rogers JG, O’Connor CM, Jiang W; SADHART-CHF Investigators: Inflammation markers and major depressive disorder in patients with chronic heart failure: Results from the sertraline against depression and heart disease in chronic heart failure study. Psychosom Med 77: 808–815, 2015 [DOI] [PMC free article] [PubMed] [Google Scholar]
- 25.Ko GJ, Kim MG, Yu YM, Jo SK, Cho WY, Kim HK: Association between depression symptoms with inflammation and cardiovascular risk factors in patients undergoing peritoneal dialysis. Nephron Clin Pract 116: c29–c35, 2010 [DOI] [PubMed] [Google Scholar]
- 26.Hung KC, Wu CC, Chen HS, Ma WY, Tseng CF, Yang LK, Hsieh HL, Lu KC: Serum IL-6, albumin and co-morbidities are closely correlated with symptoms of depression in patients on maintenance haemodialysis. Nephrol Dial Transplant 26: 658–664, 2011 [DOI] [PubMed] [Google Scholar]
- 27.Bossola M, Di Stasio E, Giungi S, Rosa F, Tazza L: Fatigue is associated with serum interleukin-6 levels and symptoms of depression in patients on chronic hemodialysis. J Pain Symptom Manage 49: 578–585, 2015 [DOI] [PubMed] [Google Scholar]
- 28.Bornivelli C, Aperis G, Giannikouris I, Paliouras C, Alivanis P: Relationship between depression, clinical and biochemical parameters in patients undergoing haemodialysis. J Ren Care 38: 93–97, 2012 [DOI] [PubMed] [Google Scholar]
- 29.Więdłocha M, Marcinowicz P, Krupa R, Janoska-Jaździk M, Janus M, Dębowska W, Mosiołek A, Waszkiewicz N, Szulc A: Effect of antidepressant treatment on peripheral inflammation markers - a meta-analysis. Prog Neuropsychopharmacol Biol Psychiatry 80: 217–226, 2018 [DOI] [PubMed] [Google Scholar]
- 30.Simic Ogrizovic S, Jovanovic D, Dopsaj V, Radovic M, Sumarac Z, Bogavac SN, Stosovic M, Stanojevic M, Nesic V: Could depression be a new branch of MIA syndrome? Clin Nephrol 71: 164–172, 2009 [DOI] [PubMed] [Google Scholar]
- 31.Choi MJ, Seo JW, Yoon JW, Lee SK, Kim SJ, Lee YK, Noh JW, Koo JR: The malnutrition-inflammation-depression-arteriosclerosis complex is associated with an increased risk of cardiovascular disease and all-cause death in chronic hemodialysis patients. Nephron Clin Pract 122: 44–52, 2012 [DOI] [PubMed] [Google Scholar]
- 32.Kim JK, Kim SG, Kim HJ, Song YR: Serum S100B protein is associated with depressive symptoms in patients with end-stage renal disease. Clin Biochem 45: 1573–1577, 2012 [DOI] [PubMed] [Google Scholar]
- 33.Haverkamp GL, Loosman WL, Schouten RW, Franssen CF, Kema IP, van Diepen M, Dekker FW, Siegert CE, Honig A: Differences in the association of inflammation and tryptophan with depressive symptoms between white and non-white chronic dialysis patients. Gen Hosp Psychiatry 50: 76–82, 2018 [DOI] [PubMed] [Google Scholar]
- 34.Brys ADH, Di Stasio E, Lenaert B, Sanguinetti M, Picca A, Calvani R, Marzetti E, Gambaro G, Bossola M: Serum interleukin-6 and endotoxin levels and their relationship with fatigue and depressive symptoms in patients on chronic haemodialysis. Cytokine 125: 154823, 2020 [DOI] [PubMed] [Google Scholar]
- 35.Gregg LP, Jain N, Carmody T, Minhajuddin AT, Rush AJ, Trivedi MH, Hedayati SS: Fatigue in nondialysis chronic kidney disease: Correlates and association with kidney outcomes. Am J Nephrol 50: 37–47, 2019 [DOI] [PMC free article] [PubMed] [Google Scholar]
- 36.Haverkamp GLG, Loosman WL, Schouten RW, Franssen CFM, Kema IP, van Diepen M, Dekker FW, Chandie Shaw PK, Smets YFC, Vleming LJ, van Jaarsveld BC, Honig A, Siegert CE: Longitudinal associations between inflammation and depressive symptoms in chronic dialysis patients. Psychosom Med 81: 74–80, 2019 [DOI] [PubMed] [Google Scholar]
- 37.Tynan RJ, Weidenhofer J, Hinwood M, Cairns MJ, Day TA, Walker FR: A comparative examination of the anti-inflammatory effects of SSRI and SNRI antidepressants on LPS stimulated microglia. Brain Behav Immun 26: 469–479, 2012 [DOI] [PubMed] [Google Scholar]
Associated Data
This section collects any data citations, data availability statements, or supplementary materials included in this article.
Supplementary Materials
Inflammatory markers and total QIDS-C16 scores at baseline and week 12 based on treatment assignment. Download Supplementary Table 1, PDF file, 273 KB (272.2KB, pdf)
Inflammatory markers and total QIDS-C16 scores at baseline and week 12 based on treatment improvement (3-point decrease in QIDS-C16). Download Supplementary Table 2, PDF file, 273 KB (272.2KB, pdf)
Inflammatory markers and total QIDS-C16 scores at baseline and week 12 based on treatment improvement (3-point decrease in QIDS-C16) in the sertraline group. Download Supplementary Table 3, PDF file, 273 KB (272.2KB, pdf)
Inflammatory markers and total QIDS-C16 scores at baseline and week 12 on treatment improvement (3-point decrease in QIDS-C16) in the placebo group. Download Supplementary Table 4, PDF file, 273 KB (272.2KB, pdf)
Inflammatory markers and total QIDS-C16 scores at baseline and week 12 on treatment improvement (3-point decrease in QIDS-C16). Download Supplementary Table 5, PDF file, 273 KB (272.2KB, pdf)
Inflammatory markers and total QIDS-C16 scores at baseline and week 12 based on treatment response (≥50% decrease in QIDS-C16). Download Supplementary Table 6, PDF file, 273 KB (272.2KB, pdf)
Inflammatory markers and total QIDS-C16 scores at baseline and week 12 based on treatment response (≥50% decrease in QIDS-C16) in the sertraline group. Download Supplementary Table 7, PDF file, 273 KB (272.2KB, pdf)
Inflammatory markers and total QIDS-C16 scores at baseline and week 12 based on treatment response (≥50% decrease in QIDS-C16) in the placebo group. Download Supplementary Table 8, PDF file, 273 KB (272.2KB, pdf)
Inflammatory markers and total QIDS-C16 scores at baseline and week 12 on treatment response (≥50% decrease in QIDS-C16). Download Supplementary Table 9, PDF file, 273 KB (272.2KB, pdf)