Abstract
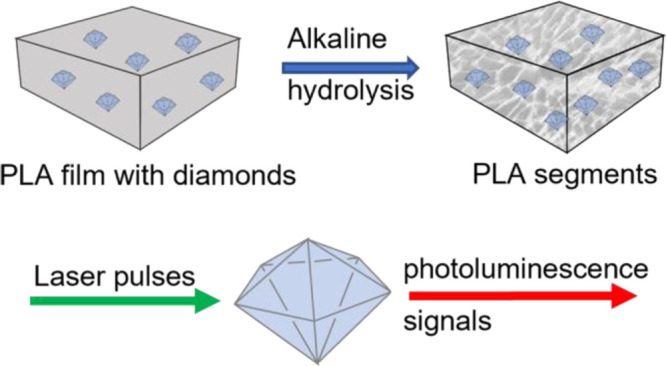
Degradable polymers are widely used in the biomedical fields due to non-toxicity and great biocompatibility and biodegradability, and it is crucial to understand how they degrade. These polymers are exposed to various biochemical media in medical practice. Hence, it is important to precisely follow the degradation of the polymer in real time. In this study, we made use of diamond magnetometry for the first time to track polymer degradation with nanoscale precision. The method is based on a fluorescent defect in nanodiamonds, which changes its optical properties based on its magnetic surrounding. Since optical signals can be read out more sensitively than magnetic signals, this method allows unprecedented sensitivity. We used a specific mode of diamond magnetometry called relaxometry or T1 measurements. These are sensitive to magnetic noise and thus can detect paramagnetic species (gadolinium in this case). Nanodiamonds were incorporated into polylactic acid (PLA) films and PLA nanoparticles in order to follow polymer degradation. However, in principle, they can be incorporated into other polymers too. We found that T1 constants decreased gradually with the erosion of the film exposed to an alkaline condition. In addition, the mobility of nanodiamonds increased, which allows us to estimate polymer viscosity. The degradation rates obtained using this approach were in good agreement with data obtained by quartz crystal microbalance, Fourier-transform infrared spectroscopy, and atomic force microscopy.
Keywords: polymer degradation, nitrogen vacancy center, magnetometry, relaxometry, nanodiamonds
Understanding material degradation is an important area within material science.1 Degradable polymeric materials, such as PLA, polycaprolactone (PCL), PGA or thermoplastics, and hydrogels of natural and synthetic origin, are increasingly popular for biomedical applications.2,3 They are easy to process and functionalize and have tunable mechanical properties, often low toxicity, and controlled degradation times. Their applications include the treatment of cancer,4 the development of vaccines,5 the manufacture of nanoparticles with increased plasma half-life,5−7 scaffolds for cell culture, and tissue regeneration or drug delivery.8
Here, we investigate the degradation of polylactic acid as a model system. This polymer is widely used for instance in tissue engineering,9 drug delivery,10 or wound management.11
There are several methods that can be used for studying material degradation. Imaging methods such as atomic force microscopy (AFM) and scanning force microscopy reveal changes in the surface morphology,12 while spectroscopic tools such as infrared spectroscopy (IR), X-ray photoelectron spectroscopy (XPS),13 or Raman spectroscopy reveal changes in chemical composition.14 However, none of them allow straightforward and time-efficient tracking of polymer degradation time in real time with high precision. Our aim here is to evaluate the usefulness of diamond magnetometry for this purpose.
Diamond magnetometry is a new technique that allows nanoscale magnetic resonance measurements.15 It is based on defects in diamond, which change their optical properties based on their magnetic surrounding. Since the optical signals are easier to read out, this method offers unprecedented sensitivity down to the single spin level.16 This technique has already been successfully applied to measuring magnetic structures,17,18 spin labels,19 ions in solution,20 iron-containing proteins,21 or free radicals.22 Recently, the temperature,23,24 orientation,25 or even metabolic activity26,27 has been detected with this technique within living cells. Polymers including diamonds have been used for several applications28 including generating sensitivity for changes in pH,29 protecting diamond-sensing particles from attracting a protein corona,30 drug delivery,31 or for preventing aggregation.32 Yet, diamond magnetometry has not been used before for sensing polymer properties themselves, which is shown here. In this study, a home-made magnetometry setup was used to investigate degradation of an exemplary polymer (PLA) under different pH conditions via measuring relaxation time and tracking the displacement of diamond. The derived degradation was compared to the data obtained using conventional techniques, namely, AFM, fourier transform infrared spectroscopy (FTIR), and quartz crystal microbalance (QCM). The PLA has degraded much quicker around pH = 13 than at neutral pH. This degradation led to a sharp decrease in the relaxation of nitrogen-vacancy (NV) center spins. A schematic representation of the experiments is shown in Figure 1.
Figure 1.
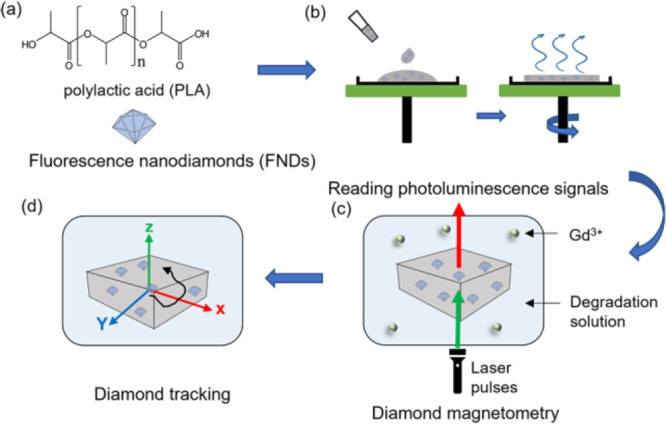
Overview of PLA film preparation and degradation experiment. (a) Compounds of the polymer film: poly (l-lactic acid) (PLA) and fluorescent nanodiamonds (FNDs). (b) FND sensors are embedded in the polymer by simple mixing, and spin-coating is used to produce a thin film. (c) The PLA film containing nanodiamond sensors is immersed in a degradation medium, which contains Gd3+. When the film is degraded, Gd3+ (green dots) can come closer to the nanodiamonds and thus leads to an increase in spin noise, which can be detected by a home-made magnetometry setup. (d) Particle tracking is used to evaluate polymer degradation in real time.
Experimental Section
Materials
PLA was purchased from Sigma-Aldrich. Its molecular weight and Mw/Mn are about 260,000 and 1.5, respectively. Its viscosity is about 2.0 dL/g, 0.1% (w/v) in chloroform (25 °C). Sodium hydroxide pellets, chloroform, and gadolinium chloride were purchased from Sigma-Aldrich. Fluorescent nanodiamonds (FNDs) with a hydrodynamic mean diameter around 70 nm were purchased from Adamas Nanotechnologies. These particles are produced by high-pressure high-temperature synthesis followed by size separation and irradiation (3 MeV electrons at a fluence of 5 × 10¹⁹ e/cm2).33 As a result of the irradiation, nanodiamonds contain 300 nitrogen-vacancy centers per diamond on average. Thus, every measurement is essentially an average of 300 individual sensors within one particle and reproducibility is greatly enhanced over single defect sensing. These particles are widely used and have been extensively characterized before.34,35 Au-coated quartz crystals (QSX301, 4.95 MHz, available from Biolin Scientific, Sweden) were used for Quartz crystal microbalance measurements with dissipation monitoring.
AFM Observation of Morphology
The morphology and roughness of the films are altered during exposure to different media, and thus are helpful when characterizing degradation behavior.12 AFM is an excellent tool for exploring surface morphology and monitoring roughness. Here, we used AFM to observe morphology and roughness of PLA films with or without degradation. To prepare the samples, 50 μL of PLA solution in chloroform (5 mg/mL) was dropped on the silicon wafer (N-type, contains no dopant, diam. × thickness 3 in. × 0.5 mm, Sigma-Aldrich). The polymer films were prepared by spin-coating with 30 rpm for 5 min. The thin films were treated with a solution of pH 7 (PBS), pH 10 (NaOH), and pH 13 (NaOH) for different times (0, 30, 60, 120, and 300 min). Degradation was performed at room temperature. To remove salt residues from the surface of PLA films, the films were rinsed twice with Milli-Q water and dried with nitrogen before scanning. AFM (Nanoscope IV Dimension tm 3100, USA) experiments were performed using contact mode in the air with a V-shaped silicon cantilever (force constant: 0.35 N/m, tip curvature radius: <10.0 nm, and a cone angle of 20°) equipped with a dimension hybrid XYZ SPM scanner head (Veeco, New York, USA). The scanned surface area for each image was 5 × 5 μm, and at least three replicates were tested. The roughness parameters Ra (arithmetic mean roughness) and Rq (root-mean-square (RMS) roughness) were obtained.
QCM Detection of Degradation
Quartz crystal microbalance with dissipation monitoring (QCM-D) is an extension of QCM, the parameter D is the dissipation factor, which provides real-time information on the softness of the adsorbed layer on the sensor surface. QCM-D is a sensitive technique to monitor properties of polymer films in real time. This method can detect changes of mass, thickness, and viscoelasticity of films on the surface of quartz oscillators. Hence, many researchers have used this tool to observe the degradation of polymer films.12,36 A Q-Sense E4 module (Q-sense, Gothenburg, Sweden) containing four sensors, to run four samples in parallel, was used. Sensors and flow cells were cleaned before each experiment as follows: sensors were immersed in a mixture of 3:1:1 of Milli-Q water, ammonia (25%), and hydrogen peroxide (30%) at 75 °C for 5 min. Then, the sensors were rinsed with Milli-Q water, dried with nitrogen, and treated with UV/ozone for 10 min. The flow cells were cleaned with 2 wt % of sodium dodecyl sulfate and Milli-Q water for 10 min. Afterward, the PLA pellets were dissolved in chloroform to a concentration of 5 mg/mL. Then, Au-coated sensors were attached to the holder of the spin-coating device and 50 μL of PLA solution was pipetted onto the quartz plate. The holder was spun slowly at 30 rpm for 5 min to ensure that the film was dried completely. The whole process was carried out under a fume hood. Before the QCM-D measurement, a stable baseline was established by Milli-Q water for several minutes until the frequency was constant. Then, sensors coated with PLA films were exposed to solutions at pH 7(0.01 M PBS), pH 10, and pH 13(NaOH solution) to accelerate degradation. Changes in resonance frequency (ΔF) and dissipation (ΔD) were recorded within 360 min (25 °C, 50 μL/min) from three sensors simultaneously. The linear Sauerbrey relation (eq 1) was used to convert Δf to adsorbed or desorbed matter37
| 1 |
where Δm means change in mass, C is a mass constant, 17.7 ng/cm2/Hz for a 4.95 MHz crystal, related to the properties of quartz, and n is the overtone number (n = 3, 5,7, 9, etc.). The film thickness (δ) was calculated by using the density of PLA (ρ = 1210 kg/m3) and eq 2
| 2 |
Fourier-Transform Infrared Spectroscopy (FTIR) Characterization
Functional groups of polymers can be identified by FTIR. The films were prepared by spin-coating. The difference is that the Teflon Petri dish was used as a substrate, and then films were detached from the dish after complete drying. The degradation time points of FTIR were set to 0, 30, 60, 120, and 300 min. The infrared spectra of initial and degraded films were collected by a Cary 600 series FTIR Spectrometer (Agilent Technologies, Santa Clara, CA, USA) within 400–4000 cm–1 wavelengths. The total number of scans was set to 32 for a single spectrum with a spectral resolution of 4 cm–1. The transmission (T) scan type was used when infrared spectroscopy was performed. The absorbance (A) was calculated using the following logarithmic function (eq 3) between transmission and absorbance:
| 3 |
The degradation of the PLA film was assessed by calculating an absorbance ratio (eq 4) as follows:
| 4 |
The x stands for different peaks related to the PLA degradation process, and the 1455 cm–1 band (methyl absorption peak) can be represented by the simple equation
| 5 |
where BC is the height of baseline and AC is depicted as the absolute intensity of the functional group band related to the reference group.
T1 Measurements
Here, we used a specific type of diamond magnetometry measurements called T1 or relaxometry measurements. FND stock solution (1 mg/mL) was mixed into 5 mg/mL PLA in chloroform solution to produce a 0.1% weight ratio of FNDs. Fifty microliters of the mixture was dropped onto the 35 mm plastic Petri dishes. The polymer films with FNDs were prepared by spin-coating with 30 rpm for 5 min until the solution was completely evaporated. Experiments were carried out by adding degradation solution of pH 7, 10, or 13 with 10 nM gadolinium chloride. The experiments were conducted on a home-made magnetometry similar to instruments used in the field and described earlier.38 For light collection, we used a 100× magnification oil objective (Olympus, UPLSAPO 100XO). To perform a T1 measurement, specific defects called nitrogen vacancy centers in nanodiamonds were excited with a green laser. As a result, they were pumped in the brighter ms = 0 state of the ground state. Over time, the NV– centers relaxed back to the less bright thermal equilibrium. This can be detected optically by measuring brightness after a varying dark time. The relaxation process occurs faster in the presence of spin noise (in this case from gadolinium ions). We implemented the ability to pulse the laser with an acousto-optical modulator (Gooch & Housego, model 3350-199) to conduct the pulsing sequence that is shown in Figure 2. More specifically, a train of 5 μs green laser pulses (532 nm) with dark times between 200 ns and 10 ms was used to excite the NV centers. For detection, we used a 550 nm long-pass filter to eliminate unaltered laser light and an avalanche photodiode (APD) (Excelitas, SPCM-AQRH). We repeated the pulse sequence 10,000 times for each T1 measurement to reduce noise. While a single measurement only lasts a few hundred microseconds, the entire sequence including repetitions lasts around 16 min. The optically detected T1 signals obtained in the measurement are equivalent to T1 signals in conventional magnetic resonance imaging but for nanoscale voxels. The data were analyzed by using a two-exponential model.22 In short, this model assumes that an ensemble of NV centers can be approximated as a part with short T1 and a part with long T1. The model reveals two-time constants for these two sub-ensembles. We used the longer time constant since it has proven to be more sensitive to changes in the environment. A calibration that links T1 with a gadolinium concentration can be found in ref (22).
Figure 2.
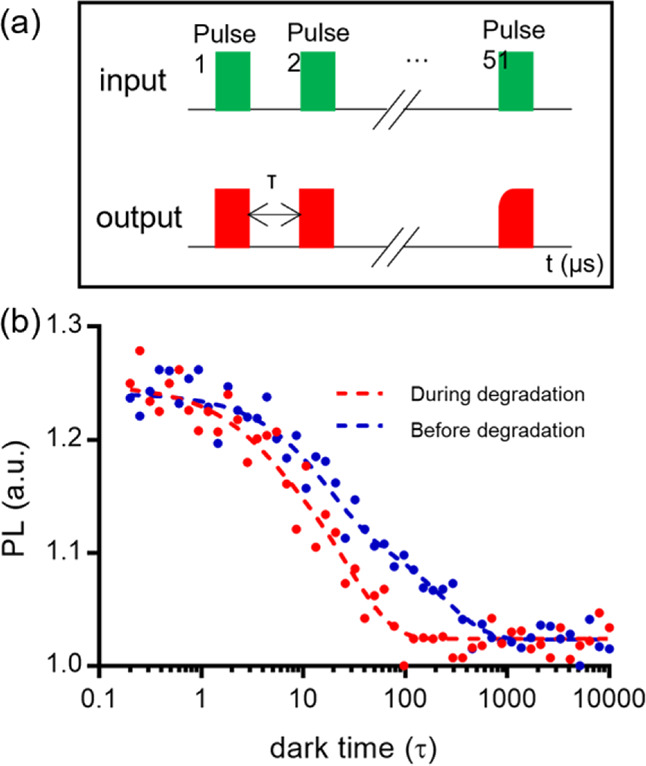
T1 relaxation measurements: (a) pulsing sequence for a T1 measurement. The green pulse indicates that the laser is turned on. During the pulse the NV centers are initialized into the bright ms = 0 state of their ground state. Between laser pulses the NV centers are allowed to relax during a variable dark time τ. During this time, NV centers return to the darker equilibrium between ms = 0 and ms = ±1. The read out is shown in red and has a different shape depending on the distribution of the ms states. In the presence of spin noise (from Gd in this case), the decay in photoluminescence (PL) shown in (b) occurs faster. Panel (b) shows an example of a T1 curve before and after degradation of the PLA film. In the blue decay curve, the diamond is further away from Gd3+ before the degradation of PLA and then in the red curve after degradation.
Nanodiamond Tracking
After identifying a particle via its fluorescence, the tracking algorithm was started. The algorithm consists of scanning the known area in a set window (10 × 10 μm) with a set number of pixels (50 × 50). This gives us an image of the FND. The intensity is projected on the x axis and a Gaussian is fitted through this intensity profile. Based on the Gaussian, the voxel with the highest intensity in x is determined. The same is done in the y direction. This gives a new location for the particle in x and y. Afterward, the point at the maximum is scanned in the z direction. The point with the highest intensity is taken as the corrected z. This process is repeated for a set number of repetitions to fit the time window. During degradation, the particle is increasingly mobile, which can be seen by an increase in movement. This is measured by calculating the diffusion coefficient (D, μm/s) for the complete track. The diffusion coefficient is calculated as explained in ref (39). The diffusion coefficient depends on the mean square displacement, velocity of the particle, and the α coefficient. The exact relation depends on the type of motion the particle undergoes at the time. The type of motion is determined by fitting the mean square displacement with the different types of motions and selecting the type of motion with the best fit.
Incorporation of FNDs into Polymer Nanoparticles
PLA nanoparticle-loaded FNDs were prepared using the solvent emulsion evaporation method. PLA was dissolved in chloroform to a concentration of 10 mg/mL. Then, 70 nm FNDs (2%, w(FNDs)/w(PLA)) were mixed with chloroform containing PLA. PVA (1%, w/v) was dissolved in Milli-Q water under 90°, which is used as the dispersant to stabilize emulsion and form nanoparticles. The organic phase and aqueous phase were mixed, and then tip-sonication for 3 min over an ice bath was done. Then, the emulsion was magnetically stirred overnight at room temperature while the chloroform was evaporated. Subsequently, nanoparticles were collected and washed three times with Milli-Q water via centrifugation at 10,000 rpm for 15 min and removing the supernatant. Nanoparticles were resuspended in water and stored at 4 °C until usage.
Statistics
All data were presented as mean ± standard deviation. Statistical significance was determined with Graphpad Prism 8.0.1 by a one-way ANOVA or ordinary two-way ANOVA followed by Tukey’s multiple comparison test. P < 0.05 is considered statistically significant (*P < 0.05, **P < 0.01, ***P < 0.001, and ****P < 0.001). The AFM images processing and the roughness evaluation of films were performed with Nanoscope analysis version 1.80. Origin pro 9.0 software (Origin Lab Corporation, Northampton, MA, USA) was used to plot FTIR graphs and measured peak height.
Results and Discussion
PLA Film Surface Morphology and Roughness
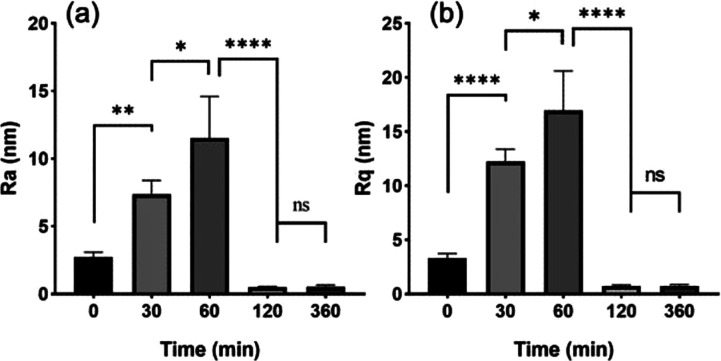
AFM can characterize the sample surface, allowing the measurement of parameters such as roughness and uniformity of the sample surface. It has become an important tool for the characterization of polymer degradation.40,41 The PLA film surface and roughness during degradation was observed by AFM. Figure 3 shows 3D images as well as height profiles of PLA samples after 0, 30, 60, 120, and 360 min of incubation at pH 13. We can see a dramatic change in surface morphology from AFM images and corresponding Ra (arithmetic mean roughness) and Rq (root-mean-square (RMS) roughness) results over increasing incubation times. The roughness Ra and Rq of the film, shown in Figure 4, before degradation were 2.7 ± 0.37 nm and 3.3 ± 0.43 nm, respectively, while Ra and Rq increased significantly to 7.3 ± 1.0 nm and 12.2 ± 1.17 nm after 30 min of degradation. Sixty minutes after degradation, Ra and Rq were 11.5 ± 3.10 nm and 16.7 ± 3.65 nm, respectively. This shows that the degradation of pH 13 increases surface roughness within 60 min. After 120 or 240 min degradation, the film is completely degraded. For pH 7 and pH 10, film morphology images and roughness values after degradation were similar to those of the untreated surface (see the Supporting Information, Figure S1A,C). Statistically, roughness Ra and Rq values have no significant difference against each other (to see Figure S1B,D), which indicated that the film barely degraded in neutral and weakly alkaline environments. The degradation times determined from these experiments were used during the remainder of the manuscript.
Figure 3.
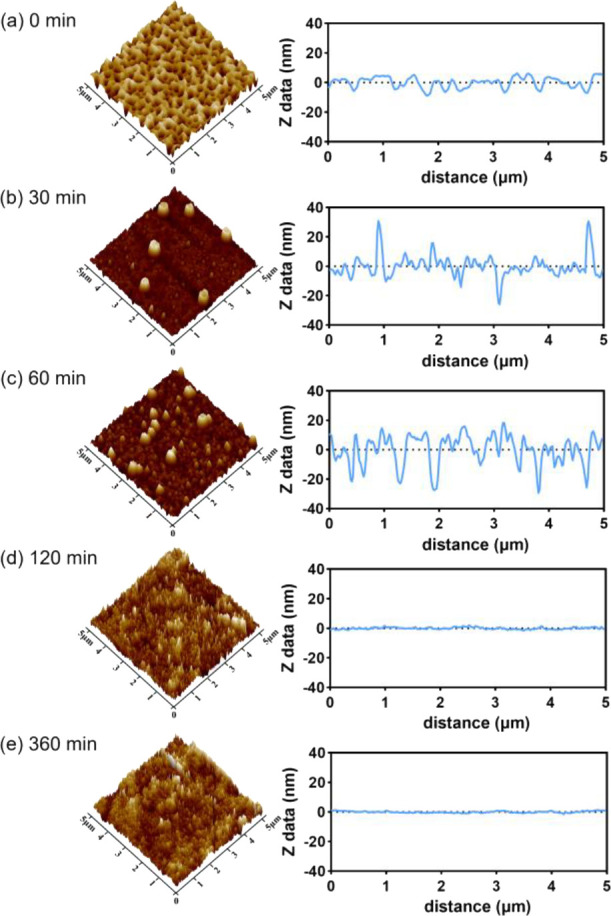
Contact mode AFM images of PLA film surfaces (the left column) and profilograms along a line across the surface (the right column). Panel (a) shows the PLA film before degradation at pH 13 (b) after 30 min, (c) 60 min, (d) 120 min, and (e) 360 min of degradation, respectively.
Figure 4.
Corresponding surface roughness parameters, (a) arithmetic mean roughness Ra values and (b) RMS roughness Rq, were calculated from the AFM images before and after incubation in a degradation medium at pH 13 for different times.
QCM-D Analysis of PLA Thin Film Degradation
The progress of degradation was further confirmed by QCM as shown in Figure 5. The raw data for ΔF and ΔD are shown in Figure S2. Figure S3 shows the conversion of these data into mass changes. The mass was further converted into a film thickness considering PLA’s density using eq 2. Similar to the AFM experiments, the PLA films were treated with solutions at different pH for 360 min, and the real-time changes of resonance frequency (ΔF) and dissipation (ΔD) were monitored at different overtones (3, 5, 7, 9, and 11). The ΔF 3 data was used to analyze film mass and thickness because in the third overtone of the quartz crystal, the best energy trapping can be performed.42 No significant changes occurred when the initial Milli-Q water was replaced with PBS at pH 7. Throughout the experiment, the mass and thickness remained constant, which proved that the film was not softened and did not degrade in pH 7. When Milli-Q water in the QCM cell was replaced with the pH 13 solution, the film thickness first increased slightly, which was probably due to swelling. Afterward, a rapid decrease in thickness was observed until the curve leveled off for incubation longer than 120 min. At the same time, the dissipation first increased and then decreased, indicating that the film softened first and was totally degraded during the degradation. At pH 10, the decrease in frequency was less pronounced, indicating a slow degradation. Hence, the variation of surface morphology and roughness of the film observed by AFM was consistent with the thickness and mass changes of QCM.
Figure 5.
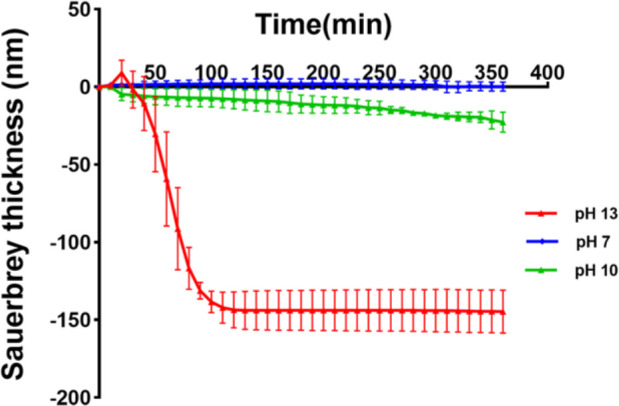
Thickness versus time plot at pH 7, pH 10, and pH 13 solutions at 25 °C. The thickness was obtained using the Sauerbrey eq 2. Corresponding ΔF, ΔD, and Δm data are shown in Figures S2 and S3 in the Supporting Information.
FTIR Spectrum Characterization
To determine the chemical composition of the films incubated in degradation solution over time, we compared spectra (0 min) of non-degraded and degraded films at different times. The results are shown in Figure S4. We found that spectra of non-degraded films show the expected absorbance bands. During the course of degradation, the spectra remained similar. All of them have the following typical absorption bonds: C–H stretching (asymmetric and symmetric band) at 2998 and 2944 cm–1, C=O carbonyl stretching at 1750 cm–1, CH3 stretching at 1454 cm–1, C–H deformation vibration at 1382 and 1362 cm–1, and −CH–O– and −O–C=O stretching of C–O bands at 1185 and 1090 cm–1.43,44 According to Araque-Monrós et al., the carbon of the ester groups in PLA chains is attacked by the hydroxyl ions under the basic condition,45 and then the ester linkage will finally produce carboxylic and hydroxyl end-group; the schematic diagram is shown in Figure 6. This way, the alkaline conditions can accelerate the degradation rate by rendering the PLA film more hydrophilic. Therefore, the C=O peak in 1750 cm–1 and C–O peaks at 1185 and 1090 cm–1 were related to film degradation. The intensity of peak ratio was evaluated to follow the degradation of polymer. Methyl at 1454 cm–1 was used as the internal reference peak of PLA. Figure 7 shows the changes of peak ratios for these three peaks. We found that all ratio intensities (1750, 1185, and 1090 cm–1) suffered a significant decrease only when exposed to the pH 13 solution, and the degradation tendency decreased rapidly from 0 to 120 min and then remained stable. This agrees with AFM and QCM results where we found similar degradation times.
Figure 6.
Scheme for alkaline hydrolysis of PLA; the ester linkage on PLA backbone chains is cleaved into carboxylic and hydroxyl ended chains.
Figure 7.
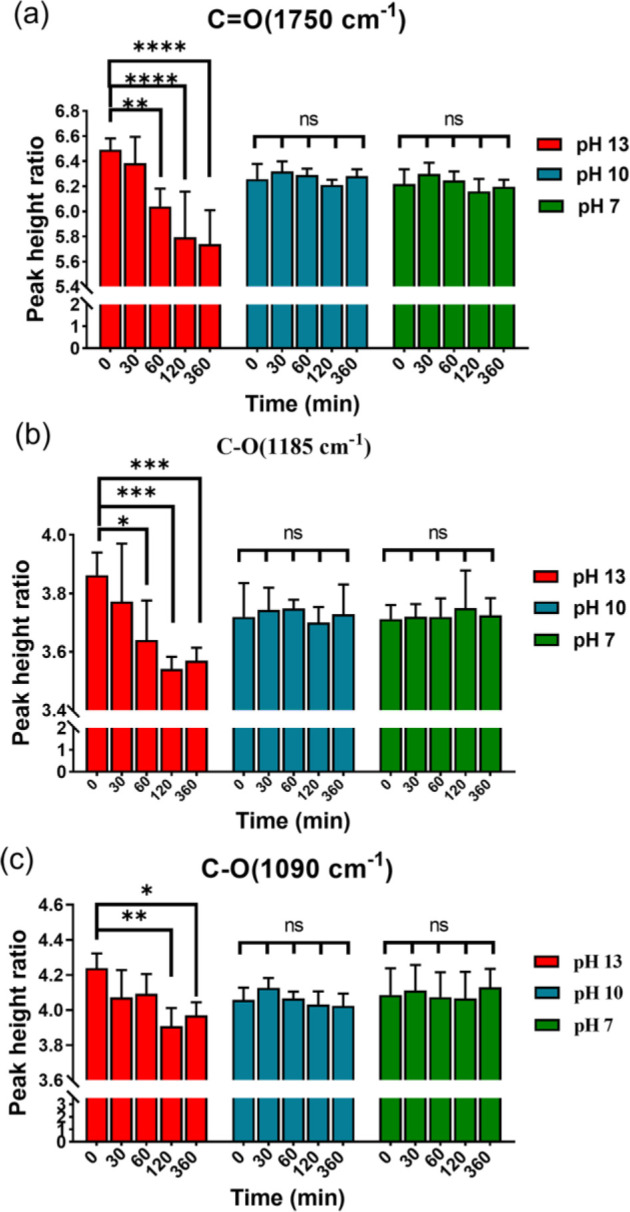
Absorbance height ratio of different characteristic bands related to degradation determined by FTIR.
T1 Relaxation Measurements
To assess PLA degradation using T1 measurements, 0.1 wt % FNDs were mixed into the polymer prior to film formation. This small concentration of FNDs was sufficient to obtain clear readout. A confocal picture of FNDs inside of the PLA film, confirming homogeneous distribution of particles, is shown in Figure S5. To determine whether 0.1 wt % of 70 nm FNDs will affect the degradation of a PLA film, we followed the degradation of a PLA film with FNDs and PLA film without FNDs in the pH 13 solution for 360 min by QCM (shown in Figure S6). We observed that the resonance frequency (ΔF) behaved almost the same in both polymers with no significant difference between the two curves. Then, we measured the T1 of several FNDs twice every hour. We degraded the polymer by adding 20 μL of a degradation solution at pH 7, 10, or 13 with 10 nM Gadolinium chloride. The gadolinium ions (Gd3+) act as a spin noise source, therefore reducing the T1 when in the vicinity of the FND. The polymer itself forms a barrier between the FND and Gd3+. Due to the subsequent degradation of the polymer, Gd3+ can approach the FND. Figure 8 shows the T1 value at different time points of the polymer degradation over the course of 4 h. Figure 8a shows that the T1 clearly decreased over time in the solution with pH = 13 but becomes more stable near the end. The increase in T1 in 60 min may be due to swelling of the film after adding the solution, which reduces the signal that FNDs feel from Gd3+. We did the same experiment with pH 10 and pH 7 solutions, as shown in Figure 8b,c. The graphs do not show a trend, and there is no significant change visible at pH 10 and pH 7. This indicates that the polymer film was difficult to degrade rapidly under both conditions. These results are in a good agreement with the standard methods in terms of degradation timings. However, the results obtained here are in real time (unlike results from AFM) and local at the nanoscale (unlike QCM). It has to be noted that at this point, there is quite some variability in T1 values. There is uncertainty from variation between nanodiamonds and their location in the film. The variation between nanodiamonds is something that is known within the community and actively researched. Potential approaches to reduce the variability include size separation to improve size uniformity, altering the surface chemistry to be more uniform, and optimizing the fabrication process itself. There are for instance ways to produce more uniformly shaped nanodiamonds or control the environment of the NV centers.46 However, such particles are not available yet. There are a few things that we already do. We use relatively large particles containing ensembles. This greatly reduces variability. Additionally, we select particles with similar counts. This way, we ensure that we pick particles of a similar size. The other source of variability (which is greater than the previous one) is the location in the film. At this point, the only way to achieve this was choosing particles at a similar height, but this approach is of course limited by the confocal resolution.
Figure 8.
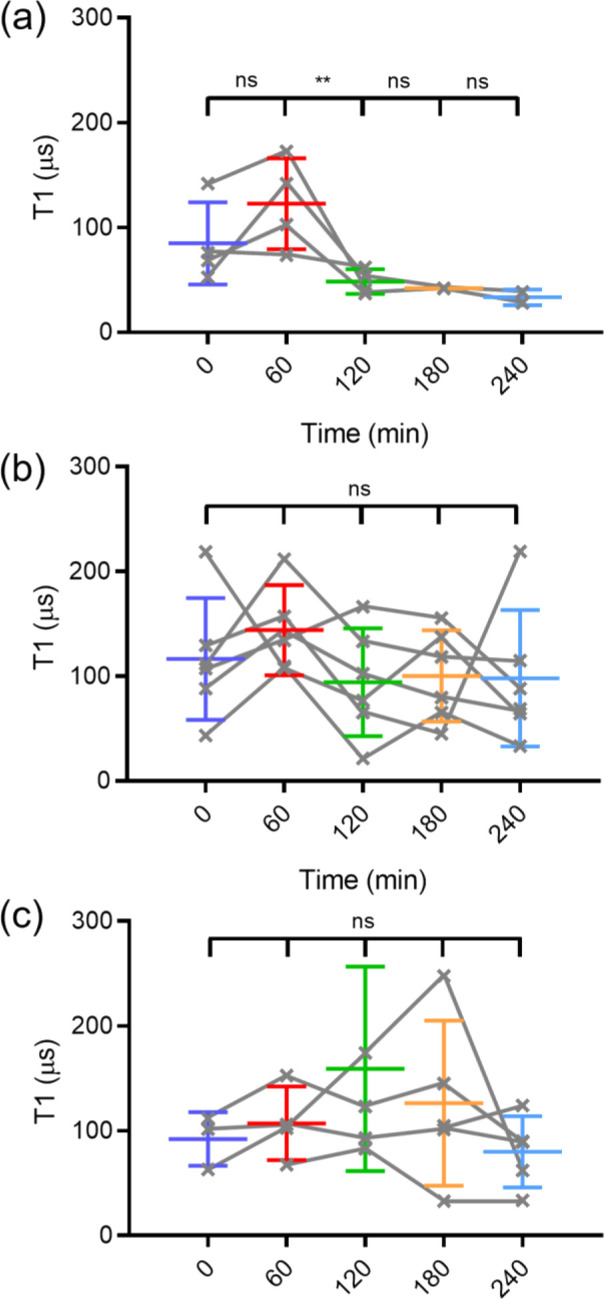
T1 results for degradation of the PLA films at (a) pH 13, (b) pH 10, and (c) pH 7. Gray lines indicate individual particle results, while the colored bars show averages. The error bars represent standard deviations.
Nanodiamond Tracking
We also followed polymer degradation by assessing the mobility of the nanodiamond during degradation. To track the particle, we first identified an FND in the film. Ideally, this FND was not too large (around 1–5 million counts/seconds), but the particle was easy to identify compared to the background. After identification, the algorithm to track the FND was started. Immediately, either nothing (to measure systematic drift), pH 7 solution as a control, or different degradation media (pH 10 and pH 13) were added. The FND was tracked for 360 min. During this time, the location in x, y and z directions were recorded. We calculated the diffusion coefficient as a measure of how freely the particle moves for different degradation conditions for five different films. The results are shown in Figure 9 as well as Figures S7–S9 in the Supporting Information. We show clearly that the particles under the strong degradation condition (pH 13, red) increase in freedom of movement for the first 3 h compared to the other conditions. After that we observed a drop in D. The reason is that particles eventually sink to the bottom or go into solution (in this case, we lose the particle since our tracking algorithm is not fast enough to track a freely floating particle). These results agree with the methods mentioned before. However, we obtain slightly different information here since this method reveals how freely particles can move in the polymer, which can complement T1 measurements.
Figure 9.
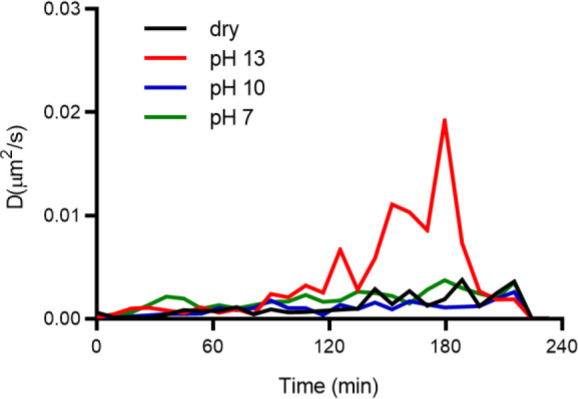
Diffusion coefficient of FNDs in the polymer films under different degradation conditions. The four different conditions are shown in different colors: dry in black, pH 13 in red, pH 10 in blue, and pH 7 in green. For each condition, five different particles were tracked continuously over 220 min.
Degradation of PLA Nanoparticles
In order to demonstrate the capabilities of nanoscale sensing, we performed measurements in PLA nanoparticles. Figure 10 shows that the relaxometry results before and after the polymer particles have experienced degradation. In this configuration, it is possible to obtain information from single particles. Also, in this case, we were able to observe the expected decrease in T1 after degradation.
Figure 10.
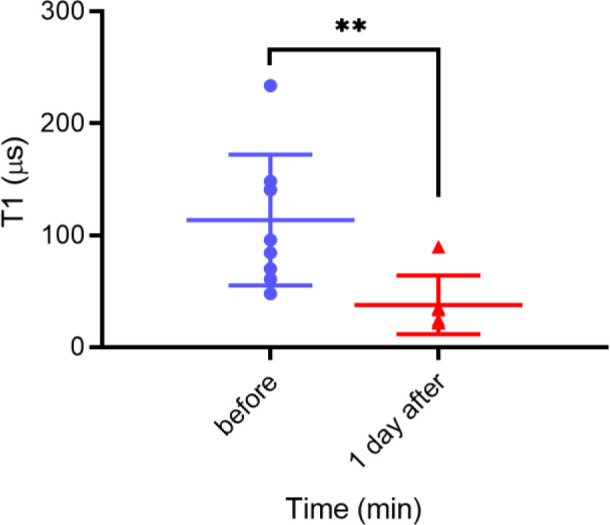
T1 results of the degradation of PLA nanoparticles containing 70 nm FNDs before and after degradation at pH 4.5 for 1 day at 1 μM Gd3+. The data were analyzed using Student’s t test, and statistical significance was accepted at *P ≤ 0.05 and **P ≤ 0.01.
Conclusions
In this study, relaxometry measurements as well as diamond particle tracking were applied for the first time in the field of polymer degradation studies. Using very small amounts of diamond nanoparticles (0.1 wt %), we were able to follow the degradation of PLA under different alkaline conditions. We also compared the T1 or magnetometry data with conventional methods including AFM, QCM, and FTIR. Using these techniques, we observed the changes in polymer film thickness, mass loss, and chemical groups. Unlike the conventional methods, relaxometry provides local measurements with nanoscale resolution. In addition, due to the stability of nanodiamond fluorescence, this method allows long-term tracking. T1 and tracking diamonds are expected to be also applicable in the degradation of other polymers and even to explore changes in the polymers being endocytosed within the cells.
Acknowledgments
We would like to thank M. Wlodarczyk-Biegun for support with supervision and editing. R.S. acknowledges financial support via an ERC starting grant (ERC STG – 714289) and a VIDI grant (016.Vidi.189.002). R.L. is thankful for a CSC scholarship from the Chinese government. A.M. is thankful for an LPDP scholarship from the Indonesian government.
Supporting Information Available
The Supporting Information is available free of charge at https://pubs.acs.org/doi/10.1021/acssensors.1c01782.
Measurement of PLA film morphology and mass loss, raw FTIR spectrum, confocal images of the PLA-FNDs film, degradation comparisons for the PLA film and PLA-FND film, trajectories for particle tracking, and tracking results with error bounds (PDF)
Author Contributions
# R.L. and T.V. contributed equally.
The authors declare no competing financial interest.
Supplementary Material
References
- Göpferich A. Mechanisms of polymer degradation and erosion. Biomaterials 1996, 17, 103–114. 10.1016/0142-9612(96)85755-3. [DOI] [PubMed] [Google Scholar]
- Nguyen M. K.; Lee D. S. Injectable biodegradable hydrogels. Macromol. Biosci. 2010, 10, 563–579. 10.1002/mabi.200900402. [DOI] [PubMed] [Google Scholar]
- Chiellini E.; Solaro R. Biodegradable polymeric materials. Adv. Mater. 1996, 8, 305–313. 10.1002/adma.19960080406. [DOI] [Google Scholar]
- Li Z.; Tan S.; Li S.; Shen Q.; Wang K. Cancer drug delivery in the nano era: An overview and perspectives. Oncol. Rep. 2017, 38, 611–624. 10.3892/or.2017.5718. [DOI] [PMC free article] [PubMed] [Google Scholar]
- Alonso M. J.; Cohen S.; Park T. G.; Gupta R. K.; Siber G. R.; Langer R. Determinants of release rate of tetanus vaccine from polyester microspheres. Pharm. Res. 1993, 10, 945–953. 10.1023/A:1018942118148. [DOI] [PubMed] [Google Scholar]
- Gref R.; Minamitake Y.; Peracchia M. T.; Trubetskoy V.; Torchilin V.; Langer R. Biodegradable long-circulating polymeric nanospheres. Science 1994, 263, 1600–1603. 10.1126/science.8128245. [DOI] [PubMed] [Google Scholar]
- Gopferich A.; Gref R.; Minamitake Y.; Shieh L.; Alonso M. J.; Tabata Y.; Langer R.. Drug delivery from bioerodible polymers: systemic and intravenous administration; ACS Symposium Series 567; American Chemical Society: Washington, DC, 1994, 15, 242–277. [Google Scholar]
- Kost J.; Langer R. Responsive polymer systems for controlled delivery of therapeutics. Trends Biotechnol. 1992, 10, 127–131. 10.1016/0167-7799(92)90194-Z. [DOI] [PubMed] [Google Scholar]
- Mitragotri S.; Lahann J. Physical approaches to biomaterial design. Nat. Mater. 2009, 8, 15–23. 10.1038/nmat2344. [DOI] [PMC free article] [PubMed] [Google Scholar]
- Fishbein I.; Chorny M.; Rabinovich L.; Banai S.; Gati I.; Golomb G. Nanoparticulate delivery system of a tyrphostin for the treatment of restenosis. J. Controlled Release 2000, 65, 221–229. 10.1016/S0168-3659(99)00244-8. [DOI] [PubMed] [Google Scholar]
- Brekke J. H.; Robert A. J.; Olson R. A.; Scully J. R.; Osbon D. B. Influence of polylactic acid mesh on the incidence of localized osteitis. Oral. Surg. Oral. Med. Oral. Pathol. 1983, 56, 240–245. 10.1016/0030-4220(83)90003-8. [DOI] [PubMed] [Google Scholar]
- Yamashita K.; Kikkawa Y.; Kurokawa K.; Doi Y. Enzymatic degradation of poly(L-lactide) film by proteinase K: quartz crystal microbalance and atomic force microscopy study. Biomacromolecules 2005, 6, 850–857. 10.1021/bm049395v. [DOI] [PubMed] [Google Scholar]
- Kearney L. T.; Howarter J. A. QCM-based measurement of chlorine-induced polymer degradation kinetics. Langmuir 2014, 30, 8923–8930. 10.1021/la501922u. [DOI] [PubMed] [Google Scholar]
- Kister G.; Cassanas G.; Bergounhon M.; Hoarau D.; Vert M. Structural characterization and hydrolytic degradation of solid copolymers of d, l-lactide-co-ε-caprolactone by Raman spectroscopy. Polymer 2000, 41, 925–932. 10.1016/S0032-3861(99)00223-2. [DOI] [Google Scholar]
- Schirhagl R.; Chang K.; Loretz M.; Degen C. L. Nitrogen-vacancy centers in diamond: nanoscale sensors for physics and biology. Annu. Rev. Phys. Chem. 2014, 65, 83–105. 10.1146/annurev-physchem-040513-103659. [DOI] [PubMed] [Google Scholar]
- Mamin H. J.; Kim M.; Sherwood M. H.; Rettner C. T.; Ohno K.; Awschalom D. D.; Rugar D. Nanoscale nuclear magnetic resonance with a nitrogen-vacancy spin sensor. Science 2013, 339, 557–560. 10.1126/science.1231540. [DOI] [PubMed] [Google Scholar]
- Maletinsky P.; Hong S.; Grinolds M. S.; Hausmann B.; Lukin M. D.; Walsworth R. L.; Loncar M.; Yacoby A. A robust scanning diamond sensor for nanoscale imaging with single nitrogen-vacancy centres. Nat. Nanotechnol. 2012, 7, 320–324. 10.1038/nnano.2012.50. [DOI] [PubMed] [Google Scholar]
- Le Sage D.; Arai K.; Glenn D. R.; DeVience S. J.; Pham L. M.; Rahn-Lee L.; Lukin M. D.; Yacoby A.; Komeili A.; Walsworth R. L. Optical magnetic imaging of living cells. Nature 2013, 496, 486–489. 10.1038/nature12072. [DOI] [PMC free article] [PubMed] [Google Scholar]
- Kaufmann S.; Simpson D. A.; Hall L. T.; Perunicic V.; Senn P.; Steinert S.; McGuinness L. P.; Johnson B. C.; Ohshima T.; Caruso F.; Wrachtrup J.; Scholten R. E.; Mulvaney P.; Hollenberg L. Detection of atomic spin labels in a lipid bilayer using a single-spin nanodiamond probe. Proc. Natl. Acad. Sci. U. S. A. 2013, 110, 10894–10898. 10.1073/pnas.1300640110. [DOI] [PMC free article] [PubMed] [Google Scholar]
- Gorrini F.; Giri R.; Avalos C. E.; Tambalo S.; Mannucci S.; Basso L.; Bazzanella N.; Dorigoni C.; Cazzanelli M.; Marzola P.; Miotello A.; Bifone A. Fast and Sensitive Detection of Paramagnetic Species Using Coupled Charge and Spin Dynamics in Strongly Fluorescent Nanodiamonds. ACS Appl. Mater. Interfaces 2019, 11, 24412–24422. 10.1021/acsami.9b05779. [DOI] [PubMed] [Google Scholar]
- Ermakova A.; Pramanik G.; Cai J. M.; Algara-Siller G.; Kaiser U.; Weil T.; Tzeng Y. K.; Chang H. C.; McGuinness L. P.; Plenio M. B.; Naydenov B.; Jelezko F. Detection of a few metallo-protein molecules using color centers in nanodiamonds. Nano Lett. 2013, 13, 3305–3309. 10.1021/nl4015233. [DOI] [PubMed] [Google Scholar]
- Perona Martínez F.; Nusantara A. C.; Chipaux M.; Padamati S. K.; Schirhagl R. Nanodiamond Relaxometry-Based Detection of Free-Radical Species When Produced in Chemical Reactions in Biologically Relevant Conditions. ACS. Sens. 2020, 5, 3862–3869. 10.1021/acssensors.0c01037. [DOI] [PMC free article] [PubMed] [Google Scholar]
- Simpson D. A.; Morrisroe E.; McCoey J. M.; Lombard A. H.; Mendis D. C.; Treussart F.; Hall L. T.; Petrou S.; Hollenberg L. C. L. Non-Neurotoxic Nanodiamond Probes for Intraneuronal Temperature Mapping. ACS Nano 2017, 11, 12077–12086. 10.1021/acsnano.7b04850. [DOI] [PubMed] [Google Scholar]
- Kucsko G.; Maurer P. C.; Yao N. Y.; Kubo M.; Noh H. J.; Lo P. K.; Park H.; Lukin M. D. Nanometre-scale thermometry in a living cell. Nature 2013, 500, 54–58. 10.1038/nature12373. [DOI] [PMC free article] [PubMed] [Google Scholar]
- McGuinness L. P.; Yan Y.; Stacey A.; Simpson D. A.; Hall L. T.; Maclaurin D.; Prawer S.; Mulvaney P.; Wrachtrup J.; Caruso F.; Scholten R. E.; Hollenberg L. C. L. Quantum measurement and orientation tracking of fluorescent nanodiamonds inside living cells. Nat. Nanotechnol. 2011, 6, 358–363. 10.1038/nnano.2011.64. [DOI] [PubMed] [Google Scholar]
- Morita A.; Nusantara A. C.; Martinez F. P. P.; Hamoh T.; Damle V. G.; van der Laan K. J.; Sigaeva A.; Vedelaar T.; Chang M.; Chipaux M.; Schirhagl R.. Quantum monitoring the metabolism of individual yeast mutant strain cells when aged, stressed or treated with antioxidant; arXiv 2020, arXiv:2007.16130, 2020.
- Nie L.; Nusantara A. C.; Damle V. G.; Sharmin R.; Evans E. P. P.; Hemelaar S. R.; van der Laan K. J.; Li R.; Perona M. F. P.; Martinez F. P.; Vedelaar T.; Chipaux M.; Schirhagl R. Quantum monitoring of cellular metabolic activities in single mitochondria. Sci. Adv. 2021, 7, eabf0573 10.1126/sciadv.abf0573. [DOI] [PMC free article] [PubMed] [Google Scholar]
- Behler K. D.; Stravato A.; Mochalin V.; Korneva G.; Yushin G.; Gogotsi Y. Nanodiamond-polymer composite fibers and coatings. ACS Nano 2009, 3, 363–369. 10.1021/nn800445z. [DOI] [PubMed] [Google Scholar]
- Rendler T.; Neburkova J.; Zemek O.; Kotek J.; Zappe A.; Chu Z.; Cigler P.; Wrachtrup J. Optical imaging of localized chemical events using programmable diamond quantum nanosensors. Nat. Commun. 2017, 8, 14701. 10.1038/ncomms14701. [DOI] [PMC free article] [PubMed] [Google Scholar]
- Rehor I.; Mackova H.; Filippov S. K.; Kucka J.; Proks V.; Slegerova J.; Turner S.; Van Tendeloo G.; Ledvina M.; Hruby M.; Cigler P. Fluorescent Nanodiamonds with Bioorthogonally Reactive Protein-Resistant Polymeric Coatings. Chempluschem. 2014, 79, 21–24. 10.1002/cplu.201300339. [DOI] [PubMed] [Google Scholar]
- Huynh V. T.; Pearson S.; Noy J. M.; Abboud A.; Utama R. H.; Lu H.; Stenzel M. H. Nanodiamonds with surface grafted polymer chains as vehicles for cell imaging and cisplatin delivery: enhancement of cell toxicity by POEGMEMA coating. ACS Macro Lett. 2013, 2, 246–250. 10.1021/mz4000199. [DOI] [PubMed] [Google Scholar]
- Neburkova J.; Vavra J.; Cigler P. Coating nanodiamonds with biocompatible shells for applications in biology and medicine. Curr. Opin. Solid. State. Mater. Sci. 2017, 21, 43–53. 10.1016/j.cossms.2016.05.008. [DOI] [Google Scholar]
- Shenderova O. A.; Shames A. I.; Nunn N. A.; Torelli M. D.; Vlasov I.; Zaitsev A. Review Article: Synthesis, properties, and applications of fluorescent diamond particles. J. Vac. Sci. Technol. B. Nanotechnol. Microelectron. 2019, 37, 030802 10.1116/1.5089898. [DOI] [PMC free article] [PubMed] [Google Scholar]
- Ong S. Y.; Chipaux M.; Nagl A.; Schirhagl R. Shape and crystallographic orientation of nanodiamonds for quantum sensing. Phys. Chem. Chem. Phys. 2017, 19, 10748–10752. 10.1039/C6CP07431F. [DOI] [PubMed] [Google Scholar]
- Hemelaar S. R.; de Boer P.; Chipaux M.; Zuidema W.; Hamoh T.; Martinez F. P.; Nagl A.; Hoogenboom J. P.; Giepmans B. N. G.; Schirhagl R. Nanodiamonds as multi-purpose labels for microscopy. Sci. Rep. 2017, 7, 720. 10.1038/s41598-017-00797-2. [DOI] [PMC free article] [PubMed] [Google Scholar]
- Clegg J. R.; Ludolph C. M.; Peppas N. A. QCM-D assay for quantifying the swelling, biodegradation, and protein adsorption of intelligent nanogels. J. Appl. Polym. Sci. 2020, 137, 48655. 10.1002/app.48655. [DOI] [PMC free article] [PubMed] [Google Scholar]
- Sauerbrey G. Use of quartz crystals for weighing thin layers and for microweighing. Zt. Phys. 1959, 155, 206–222. 10.1007/BF01337937. [DOI] [Google Scholar]
- Morita A.; Hamoh T.; Martinez F. P. P.; Chipaux M.; Sigaeva A.; Mignon C.; Laan K. J. V.; Hochstetter A.; Hamoh T.; Perona Martinez F. P.; Chipaux M.; Sigaeva A.; Mignon C.; van der Laan K. J.; Hochstetter A.; Schirhagl R. The Fate of Lipid-Coated and Uncoated Fluorescent Nanodiamonds during Cell Division in Yeast. Nanomaterials 2020, 10, 516. 10.3390/nano10030516. [DOI] [PMC free article] [PubMed] [Google Scholar]
- Levi V.; Gratton E. Exploring dynamics in living cells by tracking single particles. Cell Biochem. Biophys. 2007, 1–15. 10.1007/s12013-007-0010-0. [DOI] [PubMed] [Google Scholar]
- Kikkawa Y.; Fujita M.; Abe H.; Doi Y. Effect of water on the surface molecular mobility of poly(lactide) thin films: an atomic force microscopy study. Biomacromolecules 2004, 5, 1187–1193. 10.1021/bm0345007. [DOI] [PubMed] [Google Scholar]
- Schusser S.; Menzel S.; Bäcker M.; Leinhos M.; Poghossian A.; Wagner P.; Schöning M. J. Degradation of thin poly (lactic acid) films: Characterization by capacitance–voltage, atomic force microscopy, scanning electron microscopy and contact-angle measurements. Electrochim. Acta 2013, 113, 779–784. 10.1016/j.electacta.2013.08.025. [DOI] [Google Scholar]
- Johannsmann D. Viscoelastic, mechanical, and dielectric measurements on complex samples with the quartz crystal microbalance. Phys. Chem. Chem. Phys. 2008, 10, 4516–4534. 10.1039/b803960g. [DOI] [PubMed] [Google Scholar]
- Agarwal M.; Koelling K. W.; Chalmers J. J. Characterization of the degradation of polylactic acid polymer in a solid substrate environment. Biotechnol. Prog. 1998, 14, 517–526. 10.1021/bp980015p. [DOI] [PubMed] [Google Scholar]
- Choi K. M.; Choi M. C.; Han D. H.; Park T. S.; Ha C. S. Plasticization of poly lactic acid (PLA) through chemical grafting of poly (ethylene glycol) (PEG) via in situ reactive blending. Eur. Polym. J. 2013, 49, 2356–2364. 10.1016/j.eurpolymj.2013.05.027. [DOI] [Google Scholar]
- Araque-Monrós M. C.; Vidaurre A.; Gil-Santos L.; Bernabé S. G.; Monleón-Pradas M.; Más-Estellés J. Study of the degradation of a new PLA braided biomaterial in buffer phosphate saline, basic and acid media, intended for the regeneration of tendons and ligaments. Polym. Degrad. Stab. 2013, 98, 1563–1570. 10.1016/j.polymdegradstab.2013.06.031. [DOI] [Google Scholar]
- Park S.; Abate I. I.; Liu J.; Wang C.; Dahl J. E. P.; Carlson R. M. K.; Yang L.; Prakapenka V. B.; Greenberg E.; Devereaux T. P.; Jia C.; Ewing R. C.; Mao W. L.; Lin Y. Facile diamond synthesis from lower diamondoids. Sci. Adv. 2020, 6, eaay9405 10.1126/sciadv.aay9405. [DOI] [PMC free article] [PubMed] [Google Scholar]
Associated Data
This section collects any data citations, data availability statements, or supplementary materials included in this article.


