Abstract
Glioblastoma (GBM) contains abundant tumor-associated macrophages (TAMs). The majority of TAMs are tumor-promoting macrophages (pTAMs), while tumor-suppressive macrophages (sTAMs) are the minority. Thus, reprograming pTAMs into sTAMs represents an attractive therapeutic strategy. By screening a collection of small molecule compounds, we find that inhibiting the β-site amyloid precursor protein cleaving enzyme 1 (BACE1) by MK-8931 potently reprograms pTAMs into sTAMs and promotes macrophage phagocytosis of glioma cells; moreover, low-dose radiation markedly enhances TAM infiltration and synergizes with MK-8931 treatment to suppress malignant growth. BACE1 is preferentially expressed by pTAMs in human GBMs and is required for maintaining pTAM polarization through trans-IL-6-sIL-6R-STAT3 signaling. Because MK-8931 and other BACE1 inhibitors have been developed for Alzheimer's disease, and have been shown to be safe for humans in clinical trials, these inhibitors could be potentially streamlined for cancer therapy. Collectively, this study offers a promising therapeutic approach to enhance macrophage-based therapy for malignant tumors.
Introduction
Tumor-associated macrophages (TAMs) are critical immune cells within the tumor microenvironment (TME)1,2, and their abundance is associated with poor prognosis in most malignant tumors, including glioblastoma (GBM)3. TAMs can be functionally categorized into tumor-promoting (pTAMs) and tumor-suppressive (sTAMs) types, although each type may include several subpopulations1,4. The majority of TAMs are pTAMs, which promote malignant growth and therapeutic resistance1,2,5. pTAMs exhibit an M2 macrophage-like phenotype2,4,6 with expression of markers including CD163, ARG1 (Arginase-1), and FIZZ1 (Found in inflammatory zone 1)2,7-9. In contrast, sTAMs display properties of M1-like macrophages2 and express M1-specific markers such as HLA-DR (Human leukocyte antigen – DR isotype), iNOS (Inducible nitric oxide synthase), and CD11c2,7-9. Recent studies indicate that pTAMs play immunosuppressive roles in the TME10 and negatively impact current immunotherapy11. Therefore, reprograming pTAMs into sTAMs may not only directly suppress malignant growth but also offer the opportunity to improve T cell-based immunotherapy. The goal of our study is to develop macrophage-based therapy for treating malignant tumors, including GBMs, that contain abundant TAMs12.
GBM is the most common and fatal brain cancer that is highly resistant to therapies including immune checkpoint inhibition13. GBM inevitably recurs after surgical resection and radio-chemotherapy14. We have demonstrated that pTAMs, glioma stem cells (GSCs), and their interplay play vital roles in promoting tumor progression and therapeutic resistance in GBMs7-9,15. TAMs and GSCs are often located in the perivascular niche in GBM7 and actively interact at molecular levels to support malignant growth7-9. Because most TAMs in GBM are pTAMs that usually lose the ability to phagocytize tumor cells16, we hypothesized that redirecting pTAMs into sTAMs to activate macrophage phagocytosis of glioma cells, including GSCs, might suppress malignant growth to effectively improve GBM treatment. To discover small molecules that potently activate TAM phagocytosis to eliminate glioma cells, we designed a cell-based screen, using human iPS cell (iPSC)-derived macrophages and glioma cells including GSCs to identify drug candidates and their potential molecular targets on TAMs. We identified MK-8931, a specific inhibitor of BACE1 (β-site amyloid precursor protein cleaving enzyme 1), as a top candidate to promote macrophage phagocytosis to engulf cancer cells, and thus defined BACE1 as a potential therapeutic target to reprogram pTAMs into sTAMs for developing the macrophage-based therapy.
BACE1 is a trans-membrane aspartyl protease responsible for the production of amyloid beta peptide (Aβ) in human brains with Alzheimer's disease (AD)17. Since its discovery, BACE1 has been widely investigated as a therapeutic target for AD17, and several BACE1 inhibitors, including MK-8931, have been tested in clinical trials for AD treatment18. In this study, we found that BACE1 is preferentially expressed by pTAMs and that BACE1-mediated trans-IL-6/sIL-6R/STAT3 signaling is required for maintaining pTAMs. We demonstrated that targeting BACE1 with MK-8931 effectively converts pTAMs into sTAMs and promotes TAM phagocytosis of glioma cells in vitro and in vivo. Importantly, our preclinical studies demonstrated that BACE1 inhibition by MK-8931 potently suppressed GBM tumor growth, suggesting that pharmacological inhibition of BACE1 activates TAMs to exert anti-tumor activity. Furthermore, we found that low doses of radiation markedly induced TAM infiltration into GBMs and synergized with MK-8931 to suppress tumor growth, indicating that inhibiting BACE1 with MK-8931, alone or in combination with low-dose radiation, is a promising approach for cancer treatment.
MK-8931 (Verubecestat), a non-peptidic class of BACE1 inhibitor originally developed for AD treatment19, penetrates the blood-brain barrier (BBB) very well and blocks BACE1 activity efficiently in the brain20. MK-8931 is the first BACE1 inhibitor that has proceeded to a phase III clinical trial for AD17. Recent clinical studies demonstrated that MK-8931 is generally safe and well-tolerated in healthy adults21 and AD patients20,22,23, but MK-8931 is not effective for treating AD22,23. Our study strongly indicates that MK-8931 can be repurposed for tumor therapy as it can effectively redirect pTAMs into sTAMs to eliminate cancer cells in GBMs. Thus, this study offers a macrophage-based therapy through BACE1 inhibition with a small molecule that promotes TAM phagocytosis of cancer cells to suppress malignant growth.
Results
BACE1 Inhibitor MK-8931 Activates Macrophage Phagocytosis
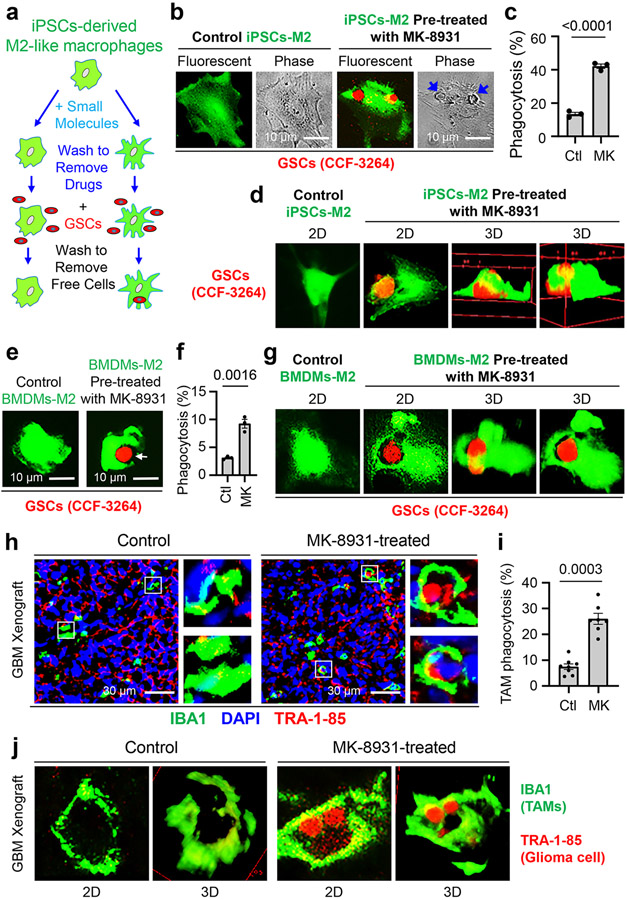
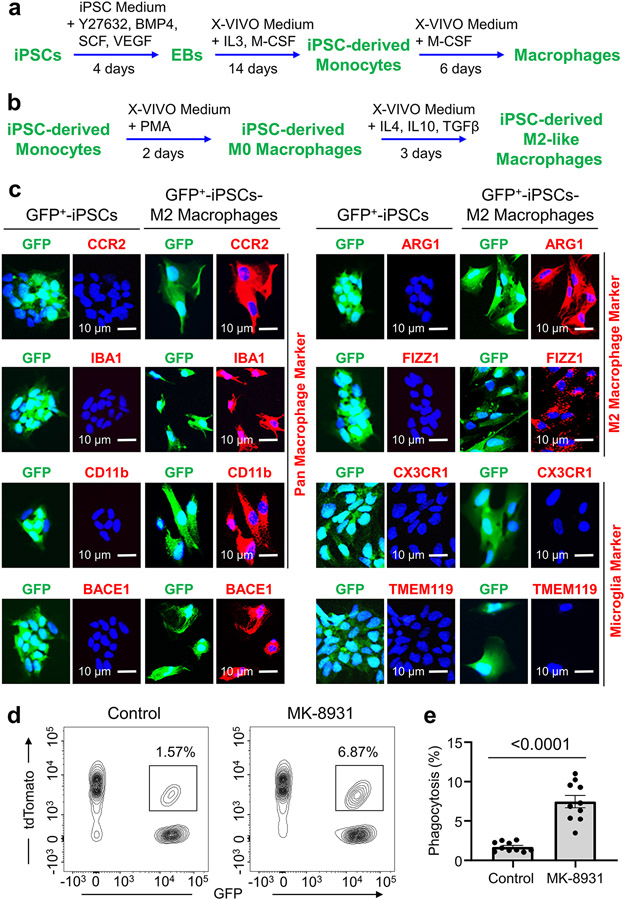
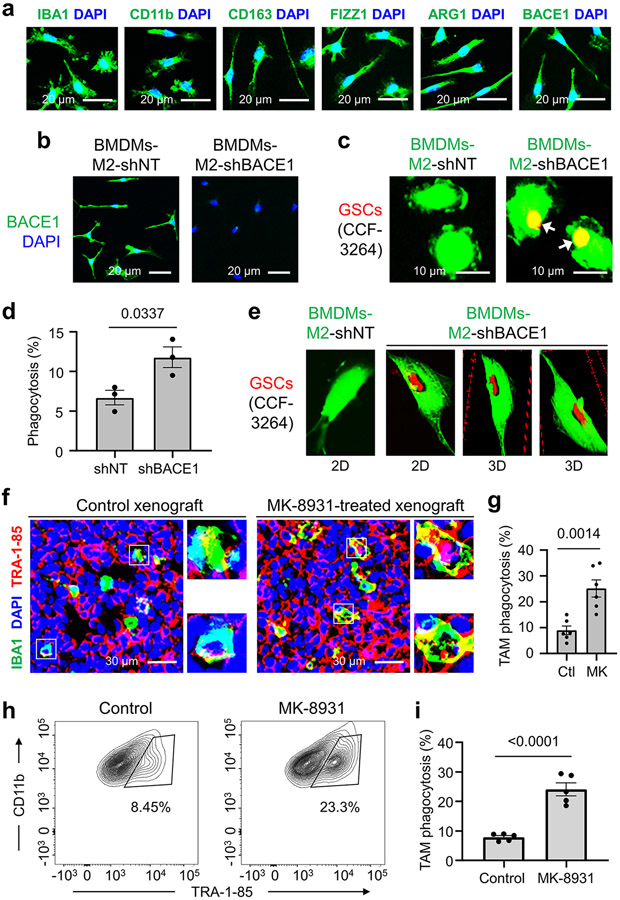
To identify small molecules that promote macrophage phagocytosis of cancer cells, we developed a fluorescent phagocytosis assay, using GFP-labeled human iPSC-derived macrophages (in green) and tdTomato-expressing human glioma stem cells (GSCs, in red) (Fig. 1a). This assay detects phagocytosis as fluorescent inclusion bodies derived from GSCs within macrophages24. To obtain GFP+ macrophages, we transduced iPSCs with a GFP expression construct, then derived M2-like macrophages from GFP+ iPSCs according to established protocols8,9,25 (Extended Data Fig. 1a,b). We confirmed that the iPSC-derived M2-like macrophages (GFP+) expressed total macrophage markers, including IBA1 (Ionized calcium binding adaptor molecule 1), CD11b, and CCR2, and the M2 markers, including ARG1 and FIZZ1, but not the microglia-specific markers, including TMEM119 and CX3CR1 (Extended Data Fig. 1c). Thus, small molecules that activate macrophages (GFP+) to engulf GSCs (tdTomato+) can be detected with a fluorescent microscope (Fig. 1a). We initially screened an inhibitor library (SelleckChem) and some known drugs that displayed excellent BBB permeability and low toxicity in phase II/III clinical trials for other diseases, including AD. We obtained seven “hits” and further identified five BACE1 inhibitors, including MK-8931 as the most promising candidates. The assay showed that MK-8931 treatment promoted phagocytosis of the iPSC-derived macrophages against GSCs (Fig. 1b,c). Confocal microscopy and 3D reconstruction confirmed that glioma cells were truly engulfed by the macrophages pre-treated with MK-8931 (Fig. 1d). Moreover, flow cytometric analyses showed that MK-8931-pretreated macrophages engulfed 4.3 folds more glioma cells than control macrophages (Extended Data Fig. 1d,e), supporting that BACE1 inhibition by MK-8931 promotes macrophage phagocytosis of glioma cells in vitro. We further used the bone marrow-derived M2-like macrophages (BMDMs-M2) (Extended Data Fig. 2a) to validate that MK-8931 also augmented BMDM phagocytosis of GSCs (Fig. 1e-g), suggesting that MK-8931 is a potent activator of macrophage phagocytosis of cancer cells. As MK-8931 was originally developed as a BACE1-specific inhibitor19, we then confirmed that BACE1 was expressed by the iPSC-derived macrophages (Extended Data Fig. 1c) and BMDMs-M2 macrophages (Extended Data Fig. 2a). Consistently, BACE1 disruption by shRNA in BMDMs enhanced macrophage phagocytosis of GSCs (Extended Data Fig. 2b-e). These data indicate that BACE1 inhibition promotes macrophage phagocytosis of glioma cells in vitro.
Fig. 1: Identification of the BACE1 Inhibitor MK-8931 as a Potent Activator of Macrophage Phagocytosis of Glioma Cells.
a, An illustration showing the cell-based fluorescent screening assay using iPSCs-derived M2-like macrophages (iPSCs-M2, GFP+, in green) and glioma stem cells (GSCs, tdTomato+, in red) to identify small molecules activating macrophage phagocytosis of glioma cells.
b,c, Fluorescent and phase contrast images (b) of MK-8931-induced phagocytosis of iPSCs-derived macrophages against GSCs (CCF-3264). Quantifications (c) show fractions of macrophages containing engulfed GSCs. n = 3 independent experiments (about 400 iPSCs-M2 macrophages/group/experiment). Statistical significance was determined by two-tailed Student’s t-test; p<0.0001.
d, In vitro analyses of iPSCs-M2 macrophage phagocytosis of glioma cells by confocal microscopy and Z-stack reconstruction. 2D and 3D images show the engulfment of glioma cells (CCF-3264 GSCs) by iPSCs-derived macrophages pre-treated with MK-8931. Results were confirmed in 3 independent experiments.
e,f, Representative fluorescent images (e) showing MK-8931-promoted phagocytosis of bone marrow-derived macrophages (BMDMs, in green) against GSCs (CCF-3264, in red). Quantifications (f) show fractions of BMDMs containing engulfed GSCs. n = 3 independent experiments (about 500 BMDMs/group/experiment). Statistical significance was determined by two-tailed Student’s t-test; p=0.0016.
g, In vitro analyses of BMDMs macrophage phagocytosis of glioma cells by confocal microscopy and Z-stack reconstruction. 2D and 3D images show the engulfment of glioma cells (CCF-3264 GSCs) by MK-8931-pretreated BMDMs. Results were confirmed in 3 independent experiments.
h,i, Representative images (h) and quantification (i) showing MK-8931-activated TAM (IBA1+, in green) phagocytosis of glioma cells (TRA-1-85+, in red) in GBM xenografts derived from CCF-3264 GSCs. n = 7 (MK-8931-treated) or 8 (control) tumor samples (about 300 TAMs were counted in each sample). Statistical significance was determined by two-tailed Student’s t-test; p=0.0003.
j, In vivo analyses of macrophage phagocytosis of glioma cells in CCF-3264 GSCs-derived GBM xenografts by confocal microscopy and Z-stack reconstruction. 2D and 3D images show the engulfment of glioma cells by macrophages (TAMs) in MK-8931-treated GBM xenografts but not in the control tumor. Results were validated in 3 independent experiments. Ctl: Control; MK: MK-8931.
All data are represented as means ± SEM.
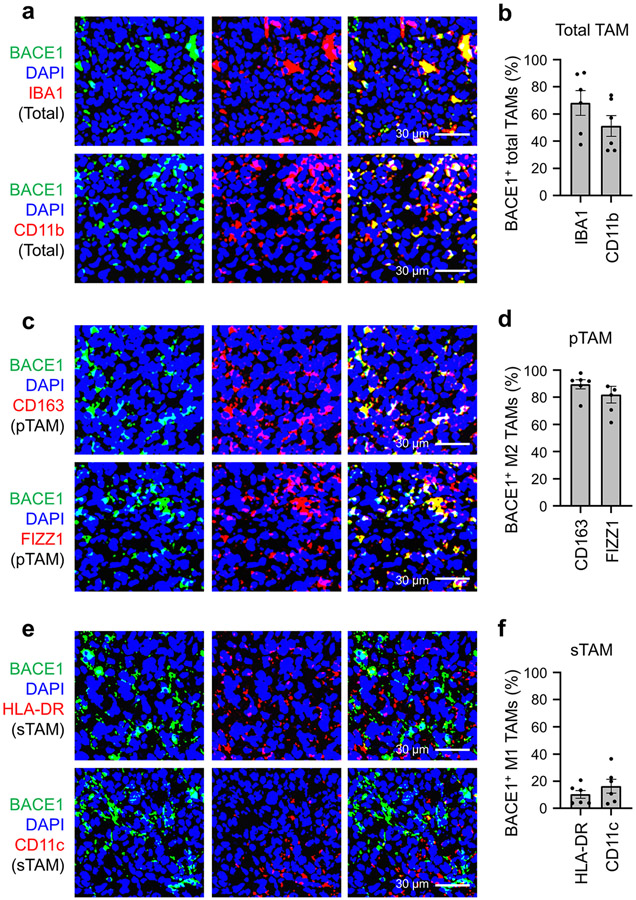
We next sought to determine whether BACE1 inhibition by MK-8931 promotes TAM phagocytosis in GBM xenografts that contain abundant TAMs7-9. We initially examined BACE1 expression in TAMs in GBM xenografts derived from human GSCs (CCF-3264 or CCF-DI315) by double immunofluorescent staining, finding that BACE1 was co-expressed with the total TAM markers CD11b and IBA1 and the pTAM (M2) markers CD163 and FIZZ1, but rarely with the sTAM markers HLA-DR and CD11c (Extended Data Fig. 3), suggesting that BACE1 is mainly expressed by pTAMs in GBM xenografts. We then treated mice bearing intracranial GBM xenografts with MK-8931 (30 mg/kg/daily) or the vehicle control by oral gavage for two weeks and harvested the tumors to analyze the effect of MK-8931 treatment on macrophage phagocytosis of glioma cells. To detect TAM phagocytosis in tumor sections of GBM xenografts, we labeled TAMs with anti-IBA1 antibody and human glioma cells with antibody against the human-specific antigen TRA-1-85, finding that MK-8931 treatment resulted in a significant increase of inclusion bodies derived from glioma cells (in red) within TAMs (in green) as demonstrated by fluorescent analyses, confocal microscopy and 3D reconstruction (Fig. 1h-j and Extended Data Fig. 2f,g), indicating that BACE1 inhibition by MK-8931 activates TAMs to engulf glioma cells in GBMs. To further quantify macrophage phagocytosis of glioma cells in vivo, we isolated total TAMs (CD45+/Gr1−/CD11b+/DAPI−) from GSC-derived xenografts treated with MK-8931 or vehicle control through cell sorting, and determined TAM phagocytosis of human glioma cells by detecting the intracellular signal of TRA-1-85 within TAMs by flow cytometry, finding that the fraction of CD11b+/TRA-1-85+ cells from MK-8931-treated GBM xenografts is 3 folds more than that from control tumors (Extended Data Fig. 2h,i). Collectively, these data indicate that BACE1 inhibition by MK-8931 promotes macrophage phagocytosis of glioma cells in vitro and in vivo.
MK-8931 Inhibits GBM Tumor Growth to Extend Animal Survival
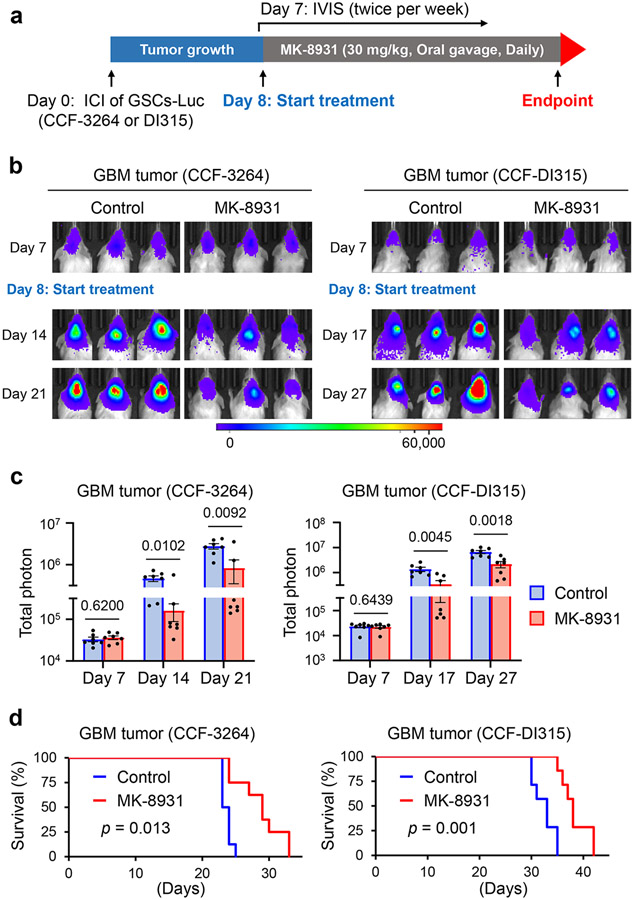
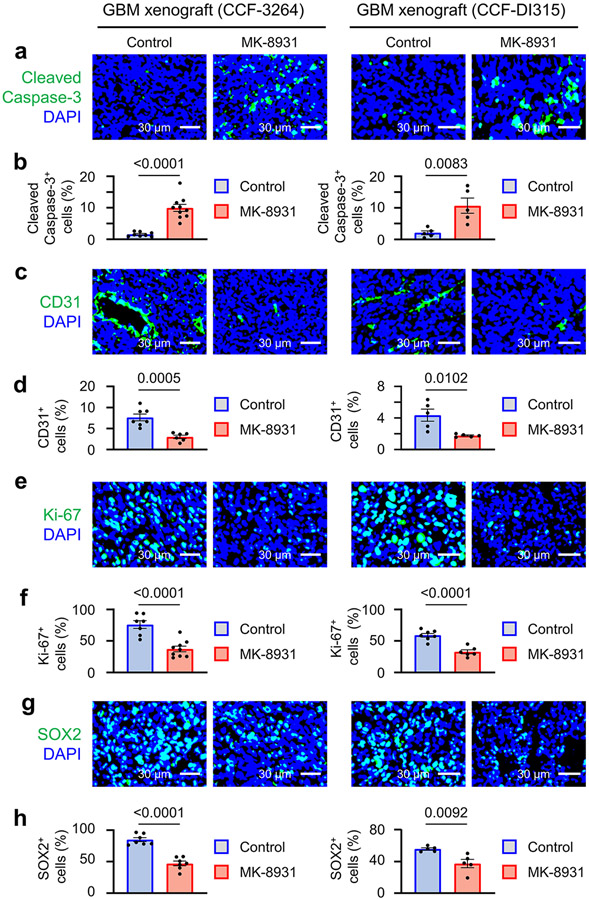
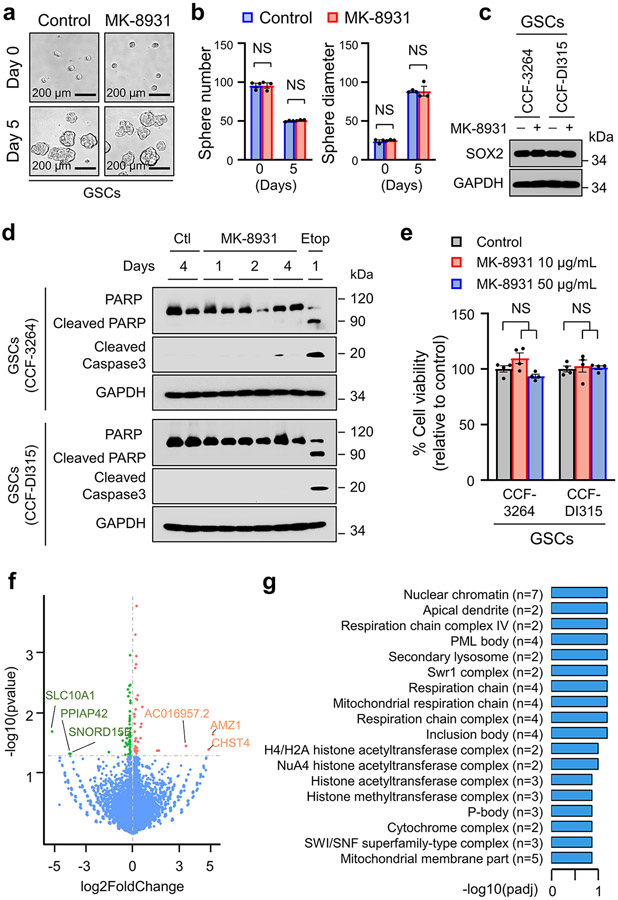
We next investigated whether MK-8931 treatment could suppress GBM growth and impact survival. We treated mice bearing GBM xenografts derived from luciferase-expressing GSCs (CCF-3264 or CCF-DI315) with MK-8931 (30 mg/kg/daily) or a vehicle control by oral gavage and then monitored tumor growth by using the in vivo imaging system (IVIS) as illustrated (Fig. 2a). Bioluminescent imaging demonstrated that MK-8931 treatment potently inhibited GBM tumor growth (Fig. 2b,c). MK-8931 treatment also substantially extended the survival of mice bearing GBM tumors (Fig. 2d). To further understand the cellular effects of MK-8931 on GBM tumor growth, we examined TAM phagocytosis, tumor angiogenesis, cell apoptosis, and proliferation in the MK-8931-treated and control tumors. MK-8931 treatment not only promoted TAM phagocytosis (Fig. 1h-j and Extended Data Fig. 2f-i) but also increased cell apoptosis (cleaved caspase 3+) (Extended Data Fig. 4a,b), reduced vessel (CD31+) density (Extended Data Fig. 4c,d), decreased cell proliferation (Ki-67+) (Extended Data Fig. 4e,f), and reduced GSCs (SOX2+) (Extended Data Fig. 4g,h) in GBMs. These cellular alterations induced by MK-8931 treatment in GBM xenografts were unlikely to be the direct effects of MK-8931 on glioma cells, because MK-8931 in cell culture did not affect proliferation, sphere formation, cell viability, or apoptosis of glioma cells including GSCs in vitro (Extended Data Fig. 5a-e). In addition, RNA sequencing (RNA-seq) analyses showed that MK-8931 treatment had very minor effects on gene expression in GSCs (Extended Data Fig. 5f,g). Collectively, our preclinical data demonstrate that targeting BACE1 by MK-8931 potently suppresses malignant growth of GBMs.
Fig. 2: Targeting BACE1 by MK-8931 Potently Inhibits Tumor Growth and Extends Survival of Animals Bearing Intracranial GBM Xenografts.
a, An illustration showing MK-8931 treatment schedule in GSC-derived xenograft models. Briefly, human glioma stem cells (GSCs) expressing luciferase (Luc) were transplanted into NSG mouse brains through intracranial injection (ICI) to establish GBM xenografts. Seven days after transplantation, the tumor-bearing mice were treated with MK-8931 (30 mg/kg/daily) or the vehicle control by oral gavage. Bioluminescent imaging (IVIS) were performed twice per week to monitor tumor growth before and after MK-8931 treatment. Mice were maintained until the development of neurological signs to examine the effect of MK-8931 treatment on survival. Mouse brains bearing GBM tumors were harvested for further analyses.
b,c, Representative bioluminescent images (b) of intracranial GBM xenografts derived from CCF-3264 or CCF-DI315 GSCs expressing luciferase in mice treated with MK-8931 (30 mg/kg/daily) or the vehicle control. Quantifications (c) show the mean bioluminescence of the MK-8931-treated or control group on the indicated days after GSC transplantation. Data are shown as means ± SEM. n = 7 GBM-bearing mice per group. Statistical significance was determined by two-tailed Student’s t-test; p values were indicated on the figure.
d, Kaplan-Meier survival curves of mice bearing GSC-derived GBM xenografts treated with MK-8931 (30 mg/kg/daily) or the vehicle control. n = 8 mice per group (CCF-3264 GSC-derived xenografts) or 7 mice per group (CCF-DI315 GSC-derived xenografts). Log-rank analysis was used to assess the significance; p values are indicated on the figure.
BACE1 inhibition Promotes TAM Phenotype Switch
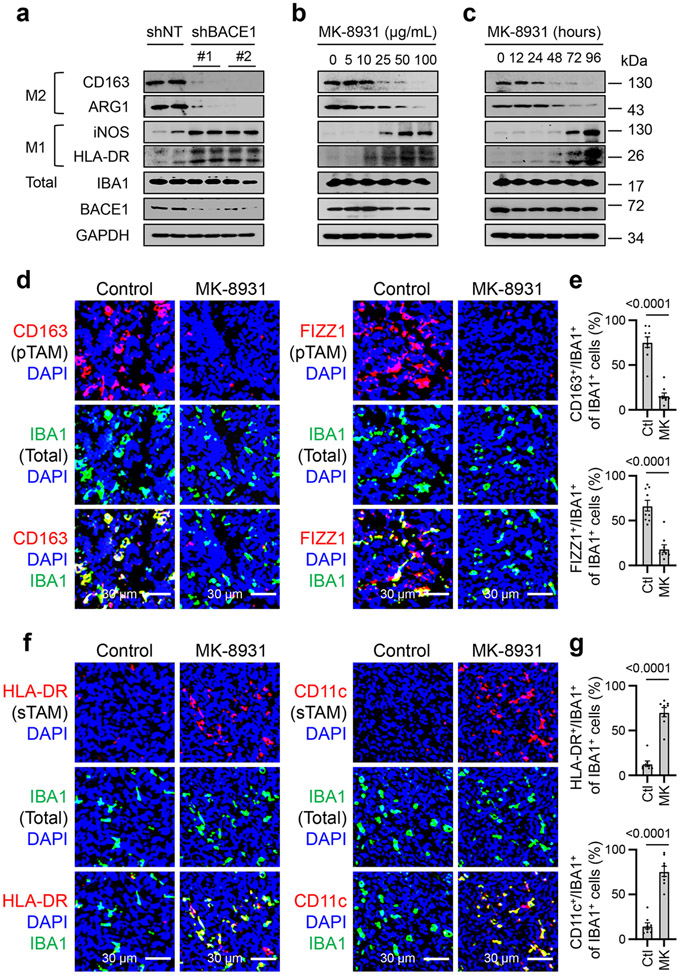
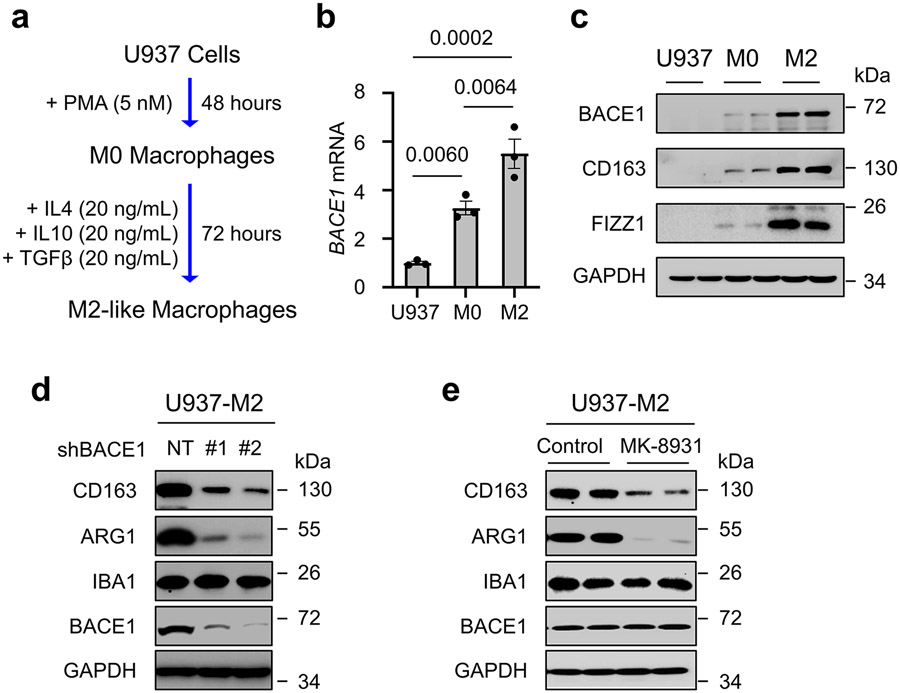
Because the cellular alterations induced by MK-8931 treatment are similar to those defined in tumors when pTAMs are inhibited7-9,26, we then interrogated whether BACE1 played a role in maintaining pTAMs. We generated M2-like macrophages from the PMA-primed U973 cells (M0 macrophages) using cytokines IL-4, IL-10 and TGF-β according to an established protocol8,9 (Extended Data Fig. 6a), and found that M2-like macrophages derived from U937 monocytes (U937-M2) expressed high levels of BACE1 at both mRNA and protein levels (Extended Data Fig. 6b,c). We then examined the effects of BACE1 disruption by shRNA on U937-M2 macrophages, showing that BACE1 knockdown markedly reduced the expression of M2 macrophage markers CD163 and ARG1, while expression of the total macrophage marker IBA1 was not affected (Extended Data Fig. 6d). This result was further confirmed by using the BACE1 inhibitor MK-8931 (Extended Data Fig. 6e). As BACE1 disruption or inhibition did not impact the expression of the pan macrophage marker IBA1 (Extended Data Fig. 6d,e), we speculated that targeting BACE1 might promote phenotypic transition of M2 macrophage into the M1 phenotype. To address this possibility, we disrupted BACE1 with shRNA (shBACE1) in U937-M2 macrophages, finding that BACE1 disruption indeed induced the expression of M1 macrophage markers, including HLA-DR and iNOS (Fig. 3a), while expressions of M2 macrophage markers CD163 and ARG1 were dramatically reduced after BACE1 disruption (Fig. 3a and Extended Data Fig. 6d). Moreover, inhibiting BACE1 by MK-8931 in U937-M2 macrophages effectively induced expression of M1 macrophage markers HLA-DR and iNOS, but suppressed expression of M2 macrophage markers CD163 and ARG1 in a dose- and time-dependent manner (Fig. 3b,c). These data indicate that BACE1 disruption or inhibition redirects M2 macrophages into M1 phenotype in vitro.
Fig. 3: Inhibiting BACE1 by MK-8931 Converts Tumor-promoting TAMs (pTAMs) into Tumor-suppressive TAMs (sTAMs).
a, Immunoblot analyses of the M2 macrophage markers (CD163 and ARG1), M1 markers (iNOS and HLA-DR), and the pan macrophage marker IBA1 in U937-M2 macrophages expressing shRNAs targeting BACE1 (shBACE1: #1 or #2) or non-targeting control (shNT). GAPDH was blotted as the loading control. Results were confirmed in 3 independent experiments.
b,c, Immunoblot analyses of macrophage markers indicated in (a) in U937-M2 macrophages treated with increased doses of MK-8931 for three days (b), or treated with 50 μg/mL of MK-8931 for the indicated times (c). GAPDH was blotted as the control. Results were confirmed in 3 independent experiments.
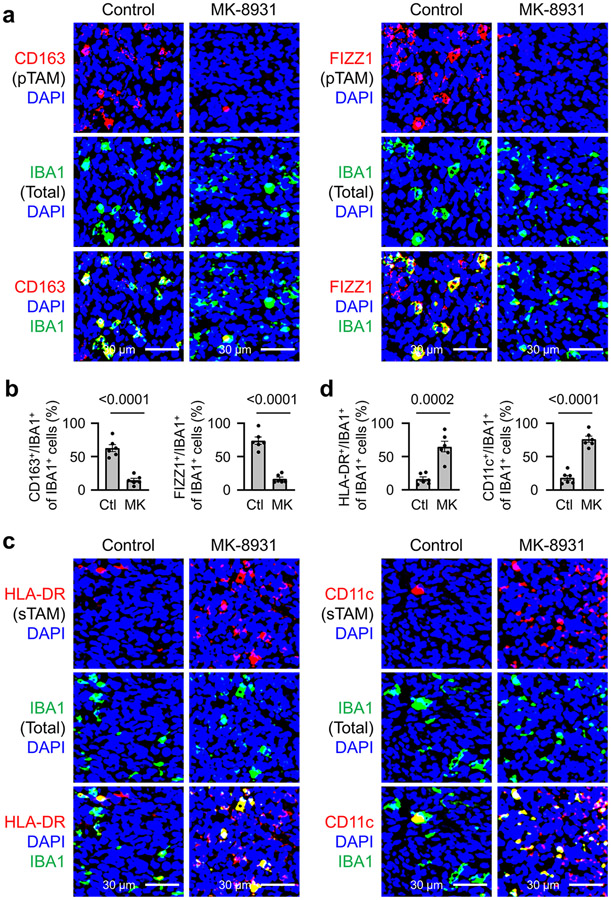
d,e, Analyses of relative pTAM density by immunofluorescent staining of CD163 or FIZZ1 in CCF-3264 GSCs-derived GBM xenografts treated with MK-8931 or vehicle control. Representative images (d) show immunofluorescent staining of the pTAM marker CD163 or FIZZ1 (in red) and the pan TAM marker IBA1 (in green). Quantifications (e) show relative density of pTAMs (CD163+/IBA1+ or FIZZ1+/IBA1+) to total TAMs (IBA1+) in MK-8931-treated GBM xenografts or control tumors. Data are shown as means ± SEM. n = 9 tumor samples per group. Statistical significance was determined by two-tailed Student’s t-test; p<0.0001.
f,g, Analyses of relative sTAM density by immunofluorescent staining HLA-DR or CD11c in CCF-3264 GSCs-derived GBM xenografts treated with MK-8931 or vehicle control. Representative images (f) show immunofluorescent staining of the sTAM marker HLA-DR or CD11c (in red) and the pan TAM marker IBA1 (in green). Quantifications (g) show relative density of sTAMs (HLA-DR+/IBA1+ or CD11c+/IBA1+) to total TAMs (IBA1+) in MK-8931-treated GBM xenografts or control tumors. Data are shown as means ± SEM. n = 8 tumor samples per group. Statistical significance was determined by two-tailed Student’s t-test; p<0.0001.
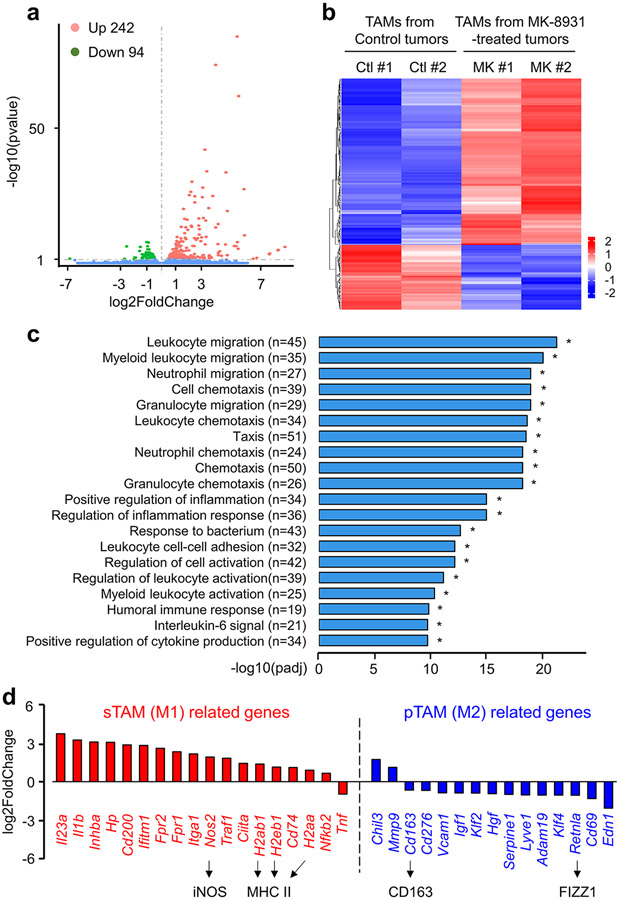
To further study the potential effect of BACE1 inhibition on TAM phenotype switch in vivo, we isolated total TAMs (CD45+/Gr1−/CD11b+/DAPI−) from GBM xenografts treated with MK-8931 or vehicle control through cell sorting, and used RNA-Seq analyses to determine gene expression profile affected by MK-8931 treatment in vivo. We found that expressions of 336 genes (242 genes upregulated, and 94 genes downregulated) were altered by MK-8931 treatment in vivo (Extended Data Fig. 7a,b). The gene ontology enrichment analyses indicated that the differentially expressed genes (DEGs) were prominently enriched in the signaling pathways related to immune cells migration, activation, and adhesion, and inflammatory response (Extended Data Fig. 7c). Importantly, nearly all genes related to M1 macrophages (sTAMs) were upregulated, while most of M2 macrophage (pTAMs)-related genes were downregulated in the TAMs sorted from MK-8931-treated tumors (Extended Data Fig. 7d). Moreover, we confirmed that MK-8931 treatment strongly reduced the relative density of pTAMs, as marked by CD163+/IBA1+ or FIZZ1+/IBA1+ cells relative to the total TAMs (IBA1+ cells) (Fig. 3d,e and Extended Data Fig. 8a,b). In contrast, the relative density of sTAMs, as marked by HLA-DR+/IBA1+ or CD11c+/IBA1+ cells relative to total TAMs (IBA1+ cells), was strikingly elevated in MK-893-treated tumors, relative to control tumors (Fig. 3f,g and Extended Data Fig. 8c,d). These data demonstrate that inhibiting BACE1 reprograms pTAMs into sTAMs in vivo, indicating that BACE1 is required for maintaining pTAMs.
Anti-tumor Effects of BACE1 Inhibition Depend on TAM Switch
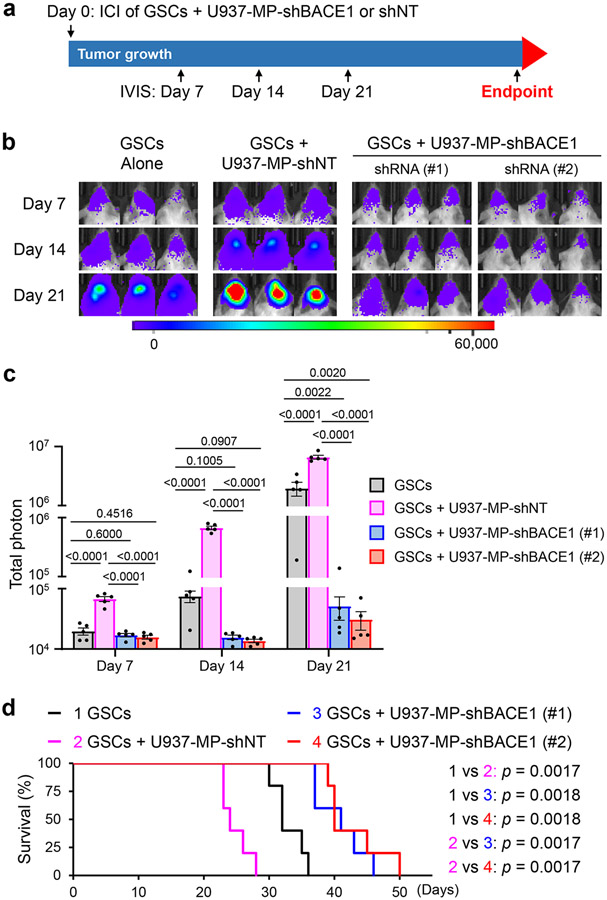
To further address whether macrophage phenotype switch caused by BACE1 inhibition impacts tumor growth, we established GBM xenografts by co-transplanting U937 monocyte-derived macrophages expressing shBACE1 (BACE1 shRNA) or shNT control (non-targeting shRNA) with GSCs expressing luciferase, as illustrated (Fig. 4a). Co-transplantation of GSCs with U937-derived M2 macrophages expressing shNT substantially promoted GBM growth (Fig. 4b,c) and reduced the survival of mice relative to control mice implanted with GSCs alone (Fig. 4d), consistent with a tumor-promoting role of pTAMs8. In contrast, co-transplantation of GSCs with U937-derived macrophages expressing shBACE1 (disrupting BACE1) did not augment GBM growth, but rather suppressed malignant growth relative to GSCs alone (Fig. 4b,c). Consequently, the survival of mice implanted with GSCs and shBACE1-expressing macrophages was extended relative to mice implanted with GSCs alone or GSCs plus U937-derived M2 macrophages expressing shNT (Fig. 4d), indicating that BACE1 disruption reprograms pTAMs into sTAMs, resulting in anti-tumor activity.
Fig. 4: Disrupting BACE1 in U937-derived Macrophages Suppresses Tumor Growth in GBM Xenografts Derived from GSCs Co-transplanted with the Macrophages.
a, A schematic illustration showing the co-transplantation experiment to examine the effect of BACE1 disruption in U937-M2 macrophages on tumor growth in GBM xenograft models. Briefly, human GSCs (CCF-DI315) expressing luciferase in combination with or without U937-derived macrophages expressing shBACE1 (shBACE1: #1 or #2) or non-targeting control (shNT) were co-transplanted into NSG mouse brains through intracranial injection (GSCs: Macrophages = 1:2). Bioluminescent imaging (IVIS) were performed twice per week to monitor tumor growth. GSCs: Glioma stem cells; ICI: Intracranial injection; Luc: Luciferase; MP: Macrophage.
b,c, In vivo bioluminescent analysis to monitor tumor growth of orthotopic GBM xenografts derived from luciferase-expressing GSCs (CCF-DI315) co-transplanted with or without U937-derived macrophages expressing shBACE1 (shBACE1: #1 or #2) or shNT (control) in mice. Representative bioluminescent images (b) on the indicated days are shown. Quantifications (c) show the mean bioluminescence of GBM xenografts derived from GSCs (CCF-DI315) alone, GSCs plus shNT-expressing U937-derived macrophages, or GSCs plus shBACE1-expressing U937-derived macrophages on Days 7, 14, and 21. Data are shown as means ± SEM. n = 5 mice per group. Statistical significance was determined by one-way ANOVA analysis; p values are indicated on the figure.
d, Kaplan-Meier survival curves of the mice bearing GBM xenografts derived from GSCs (CCF-DI315) alone, GSCs plus U937-derived macrophages expressing shNT, or GSCs plus U937-derived macrophages expressing shBACE1 (shBACE1: #1 or #2). n = 5 mice per group. Log-rank analysis was used to assess the significance; p values are indicated on the figure.
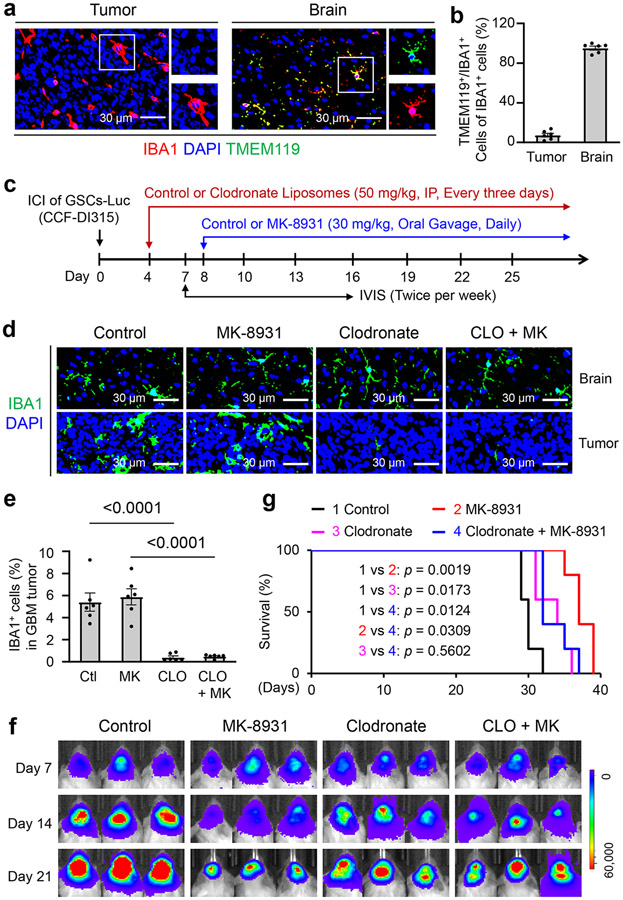
Although the majority of TAMs in GBM are derived from circulating monocytes7,27,28, whether resident microglia from the brain are involved in the anti-tumor effects of BACE1 inhibition remains unclear. To address this issue, we first examined the distribution of microglia in GBM xenografts and the adjacent normal brain by immunofluorescent staining of IBA1 and the microglia-specific marker TMEM119, and found that microglia (IBA1+/TMEM119+ cells) were mainly distributed in the adjacent brain but not within the GBM tumor area (Fig. 5a,b), confirming that most TAMs in GBM are monocyte-derived macrophages but not resident microglia. Next we examined whether depletion of monocyte-derived TAMs could impact anti-tumor effects of MK-8931. We used clodronate-filled liposomes to deplete monocyte-derived macrophages29 and thus eliminate monocyte-derived TAMs in GBM xenografts, as illustrated (Fig. 5c). We validated that most TAMs within GBM xenografts were depleted by clodronate treatment while microglia in the adjacent brain were not affected (Fig. 5d,e). Importantly, depletion of monocyte-derived TAMs in GBM xenografts by clodronate treatment markedly attenuated the effect of MK-8931 on inhibiting GBM growth (Fig. 5f) and significantly diminished the MK-8931 treatment-extended survival of mice bearing GBMs (Fig. 5g). These data indicate that monocyte-derived macrophages are required for the anti-tumor effects of BACE1 inhibition by MK-8931 in GBMs. Collectively, our data demonstrate that BACE1 inhibition results in phenotypic switch of pTAMs into sTAMs in vivo to suppress tumor growth, highlighting the critical role of BACE1 as an important modulator in regulating TAM functions.
Fig. 5: Depletion of Monocyte-derived TAMs by Clodronate Attenuates the Anti-tumor Effects of MK-8931 Treatment in GBM Xenografts.
a,b, Immunofluorescent staining of the microglia marker TMEM119 (in green) and the total TAM marker IBA1 (in red) to detect microglia distribution in GBM xenografts derived from CCF-DI315 GSCs and the adjacent normal brain. Representative immunofluorescent images (a) are shown. Quantifications (b) show the relative fractions of IBA1+/TMEM119+ cells (microglia) in GBM tumors and the adjacent normal brain. Data are shown as means ± SEM. n = 6 tumor samples per group.
c, A schematic illustration showing treatment with clodronate (for depletion of monocyte-derived TAMs) or/and MK-8931 in GBM xenografts derived from CCF-DI315 GSCs. ICI: Intracranial injection; IP: Intraperitoneal injection; IVIS: In Vivo Imaging Systems. Luc: Luciferase.
d, e, Immunofluorescent staining of IBA1 in GBM xenografts derived from CCF-DI315 GSCs and the adjacent normal brain from mice treated with MK-8931 (MK), Clodronate (CLO), MK plus CLO, or the vehicle control. Representative immunofluorescent images (d) of IBA1 staining (in green) are shown. Quantifications (e) show fractions of TAMs (IBA1+ cells) in GBM xenografts with indicated treatment. Data are shown as means ± SEM. n = 6 tumor samples per group. Statistical significance was determined by one-way ANOVA analysis; Ctl vs CLO: p<0.0001; MK vs CLO + MK: p<0.0001.
f, In vivo bioluminescent analysis to monitor intracranial tumor growth of GBM xenografts derived from CCF-DI315 GSCs in mice treated with MK-8931 (MK), Clodronate (CLO), MK plus CLO, or vehicle control. Representative bioluminescent images on the indicated days were shown.
g, Kaplan-Meier survival curves of mice bearing the GSC-derived GBM xenografts treated with MK-8931 (MK), Clodronate (CLO), MK plus CLO, or the vehicle control. n = 5 mice per group. Log-rank analysis was used to assess the significance; p values are indicated on the figure.
Low Doses of Radiation Synergize with MK-8931 Treatment
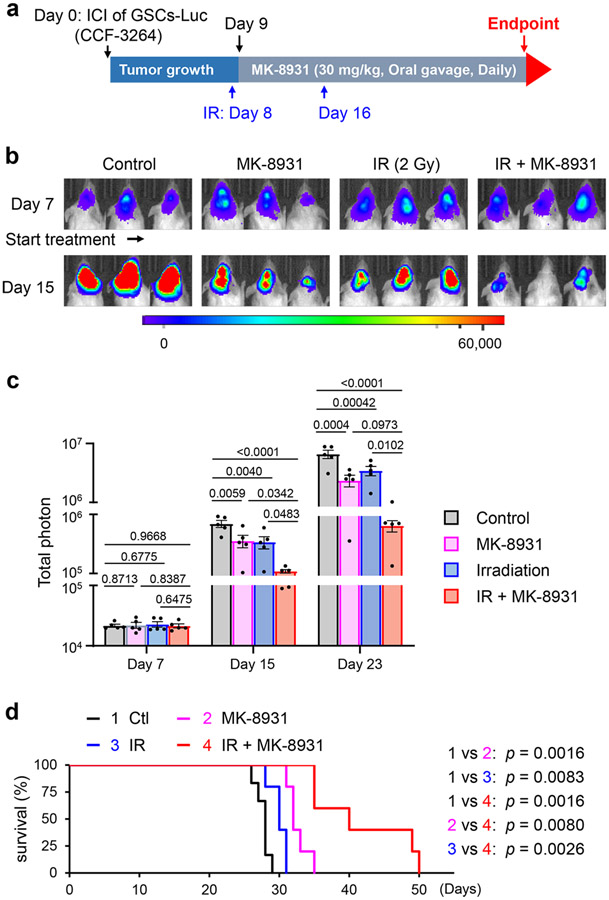
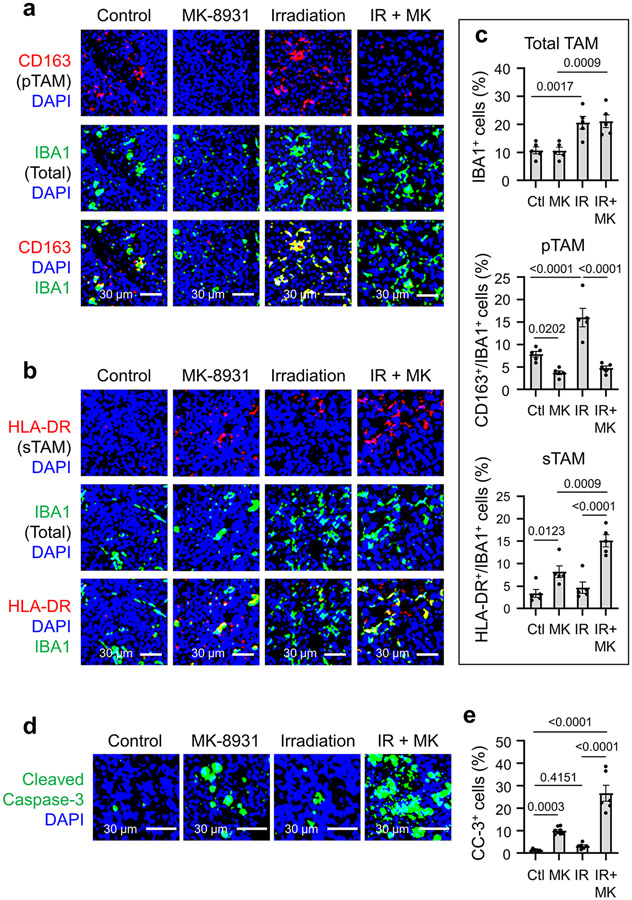
Our preclinical study has demonstrated that targeting BACE1 effectively reprogramed pTAMs into sTAMs to inhibit GBM growth. To improve the efficacy of macrophage-based therapy through BACE1 inhibition for some tumors that may contain relatively few TAMs, we sought to find an effective way to enhance the infiltration of macrophages into tumors. Because low-dose irradiation (IR) promotes macrophage infiltration into tumors30, we speculated that IR-enhanced TAM infiltration could synergize with MK-8931 treatment. To test this hypothesis, we irradiated mouse brains bearing GSC-derived xenografts with low doses of IR (2×2 Gy) to allow infiltration of more TAMs into GBMs and then treated the mice with MK-8931 as illustrated (Fig. 6a). The combined treatment achieved the strongest inhibition of tumor growth, relative to treatment with IR or MK-8931 alone (Fig. 6b,c). As a consequence, the combined treatment conferred the longest survival extension among four groups of mice (Fig. 6d). To determine the phenotypes of TAMs in GBM xenografts treated with IR, MK-8931, or IR plus MK-8931, we examined TAM density and subtypes in tumors from the four groups of mice. Total TAM density (IBA1+ cells) was remarkably elevated by treatment with low doses of IR (Extended Data Fig. 9a-c), consistent with previous reports that IR enhanced TAM infiltration into tumors30. Surprisingly, the majority of TAMs induced by the low dose of IR were pTAMs but not sTAMs, as shown by the expression of CD163 but not HLA-DR (Extended Data Fig. 9a-c). However, MK-8931 treatment effectively converted these pTAMs (CD163+/IBA1+ cells) into sTAMs (HLA-DR+/IBA1+ cells) in GBM xenografts treated with IR plus MK-8931 (Extended Data Fig. 9a-c), suggesting that BACE1 inhibition by MK-8931 redirects the IR-enriched pTAMs into sTAMs. Moreover, immunostaining analyses of cleaved caspase 3 in GBMs demonstrated that the combined treatment resulted in more apoptosis than the treatment with MK-8931 or IR alone (Extended Data Fig. 9d,e). Importantly, cell apoptosis induced by the combined treatment (26.6 ± 3.2%) was notably greater than the sum of apoptosis induced by MK-8931 alone (9.9 ± 0.5%) or IR alone (3.1 ± 0.7%) (Extended Data Fig. 9e). Collectively, these data demonstrate that the enhanced TAM infiltration by low doses of IR effectively synergizes with MK-8931 treatment to suppress malignant growth and increase the survival of the tumor-bearing animals, highlighting the promising therapeutic potential of the macrophage-based therapy using MK-8931 plus low doses of IR.
Fig. 6: Low Doses of Irradiation Synergize with MK-8931 Treatment to Suppress GBM Growth and Prolong Survival of Tumor-bearing Mice.
a, A schematic illustration showing experimental schedule of MK-8931 treatment in combination with low doses of irradiation (IR) in GBM xenografts models. Human glioma stem cells (GSCs, CCF-3264) expressing luciferase (Luc) were transplanted into mouse brains through intracranial injection (ICI) to establish orthotopic GBM xenografts. Irradiation (2 Gy) was performed on Days 8 and 16. From Day 9, mice were treated with MK-8931 (30 mg/kg/daily) or the vehicle control by oral gavage until the development of neurological signs. Bioluminescent imaging (IVIS) was performed twice per week to monitor tumor growth before and after IR and MK-8931 treatment.
b,c, In vivo bioluminescent analysis of intracranial tumor growth in GBM xenografts derived from CCF-3264 GSCs in mice treated with MK-8931, irradiation (IR), IR plus MK-8931, or the vehicle control. Representative bioluminescent images (b) on Day 7 (before treatment) and Day 15 (treatment for one week) are shown. Quantifications (c) show the mean bioluminescence of GBM tumors in the four groups of mice on Days 7, 15 and 23. Data are shown as means ± SEM. n = 5 mice per group. Statistical significance was determined by one-way ANOVA analysis; p values are indicated on the figure.
d, Kaplan-Meier survival curves of the mice bearing GBM xenografts derived from CCF-3264 GSCs in mice treated with MK-8931, irradiation (IR), IR plus MK-8931, or the vehicle control. Data are shown as means ± SEM. n = 6 mice (control group) or 5 mice per group (treated groups). Log-rank analysis was used to assess the significance; p values are indicated on the figure.
BACE1 Cleaves IL-6R and Activates IL6/sIL-6R/STAT3 Signaling
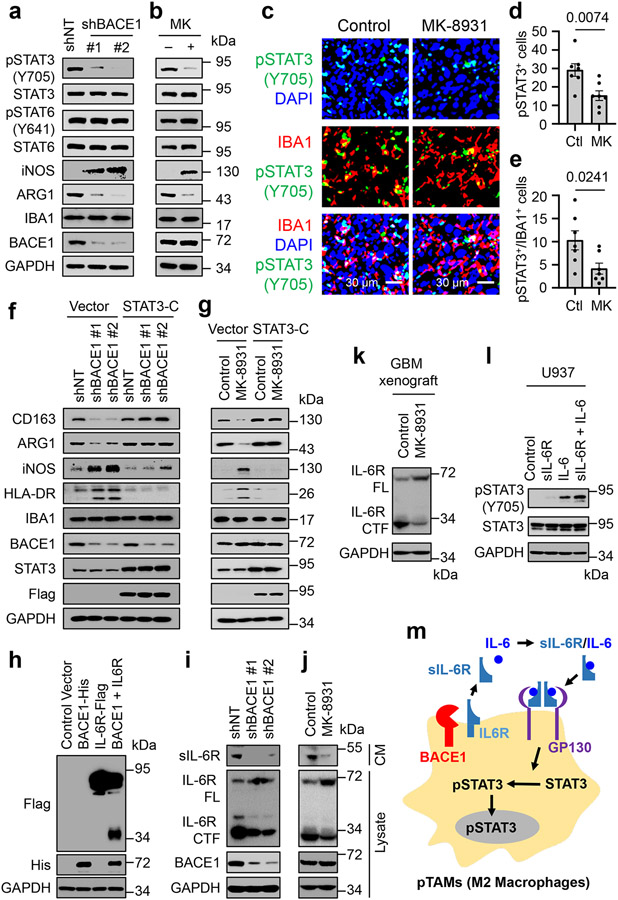
Since BACE1 is required for maintaining pTAMs, we next sought to understand the molecular mechanisms by which it drives pTAM polarization. Because STAT3 and STAT6 are key transcriptional regulators in M2 macrophage polarization31, we interrogated their potential role in BACE1-mediated maintenance of pTAMs. Surprisingly, we found that the activating phosphorylation of STAT3 (pSTAT3-Y705) but not STAT6 (pSTAT6-Y641) was substantially down-regulated after BACE1 disruption by shBACE1 (Fig. 7a) or inhibition by MK-8931 (Fig. 7b). Consistently, MK-8931 treatment in vivo profoundly reduced the number of pSTAT3+ TAMs (pSTAT3+/IBA1+) and total pSTAT3+ cells in GBM xenografts (Fig. 7c-e). To further determine whether BACE1 functions through STAT3 signaling to maintain pTAMs, we examined whether ectopic expression of a constitutively active STAT3 (STAT3-C) could rescue the attenuated pTAM phenotype induced by BACE1 disruption or inhibition. Indeed, ectopic expression of STAT3-C restored expression of M2 macrophage markers CD163 and ARG1 in U937-M2 macrophages affected by BACE1 disruption or inhibition (Fig. 7f,g). Importantly, ectopic expression of STAT3-C abolished the increased expressions of M1 macrophage markers iNOS and HLA-DR that were induced by BACE1 disruption or inhibition in the macrophages (Fig. 7f,g). Thus, ectopic expression of STAT3-C restored the M2 macrophage phenotype impaired by BACE1 disruption or inhibition. Collectively, these data demonstrate that BACE1 maintains M2-like macrophages mainly through STAT3 activation, indicating that BACE1-mediated STAT3 activation is required for maintaining M2 macrophages (pTAMs in tumors).
Fig. 7: BACE1 Maintains pTAMs by Cleaving IL-6R to Activate Trans IL-6/sIL-6R/STAT3 Signaling.
a,b, Immunoblot analyses of pSTAT3-Y705, STAT3, pSTAT6-Y641, STAT6, iNOS (a M1 marker), ARG1 (a M2 marker), IBA1 (a pan macrophage marker), and BACE1 in U937-derived M2-like macrophages (U937-M2) expressing shBACE1 or shNT (a), or treated with MK-8931 (50 μg/mL) or vehicle control for three days (b).
c-e, In vivo analyses of STAT3 activating phosphorylation in TAMs by immunofluorescent staining of IBA1 and pSTAT3-Y705 in GBM xenografts treated with MK-8931 or vehicle control. Representative images (c) are shown. Quantifications show fractions of pSTAT3+ cells (d) and pSTAT3+/IBA1+ TAMs (e) in MK-8931-treated or control GBM xenografts. Data are shown as means ± SEM. n = 7 tumor samples per group. Statistical significance was determined by two-tailed Student’s t-test; p values are indicated on the figure.
f,g, Immunoblot analyses of M2 markers (CD163 and ARG1), M1 markers (iNOS and HLA-DR), the pan macrophage marker IBA1, STAT3, and BACE1 in U937-M2macrophages transduced with constitutively activated STAT3 (STAT3-C-Flag) or vector (control) in combination with shBACE1 or shNT (f), or with treatment of MK-8931 or vehicle control (g).
h, Immunoblot analyses of IL-6R cleavage in 293 FT cells transduced with BACE1-His, IL-6R-Flag (C-terminal Flag-tagged IL-6R), BACE1-His plus IL-6R-Flag, or Control vector. IL-6R cleavage producing the C-terminal fragment was detected in cells co-expressing BACE1-His with IL-6R-Flag.
i,j, Immunoblot analyses of the soluble form of IL-6R (sIL-6R) in conditioned medium (CM), full length IL-6R (FL), C-terminal fragment of IL-6R (CTF), and BACE1 in cell lysates in the U937-M2 macrophages expressing shBACE1 or shNT (i), or treated with MK-8931 (50 μg/mL) or vehicle control for three days (j).
k, Immunoblot analyses BACE1-mediated IL-6R cleavage in GBM tumors treated with MK-8931 or vehicle control. Proteins were extracted and immunoblotted with anti-IL-6R that recognizes both full-length IL-6R and the C-terminal fragment of IL-6R.
l, Immunoblot analyses of pSTAT3-Y705 and STAT3 in U937 macrophages treated with sIL-6R, IL-6, sIL-6R plus IL-6, or vehicle control.
m, A schematic illustration showing that BACE1 maintains pTAMs (M2 macrophages) through trans-IL-6/sIL-6R/STAT3 signaling.
Results were confirmed in 3 independent experiments (a, b, h-l).
To understand how BACE1 regulates STAT3 activation in pTAMs, we analyzed potential substrates of BACE1, finding that ten of them are involved in regulating STAT3 activity and eight are reported to play a role in macrophage polarization. We further investigated four substrates, including IL-6 receptor (IL-6R) that functionally overlaps in regulating STAT3 activity and macrophage polarization. To this end, we found that BACE1 mediates the shedding of IL-6R by functioning as a transmembrane protease (Fig. 7h), and further demonstrated that BACE1 disruption or inhibition not only reduced the amount of the N-terminal fragment of IL-6R (the soluble sIL-6R) in the conditioned media of macrophages (Fig. 7i,j, top panels) but also reduced the membrane-bound C-terminal IL-6R fragment (CTF) in macrophage lysates (Fig. 7i,j), while the amount of full-length IL-6R (FL) was increased in lysates of macrophages upon BACE1 disruption or inhibition (Fig. 7i,j). These data indicate that the sIL-6R released into the extracellular space is generated by the BACE1-mediated cleavage of the membrane-bound full length IL-6R. To further confirm that MK-8931 also blocks BACE1 proteolytic activity in vivo, we extracted proteins from MK-8931-treated or control tumors and performed immunoblot analyses to detect the effect of MK-8931 treatment on IL-6R cleavage. We validated that the full-length IL-6R was increased while the C-terminal IL-6R fragment was reduced in MK-8931-treated tumors relative to control tumors (Fig. 7k), indicating that MK-8931 treatment also inhibited the BACE1-mediated cleavage of IL-6R in vivo. It is well known that sIL-6R binds to IL-6 and forms an IL-6/sIL-6R complex that retains the capacity to bind to glycoprotein 130 (gp130) and thus to activate STAT3 signaling32. This signaling mechanism, termed the trans-IL-6/sIL-6R/STAT3 pathway, plays a key role in the TME, driving tumor growth33. sIL-6R, functioning as a carrier of IL-6, is able to prolong the half-life of IL-6 in vivo and to stabilize IL-6 signaling34, resulting in a dramatic increase of STAT3 activation35. Consistently, we demonstrate that sIL-6R enhances IL-6-induced STAT3 activation in macrophages (Fig. 7l). Collectively, our data indicate that BACE1-mediated the shedding of full length IL-6R generates sIL-6R, which promotes STAT3 activation induced by IL-6 to maintain the polarization of pTAMs (Fig. 7m).
High BACE1 Levels in pTAMs Predicts Poor Prognosis of GBMs
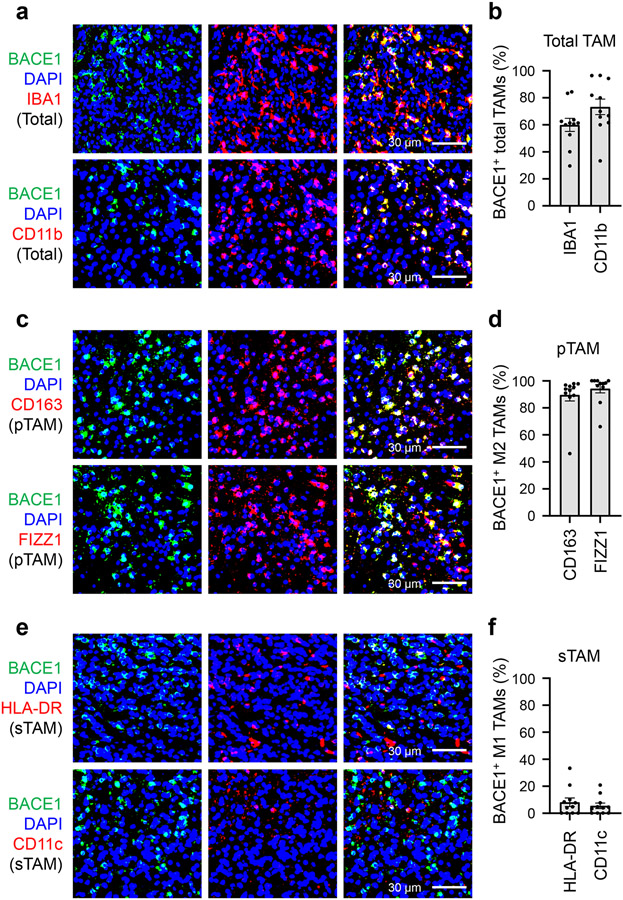
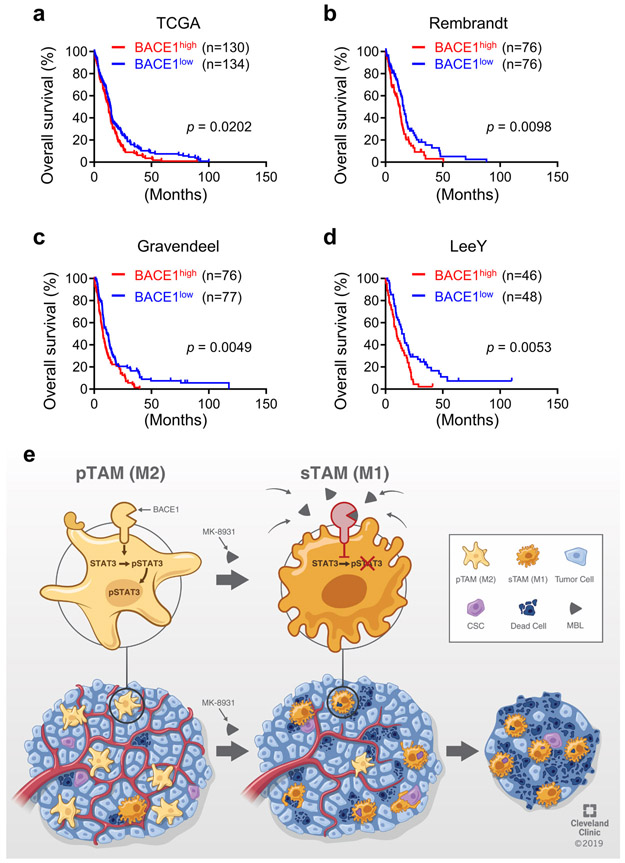
To interrogate the clinical significance of BACE1 in human GBMs, we examined its expression in GBM surgical specimens, finding that BACE1 was detected in a fraction of total TAMs marked by IBA1 or CD11b (Fig. 8a). Quantitative analysis indicated that approximately 60% of the IBA1+ TAMs and about 67% of the CD11b+ TAMs express BACE1 (Fig. 8b). Further examination demonstrated that BACE1 was mainly co-expressed with the pTAM (M2) marker CD163 or FIZZ1 (Fig. 8c). Quantification showed that most pTAMs express BACE1, as approximately 83% of the CD163+ TAMs and 87% of the FIZZ1+ TAMs are BACE1-positive (Fig. 8d). In contrast, BACE1 was rarely co-expressed with the sTAM (M1) marker HLA-DR or CD11c (Fig. 8e,f). The preferential expression of BACE1 in pTAMs was consistently found in all GBM specimens (12 cases) examined. To further investigate the clinical relevance of BACE1 expression in pTAMs in GBMs, we analyzed the relationship between BACE1 expression and the survival of GBM patients in several databases, including the Cancer Genome Atlas (TCGA), Rembrandt, Gravendeel and LeeY, finding an inverse correlation between BACE1 expression and patient survival in these databases (Extended Data Fig. 10a-d). GBM patients with higher BACE1 expression levels in their tumors clearly had a worse survival (Extended Data Fig. 10a-d), indicating that BACE1 expression predicts poor prognosis. The inverse correlation between BACE1 expression in pTAMs and the prognosis is consistent with the fact that pTAMs support malignant growth in human GBMs. Collectively, these data demonstrate that BACE1 is preferentially expressed by pTAMs in most GBMs and predicts poor prognosis for GBM patients, validating the therapeutic promise of targeting BACE1 by an inhibitor such as MK-8931 for improving GBM treatment (Extended Data Fig. 10e).
Fig. 8: BACE1 Is Preferentially Expressed by pTAMs in Human Primary GBMs.
a,b, Immunofluorescent analysis of BACE1 and the pan TAM marker IBA1 or CD11b in human GBM tumor samples. Representative immunofluorescent images (a) shows the distribution and co-localization of BACE1 (in green) with the pan TAM marker IBA1 or CD11b (in red) in a human GBM (CCF4321). Quantification (b) shows the fractions of BACE1+ TAMs (BACE1+/IBA1+ or BACE1+/CD11b+ cells) in total TAMs (IBA1+ or CD11b+ cells) in GBMs. Data are shown as means ± SEM. n = 12 GBMs.
c,d, Immunofluorescent analysis of BACE1 and the pTAM marker CD163 or FIZZ1 in human GBMs. Representative immunofluorescent images (c) show the distribution and co-localization of BACE1 (in green) with the pTAM marker CD163 or FIZZ1 (in red) in a GBM (CCF4321). Quantification (d) shows the fractions of BACE1+ pTAMs (BACE1+/CD163+ or BACE1+/FIZZ1+ cells) in pTAMs (CD163+ or FIZZ1+ cells) in GBMs. Data are shown as means ± SEM. n = 12 GBM tumors.
e,f, Immunofluorescent analysis of BACE1 and the sTAM marker HLA-DR or CD11c in human GBMs. Representative immunofluorescent images (e) show the staining of BACE1 (in green) and sTAM markers (HLA-DR or CD11c, in red) in a GBM (CCF4321). Quantification (f) shows the fractions of BACE1+ sTAMs (BACE1+/HLA-DR+ or BACE1+/CD11c+ cells) in sTAMs (HLA-DR+ or CD11c+ cells) GBMs. Data are shown as means ± SEM. n = 12 GBM tumors.
Discussion
TAMs are the most abundant immune cells in malignant tumors, including GBMs1,2. Most TAMs promote malignant growth and progression including invasion36, immune evasion37, and therapeutic resistance5. Thus, either targeting tumor-promoting pTAMs or reprograming pTAMs into tumor-suppressive sTAMs is an attractive therapeutic approach. Targeting TAMs by inhibiting colony-stimulating factor 1 receptor (CSF-1R) inhibited GBM growth in mouse models26, but clinical trials with CSF-1R inhibitors failed for GBM patients38. Because CSF-1R is also expressed by circulating monocytes and other normal cells, targeting CSF-1R resulted in serious toxic effects in clinical trials39. In our study, we demonstrate that reprograming pTAMs into sTAMs by inhibiting BACE1 with MK-8931 potently promotes TAM phagocytosis of glioma cells and effectively inhibits tumor growth. Because BACE1 inhibition by MK-8931 is well-tolerated in healthy adults21 and AD patients22,23, and MK-8931 penetrates the BBB very well20, redirecting pTAMs into sTAMs by targeting BACE1 with MK-8931 may overcome the shortcomings of targeting CSF-1R and offer a macrophage-based therapy to effectively improve cancer treatment.
The conventional strategy to activate macrophage phagocytosis uses immune checkpoint blockade or enhances the pro-phagocytosis signals40. It was shown that inhibition of the CD47-SIRPα (signal regulatory protein α) axis in TAMs inhibited brain tumor growth in animal models41,42. Recently, Dr. Gill’s team has engineered human macrophages with chimeric antigen receptor (CAR) to direct macrophage phagocytosis and shown that CAR-macrophages suppressed tumor growth and extended survival43. These approaches applied a receptor-ligand interaction to activate pro-phagocytosis signal or inhibit anti-phagocytosis signals40. In our study, we use a different approach to activate macrophage phagocytosis in tumors by reprograming TAMs through BACE1 inhibition with a small molecule, which may synergize with the conventional strategy. Clinical trials using a BACE1 inhibitor in combination with the phagocytosis checkpoint inhibitors or the CAR-macrophages may potentially benefit GBM patients.
BACE1 is a transmembrane β-secretase involved in several physiological and pathophysiological processes17. BACE1 cleaves amyloid precursor protein to cause aggregation of Aβ production in the AD brains17. However, BACE1 deficiency is well-tolerated in knockout mice17, indicating that targeting BACE1 should not cause side effects. Interestingly, microglia in BACE1-deficient mice also increased phagocytosis toward cellular debris after nerve damage44,45. However, to the best of our knowledge, the role of BACE1 in regulating TAMs has not been reported. In this study, we demonstrate that BACE1 critically maintains pTAMs in GBMs. BACE1 inhibition potently converts pTAMs into sTAMs to promote TAM phagocytosis of cancer cells. Thus, targeting BACE1 represents an attractive therapeutic strategy to improve cancer treatment.
Our previous study demonstrated that most TAMs within a GBM are derived from circulating monocytes7. Consistently, we here show that monocyte-derived macrophages mainly contribute to the anti-tumor effect of MK-8931 treatment in GBM. However, brain resident microglia may also contribute to a fraction of TAMs in some GBM animal models41,46. Resident microglia are often localized around a GBM near the tumor edge47. Interestingly, blocking the CD47-SIRPα axis promoted microglia phagocytosis and suppressed GBM tumor growth41,42. As BACE1 is also expressed by microglia and the BACE1-deficient microglia enhanced phagocytosis of cellular debris in mouse brains44,45, it is highly possible that MK-8931 treatment may also promote microglia phagocytosis of glioma cells if resident microglia are present within or surrounding a GBM.
Our preclinical studies indicate that MK-8931 is a promising drug to modulate TAM function. To enhance the therapeutic efficacy of MK-8931, we found that low doses of irradiation (IR) remarkably augmented TAM infiltration and effectively synergized with MK-8931. Radiotherapy is a standard treatment for GBM48, but GBM is highly resistant to IR, partially due to the population of GSCs that resist to conventional treatments15,49. In addition, IR often triggers inflammation response and re-modulate the TME to induce therapeutic resistance50. Our study demonstrated that low doses of IR markedly enhanced TAM infiltration into GBM. Surprisingly, the IR-induced TAMs were mainly pTAMs, although a previous in vitro study showed that IR induced monocyte polarization toward M1-like macrophages51. It is possible that IR affects macrophages in vitro and in vivo in a different manner and that varied IR doses differentially impact macrophage polarization. Interestingly, another study showed that IR induced BACE1 expression52, which should promote pTAM maintenance. Although treatment with low doses of IR alone do not significantly impact tumor growth, it provides a powerful tool to enhance TAM infiltration into tumors, which allows MK-8931 treatment to redirect the increased pTAMs into more sTAMs to better suppress tumor growth. This therapeutic strategy is particularly important for those tumors containing relatively few TAMs. Most malignant tumors contain abundant TAMs, but certain types of tumors in some patients may have fewer TAMs. In either situation, the combination of MK-8931 with low doses of IR should enhance therapeutic efficacy. As relatively high doses of IR are commonly given to GBM patients53, a new IR dosing and treatment schedule may be required for the combined treatment with MK-8931 to achieve the best efficacy. In addition, as some tumors may not contain enough infiltrating T cells to facilitate current immunotherapy, the combined MK-8931 and low doses of IR treatment may provide an alternative therapeutic strategy.
The molecular mechanisms underlying the polarization of TAMs were poorly understood. In this study, we found that BACE1 mediates the critical shedding of the membrane-bound full length IL-6R by functioning as a protease to generate the soluble form of IL-6R (sIL-6R), which activates trans-IL-6/sIL-6R/STAT3 signaling to maintain the polarization of pTAMs. Our in vivo study further demonstrated that inhibiting BACE1 with MK-8931 suppressed STAT3 activation in TAMs, resulting in reduced pTAMs, increased sTAMs, and enhanced macrophage phagocytosis of tumor cells, to effectively inhibit tumor growth. STAT3 plays multiple roles in tumor development and malignant progression54. Our previous studies demonstrated that STAT3 hyper-activation mediated by the bone marrow X-linked kinase (BMX) is required for maintaining GSC tumorigenic potential in GBM55,56. Interestingly, GSCs secrete periostin to recruit monocyte-derived TAMs into GBMs7. In turn, TAMs support GSC maintenance through PTN-PTPRZ1 signaling in GBMs8. Because GSCs play crucial roles in malignant growth and progression, including invasion57, angiogenesis58, pericyte generation58, blood-tumor barrier (BTB) formation59, and therapeutic resistance15, GSC reduction caused by the decreased pTAMs induced by BACE1 inhibition may also partially contribute to the suppression of GBM growth.
Immunotherapy is promising for cancer treatment, but most solid tumors, including GBM, respond poorly to current immune checkpoint blockade, partially due to the insufficient T cell infiltration60. However, because most malignant tumors contain abundant TAMs1,2, and we have identified an effective approach to enhance macrophage infiltration into tumors, macrophage-based therapy through BACE1 inhibition with a small molecule such as MK-8931 has several advantages: (1) This therapy not only inhibits tumor-supportive roles of pTAMs but also promotes macrophage phagocytosis to engulf cancer cells, which effectively suppresses malignant growth; (2) Redirecting pTAMs into sTAMs by MK-8931 should effectively re-modulate the tumor immune microenvironment to overcome therapeutic resistance; (3) The combined low-dose IR and MK-8931 treatment can be broadly used for most malignant tumors containing abundant or relatively fewer TAMs; (4) Because most BACE1 inhibitors, including MK-8931, developed for AD clinical trials penetrate the BBB very well, the macrophage-based therapy with a BACE1 inhibitor will overcome the BBB or BTB issue; and (5) Several BACE1 inhibitors including MK-8931, AZD3293, E2609, or CNP520 were well-tolerated by AD patients in clinical trials18, repurposing these inhibitors for macrophage-based cancer therapy should be safe, straightforward, and likely more affordable than using antibodies. We predict that this alternative immunotherapy through BACE1 inhibition has tremendous potential to effectively improve the survival of patients with malignant cancers, including GBM and brain metastases.
Methods
The collection of di-identified GBM surgical specimens from patients for this study was conducted in accordance with a protocol reviewed and approved by the Cleveland Clinic Institutional Review Broad (IRB). All animal experiments were performed in accordance with protocols approved by the IACUC at the Cleveland Clinic Lerner Research Institute. Data collection and analysis were not performed blind to the conditions of the experiments. No statistical methods were used to pre-determine sample sizes but our sample sizes are similar to those reported in our previous publications8,9,59,61. Mice bearing orthotopic GBM xenografts were allowed to be maintained until the appearance of neurological signs such as seizure or paralysis or any humane point, or maximal 6 months. No data points were excluded from the data analyses.
Cells
Cells were cultured in humidified incubators at 37°C with 5% CO2 and atmospheric oxygen. All cells were confirmed to be free from mycoplasma by using a MycoFluor™ Mycoplasma Detection Kit (ThermoFisher, M7006). 293FT cells (Clontech, 632180) were maintained in DMEM medium supplemented with 10% (v/v) fetal bovine serum (FBS, ThermoFisher, 10437-036). Human iPSCs (ALSTEM, iPS11) were grown in mTeSR1 medium (StemCell Technologies, 85850). Human iPSC-derived monocytes and macrophages were maintained in X-VIVO™ 15 medium (Lonza, 04-418Q). Human U937 cells from ATCC (CRL-1593.2™) were maintained in RPMI 1640 medium with 10% FBS. Bone-marrow derived macrophages (BMDMs) were derived from bone marrows isolated from C57BL/6 mice according to an established protocol62 and cultured in RPMI 1640 medium with 10% FBS. Human GSCs were derived from human primary GBMs (see information below) and maintained as previously described55,61. Unless otherwise indicated, the Gibco® antibiotic-antimycotic (ThermoFisher, 15240062) was used in all media.
Human GBM Surgical Specimens
Human GBM surgical specimens were collected from the Brain Tumor and Neuro-Oncology Center at the Cleveland Clinic and used for isolation of GSCs and immunofluorescent analyses. Specifically, GSCs were derived from the following human GBM tumors: CCF-DI315 (from a 49-year old male patient), CCF-3264 (from a 65-year female patient), CCF-4321 (from a 74-year old male patient), CCF-DI257 (from a 55-year old male patient), CCF-3303 (from a 36-year old female patient), and CCF-2445 GBM (from a 50-year old male patient). Frozen sections of GBMs were used for immunofluorescent staining.
Mice
Both male and female NSG mice (NOD.Cg-PrkdcscidIl2rgtm1Wjl/SzJ, 4-6 weeks old) were used for establishing GBM xenografts (PDXs) for the in vivo studies. C57BL/6 mice (both sexes, 6 weeks old) were used for isolation of bone marrows. Mice were maintained in a 12-hour light/12-hour dark cycle, and provided with sterilized water and food ad libitum at the Biological Resource Unit of the Cleveland Clinic Lerner Research Institute.
Chemicals and Reagents
MK-8931 was purchased from Selleckchem (S8173) or Medkoo (331024). Clodronate (SKU# CLD-8909) liposomes and the Control (SKU# CLD-8910) were purchased from Encapsula NanoSciences. Other reagents used in this study includes D-Luciferin (GoldBio, LUCK-10G), etoposide (Santa Cruz, sc-3512B), 32% paraformaldehyde (Electron Microscopy Sciences, 15714), protease inhibitors (Roche, 04693159001), phosphatase inhibitors (Roche, 04906837001), recombinant human EGF (GoldBio, 1150-04-100), human M-CSF (Biolegend, 574806), human IL-3 (Biolegend, 578006), and human bFGF (R&D Systems, 4114-TC-01M). Recombinant human SCF (300-07), VEGF (100-20), IL-4 (200-04), IL-6 (200-06), IL-10 (200-10), sIL-6R (200-06RC), and TGF-β (200-21) were purchased from Peprotech. The sources of other reagents are indicated in experiments described below.
Derivation of Monocytes and Macrophages from Human iPS Cells
Human iPS cells (iPSCs) were transduced with GFP through lentiviral infection and the GFP+ iPSCs were used to generate monocytes and macrophages in accordance with an established protocol8,25. To produce M2-like macrophages, the iPSC-derived monocytes were seeded in 6-well plates and primed by treatment with 5 nM of phorbol 12-myristate 13-acetate (PMA, Sigma, P1585) for two days to produce M0 macrophages, which were further treated with IL-4 (20 ng/mL), IL-10 (20 ng/mL), and TGF-β (20 ng/mL) for three days to generate M2-like macrophages.
Preparation of Bone Marrow-derived Monocytes and Macrophages
Bone marrow-derived monocytes and M2-like macrophages (BMDMs-M2) were prepared and cultured according to an established protocol62. Briefly, bone marrow cells were collected from C57BL/6 mice by flushing the femurs and tibias with sterile PBS and then treated with red blood cell lysis buffer (BioLegend, 420301) to remove red blood cells. The cells were re-suspended and cultured in RPMI 1640 medium with 10% FBS and M-CSF (100 ng/mL) for seven days to differentiate into monocytes, and further induced into M2-like macrophages (BMDMs-M2) in the presence of IL-4 (10 ng/ml) for 24 hours.
Identifying Drugs to Activate Macrophage Phagocytosis of GSC
To screen for potential small molecules that activate phagocytosis of iPSC-derived macrophages against cancer cells, GFP+ iPSC-derived macrophages (5 × 10⁴ cells) were seeded in 24-well plates and pre-treated with small molecules from a pharmacologically active compound library (SellckChem, #L1700) or known drugs in clinical trials for other diseases for two days. After 3 washes to remove drugs, the macrophages were maintained in RPMI 1640 medium for two hours. To detect and analyze macrophage phagocytosis of glioma cells by microscopy, the tdTomato-expressing glioma stem cells (GSCs: CCF-3264, in red) were added to each well and co-incubated with the macrophages in RPMI 1640 medium with 10% FBS for two hours. After incubation, the co-cultures were washed three times with warm RPMI 1640 medium to remove free cancer cells, and fluorescent and phase images were captured with a fluorescent or confocal microscope. Phagocytosis was detected and measured as inclusion bodies of cancer cells (in red) within macrophages (in green) according to a published study24. To quantify macrophage phagocytosis of glioma cells in vitro, flow cytometric analyses of macrophage phagocytosis were performed according to previous studeis41,42. Briefly, the GFP+-iPSC-derived macrophages (in green) were pre-treated with MK-8931 (50 μg/mL) or the vehicle control for 48 hours, then washed to remove drugs, and maintained in RPMI 1640 medium for two hours. The pre-treated GFP+-iPSC-derived macrophages (5 × 10⁴) were mixed with tdTomato-expressing glioma cells (CCF-3264, 2 × 10⁵) and co-incubated in an ultra-low attachment plate (Costar, 7007) for two hours. The co-cultured cells were washed with PBS and re-suspended in PBS for flow cytometric analysis with the BD LSRFortessa™ cell analyzer. Data analysis was performed with the FlowJo software. The GFP+/tdTomato+ cells were gated and recognized as macrophages containing the engulfed glioma cells.
To detect the MK-8931-activated phagocytosis of BMDMs-M2 macrophages against cancer cells, BMDMs-M2 macrophages were pre-treated with MK-8931 (50 μg/mL) or Dimethylsulfoxide (DMSO, Santa Cruz, sc-358801; Control) for two days. The pre-treated macrophages were stained with CellTracker™ Green CMFDA Dye (1 μM, ThermoFisher, C2925) in RPMI 1640 medium for 10 minutes. After 3 washes, the BMDMs-M2 macrophages were maintained in RPMI 1640 medium for two hours and then tdTomato-expressing CCF-3264 GSCs (2 × 10⁵ cells) were added to each well and co-incubated with the labelled BMDM macrophages in RPMI 1640 medium with 10% FBS for two hours. After incubation, the co-cultures were washed three times with warm RPMI 1640 medium to remove free cancer cells, and the fluorescent images were captured with a fluorescent or confocal microscope.
For 3D reconstruction, serial images of glioma cells (Red channel) engulfed by macrophages (Green channel) were captured in a Z-stack scanning model with a confocal microscope (Leica SP5). The Z-stack data were further analyzed with the Image J software and the 3D images were generated with the 3D view plugin tool.
Plasmids for Overexpression or Knockdown
To construct pCDH-tdTomato expression plasmid, full-length tdTomato was amplified from the pCDH-EF1-Luc2-P2A-tdTomato (Addgene, 72486) with a pair of primers (Forward: 5'-GCTAGCCCAATCATTTAAATATAACTT-3', Reverse: 5'-GCGGCCGCTTACTTGTACAGCTCGTCCATGC-3'), and then cloned into the pCDH-CMV-MCS-EF1α-Neo vector at the Nhe1 and Not1 sites. The sequence of inserted tdTomato was confirmed by DNA sequencing. The constitutively active STAT3 (STAT3-C-Flag) and pCDH-luciferase constructs were generated as previously described7,56. Specific shRNAs against BACE1 (shBACE1; #1: TRCN0000000277, #2: TRCN0000000279) or a non-targeting shRNA (shNT; SHC002) were purchased from Sigma-Aldrich. The lentivirus packaging vectors (ps-PAX2, 12260; and pCI-VSVG, 1733) were from Addgene. The plasmids for expressing human BACE1 with the C-terminal His-tag (HG10064-CH) and human IL-6R with the C-terminal Flag-tag (HG10398-CF) were obtained from Sino Biological.
Production of Lentiviruses
Lentiviruses for expressing shBACE1 or shNT, or an ectopic protein (STAT3-C) were produced in 293FT cells and prepared as previously described8,55,59. For infection, cells were treated with lentivirus at a multiplicity of infection (MOI) of 1.
Generation of Stable Cell Lines
To generate tdTomato-expressing stable glioma cells, GSCs (CCF-3264 or CCF-DI315) were transduced with pCDH-tdTomato through lentiviral infection for 12 hours. Two days post-infection, the cells were treated with neomycin (500 μg/mL, Santa Cruz, sc-29065A) for seven days to select stable clones expressing tdTomato (red).
To generate luciferase-expressing stable glioma cells, GSCs (CCF-3264 or CCF-DI315) were transduced with firefly luciferase through lentiviral infection for 12 hours. Two days post-infection, cells were treated with puromycin (2 μg/mL, Fisher Scientific, BP2956100) for seven days to select stable clones. The luciferase activity was confirmed by using the Luciferase Assay System (Promega, E1500).
To establish stable U937 cells expressing shBACE1 or shNT, the cells were transduced with shBACE1 or shNT through lentiviral infection. Two days post-infection, the cells were treated with puromycin (2 μg/mL) for seven days to select stable clones. Knockdown of BACE1 was confirmed by immunoblot.
Derivation of M2-like Macrophages from U937 Monocytes
U937 monocyte-derived M2-like macrophages (U937-M2 macrophages) were prepared according to an established protocol8,9. Briefly, cells grown in a 10-cm culture dish were primed with PMA (5 nM) for two days to produce M0 macrophages, which were further induced by IL-4 (20 ng/mL), IL-10 (20 ng/mL), and TGF-β (20 ng/mL) for three days to generate U937-M2 macrophages.
RNA Isolation and RT-PCR
Total RNA was isolated from cells by using the PureLink™ RNA Kit (ThermoFisher, 12183020) and reverse-transcribed into cDNA with M-MLV reverse transcriptase (Promega, PR-M1701). Real-time PCR (qPCR) was performed in an ABI 7500 Real-Time PCR System (Applied Biosystems) by using the SYBR-green qPCR Kit (Alkali Scientific, QS2050). Expression values were normalized to GAPDH. Gene-specific primers include: BACE1 (forward): 5'-GCAGGGCTACTACGTGGAGA-3', BACE1 (reverse): 5'-GTATCCACCAGGATGTTGAGC-3'; GAPDH (forward): 5'-AAGGTGAAGGTCGGAGTCAAC-3', GAPDH (reverse) 5'-GGGGTCATTGATGGCAACAATA-3'.
Establishment of GBM Xenografts and Drug Treatment in vivo
To establish xenografts for in vivo studies, intracranial transplantation of GSCs into the brains of NSG mice was performed as described previously7-9,15. Briefly, GSCs expressing luciferase were transplanted into the right cerebral cortex at a depth of 3.5 mm through intracranial injection. Mice were maintained until the appearance of neurological signs or a humane endpoint. For the co-transplantation experiments, human GSCs (CCF-DI315) expressing luciferase in combination with or without the monocyte-derived macrophages expressing shBACE1 (shBACE1: #1 or #2) or non-targeting control (shNT) were co-injected into NSG mouse brains through intracranial injection (GSCs : Macrophages = 1 : 2).
For drug treatment, a stock solution of MK-8931 at 100 mg/mL in DMSO was diluted in 0.5% (w/v) methylcellulose (Sigma-Aldrich, M0512) to 6 mg/mL20. Mice bearing the xenografts were treated with MK-8931 (30 mg/kg/daily) or the control (DMSO) by oral gavage for two weeks or until the humane endpoint. To deplete monocyte-derived TAMs in GBM xenografts, mice bearing the xenografts were treated with Clodronate liposomes (50 mg/kg) or Control liposomes through intraperitoneal (IP) injection once every three days beginning on the fourth day after GSC transplantation.
Isolation of TAMs from GBM Xenografts by FACS
Total TAMs (CD45+/Gr1−/CD11b+/DAPI−) were sorted from GBM xenografts through the fluorescence-activated cell sorting (FACS). Briefly, GBM xenografts were resected and mechanically dissociated and then digested in HBSS buffer containing DNase I (10 μg/mL, Sigma Aldrich, 10104159001) and Liberase (25 μg/mL, Roche, 5401020001) for 45 min at 37°C, and mixed by pipetting every 10 min. After digestion, cell suspensions were passed through a 70 μm filter, washed with cold PBS, and spun down (800 rpm) for 10 min at 4°C. Red blood cells in the samples were removed with the specific lysis buffer (BioLegend, 420301). The dissociated cells were re-suspended in RPMI 1640 medium and blocked with rat IgG (Santa Cruz, sc-2026) for 15 minutes before staining with specific antibodies for sorting. Antibodies used for FACS include: anti-CD45 (Biolegend, 103127, Clone 30-F11), anti-Gr1 (Biolegend, 108405, Clone RB6-8C5), and anti-CD11b (Biolegend, 101207, clone M1/70). The sorted TAMs (CD45+/Gr1−/CD11b+/DAPI−) were then used for RNA-seq analyses or the flow cytometric analyses to quantify macrophage phagocytosis of glioma cells in vivo as described below.
Flow Cytometric Analyses of in vivo TAM Phagocytosis
The flow cytometric analyses of macrophage phagocytosis of tumor cells in vivo were performed according to a previous study63. Briefly, the sorted TAMs were fixed with 4% paraformaldehyde for ten minutes, washed with cold PBS three times, permeabilized with 0.5 % (v/v) triton X-100 (Bio-Rad, 1610407), blocked with 5% BSA for one hour, incubated with the PE-conjugated anti-mouse CD11b antibody (Biolegend, 101207, M1/70) and the FITC-conjugated anti-human TRA-1-85 antibody (Miltenyi Biotec, 130-107-161, REA476) for one hour at room temperature in the dark. After the staining, the cells were washed with PBS and re-suspended in PBS for flow cytometric analysis with the BD LSRFortessa™ cell analyzer. Data analysis was performed with the FlowJo software. The CD11b+/TRA-1-85+ cells were gated and recognized as TAMs containing engulfed glioma cells.
RNA Sequencing (RNA-Seq) Analyses
To examine the effect of MK-8931 treatment on TAMs in vivo, total TAMs (CD45+/Gr1−/CD11b+/DAPI−) were isolated from MK-8931-treated or control GBM xenografts through FACS sorting described above. To investigate the potential effect of MK-8931 on GSCs, CCF-3264 GSCs were treated with MK-8931 (50 μg/mL) or control vehicle for 72 hours. Total RNA samples were extracted from the sorted TAMs or GSCs by using the PureLink™ RNA Kit (ThermoFisher, 12183020). RNA-seq analyses were performed via the Illumina platform (Novogene, Sacramento, CA). Analyses of differential gene expression between MK-8931-treated and control samples were performed by using the DESeq2 R package. The resulting P-values were adjusted using the Benjamini and Hochberg’s approach for controlling the false discovery rate. Genes with a p-value < 0.05 from DESeq2 were considered significantly different from the control. The volcano plots were created using the volcano plot function in R software (https://www.r-project.org/). The gene ontology (GO) enrichment analyses of differentially expressed genes were performed using the ClusterProfiler R package. GO terms with corrected p-value <0.05 were considered significantly enriched.
Irradiation on Intracranial GBM Xenografts (PDXs)
Irradiation (IR) was performed with a Pantek X-ray irradiator at a low dose (2 Gy). To protect the mice and limit the side effects of irradiation, anesthetized mice were covered with a lead plate and only the tumor implantation sites were exposed to the fractioned radiation. Mouse brains bearing the tumors were collected through cardiac perfusion with PBS and 4% paraformaldehyde for further analyses.
Immunofluorescent Analysis
Immunofluorescent staining of tumor tissues or cells was performed as previously described7-9,15. Briefly, tumor sections or cells were fixed with 4% paraformaldehyde, washed with PBS, permeabilized with 0.5 % (v/v) triton X-100 (Bio-Rad, 1610407), and blocked with 3% (w/v) BSA (Sigma-Aldrich, A7906) in PBS. For Ki67 and pSTAT3 staining, antigen retrieval was performed by incubating the sections in boiled antigen retrieval buffer (Vector Laboratories, H-3300). Primary antibodies (listed in Supplementary Table1) were added to the sections or cells and incubated overnight at 4°C. After three washes with cold PBS, samples were incubated with secondary antibodies (listed in Supplementary Table 1) for one hour at room temperature, counterstained with DAPI (Cell Signaling, 4083, 1:5000) and sealed with mounting medium (Sigma-Aldrich, F4680). Finally, images were captured by a fluorescence microscopy (Leica DM4000) and further analyzed with ImageJ software (https://imagej.nih.gov/).
Immunoblot Analyses
Immunoblot analysis was performed as previously described7-9,15. Briefly, cells were lysed with RIPA buffer [50 mM TrisHCl (pH7.4), 150 mM NaCl, 2 mM EDTA, 1% (v/v) NP-40, 0.1% (w/v) SDS, protease inhibitors (one tablet per 10 mL of RIPA buffer)] for 20 minutes on ice. For blots of phosphorylated proteins, phosphatase inhibitors (one tablet per 10 mL RIPA buffer) were used. The cell lysates or conditioned medium (in some experiments) were collected and subjected to SDS-PAGE and blotted onto PVDF membranes (ASI, XR730). After blocking with 5% (w/v) non-fat milk in TBST, the membranes were incubated with primary antibodies (listed in Supplementary Table 1) overnight at 4°C. After three washes with TBST, the membranes were incubated with the HRP-linked secondary antibodies (listed in Supplementary Table 1) in 5% milk for one hour at room temperature. Signals on the membranes were developed with the ECL HRP substrates (Advansta, K-12045) and images were acquired by a molecular imager (Bio-Rad, Universal Hood II) and analyzed by the Image Lab software (Bio-Rad).
Statistics and Reproducibility
GraphPad Prism 9 (https://www.graphpad.com/) was used for data analysis. Data are shown as means ± SEM unless otherwise indicated. Statistical differences were determined between two groups using the two-tailed Student’s t test or among multiple groups using one-way ANOVA. Significant significance was set at p < 0.05. For all quantitative data, the statistical test used is indicated in figure legends. For in vitro studies, experiments included three or more independent biological replicates stated in each experiment. For in vivo studies, mice were randomized into different groups based on the bioluminescent signal of initial tumor burden before any treatments. Mice numbers for each experiment were clearly indicated in Figure legends. To analyze the relationship between BACE1 expression and survival of GBM patients, the data were downloaded from GlioVis (http://gliovis.bioinfo.cnio.es/). The patients were divided into Bace1high and Bace1low groups, and the log-rank survival analysis was performed with GraphPad Prism 9 to generate the Kaplan-Meier survival curves.
Extended Data
Extended Data Fig. 1. Derivation of Macrophages from Human iPS Cells (iPSCs).
a, A brief protocol for generating monocytes and macrophages from human iPS cells (iPSCs) expressing GFP. EB: Embryonic body; PMA: Phorbol 12-myristate 13-acetate.
b, A brief protocol for the generation of M2-like macrophages (iPSC-M2) from iPSC-derived monocytes expressing GFP.
c, Immunofluorescent analysis of the pan macrophage markers (CCR2, CD11b and IBA1; in red), the M2 macrophage makers (ARG1 and FIZZ1; in red), BACE1 (in red), or the microglia-specific markers (TMEM119 and CX3CR1; in red) in iPSCs-M2 macrophages. Representative immunofluorescent images show expression of BACE1, the pan macrophage markers, and the M2 macrophage markers in iPSC-M2 macrophages.
d,e, Flow cytometric analyses of macrophage phagocytosis of human glioma cells in vitro. Representative flow cytometric plots (d) shows the gating strategy for identifying macrophage phagocytosis of glioma cells (CCF-3264, tdTomato+) in iPSC-derived macrophages (GFP+) that were pre-treated with MK-8931 (50 μg/mL) or vehicle control for 48 hours. Quantification (e) of the flow cytometric analyses shows fractions of macrophage phagocytosis of glioma cells (GFP+/tdTomato+). Data are shown as means ± SEM. n = 10 independent phagocytosis assays per group. Statistical significance was determined by two-tailed Student’s t-test; p<0.0001.
Extended Data Fig. 2. BACE1 Inhibition Promotes Macrophage Phagocytosis of Glioma Cells in vitro and in vivo.
a, Immunofluorescent analyses of pan TAM markers (IBA1 or CD11b), M2 macrophage makers (CD163, ARG1, or FIZZ1), and BACE1 expression in bone marrow-derived M2-like macrophages (BMDMs-M2). Representative images show expression of BACE1 and M2 macrophage markers in BMDMs-M2 macrophages.
b, Immunofluorescent analysis of BACE1 expression in BMDMs-M2 macrophages transduced with shBACE1 or shNT (control).
c,d, Representative fluorescent images (c) show phagocytosis of BMDMs (in green) against GSCs (CCF-3264, in red) after BACE1 disruption in BMDMs. Quantification (d) shows fractions of BMDMs containing engulfed glioma cells. Data are shown as means ± SEM. n = 3 independent experiments (about 300 BMDMs/group/experiment). Statistical significance was determined by two-tailed Student’s t-test; p=0.0337.
e, In vitro analyses of macrophage phagocytosis of glioma cells by confocal microscopy and Z-stack reconstruction to confirm the engulfment of GSCs (in red) by BMDMs (in green) after BACE1 disruption. Representative 2D and 3D images are shown.
f,g, Representative images (f) and quantification (g) show MK-8931-activated TAM (IBA1+, in green) phagocytosis of glioma cells (TRA-1-85+, in red) in GBM xenografts derived from CCF-DI315 GSCs. Data are shown as means ± SEM. n = 6 tumor samples (each sample includes about 80 TAMs). Statistical significance was determined by two-tailed Student’s t-test; p=0.0014. Ctl: Control; MK: MK-8931.
h,i, Representative flow cytometric plots (h) show gating strategy for identifying TAM (CD45+/Gr1−/CD11b+/DAPI−) phagocytosis of tumor cells (TRA-1-85+) from GBM xenografts treated with MK-8931 or vehicle control. Quantifications (i) of TAM phagocytosis show fractions of macrophage phagocytosis of glioma cells (CD11b+/TRA-1-85+) in the treated and control xenografts. Data are shown as means ± SEM. n = 5 tumor samples per group. Statistical significance was determined by two-tailed Student’s t-test; p<0.0001.
Extended Data Fig. 3. BACE1 Is Highly Expressed by pTAMs in GBM Xenografts.
a,b, Immunofluorescent analyses of BACE1 and the pan TAM marker IBA1 or CD11b in GBM xenografts derived from GSCs (CCF-3264 or CCF-DI315). Representative immunofluorescent images (a) show the distribution and co-localization of BACE1 (in green) with the pan TAM marker (IBA1 or CD11b; in red) in GBM xenografts. Quantifications (b) show the fractions of BACE1-positive TAMs (BACE1+/IBA1+ or BACE1+/CD11b+ cells) in total TAMs (IBA1+ or CD11b+ cells) in GBM xenografts. Data are shown as means ± SEM. n = 6 GBM xenografts per group.
c,d, Immunofluorescent analyses of BACE1 and the pTAM marker CD163 or FIZZ1 in GBM xenografts derived from GSCs (CCF-3264 or CCF-DI315). Representative immunofluorescent images (c) show the distribution and co-localization of BACE1 (in green) with pTAM markers (CD163 and FIZZ1; in red) in GBM xenografts. Quantification (d) shows the fractions of BACE1-positive pTAMs (BACE1+/CD163+ or BACE1+/FIZZ1+ cells) in total pTAMs (CD163+ or FIZZ1+ cells) in GBM xenografts. Data are shown as means ± SEM. n = 6 GBM xenografts per group.
e,f, Immunofluorescent analyses of BACE1 and the sTAM marker HLA-DR or CD11c in GBM xenografts derived from GSCs (CCF-3264 or CCF-DI315). Representative immunofluorescent images (e) show staining of BACE1 (in green) and the sTAM markers (HLA-DR or CD11c; in red) in GBM xenografts. Quantification (f) shows the fractions of BACE1+ sTAMs (BACE1+HLA-DR+ or BACE1+CD11c+ cells) in total sTAMs (HLA-DR+ or CD11c+ cells) in GBM xenografts. Data are shown as means ± SEM. n = 6 GBM xenografts per group.
Extended Data Fig. 4. The Effects of MK-8931 Treatment on Apoptosis, Proliferation, Vessel density and GSC population in GBM Xenografts.
a,b, Representative immunofluorescent images (a) of cleaved caspase-3 staining to detect apoptosis in MK-8931-treated or control GBM xenografts derived from GSCs (CCF-3264 or CCF-DI315). Quantifications (b) show fractions of cleaved caspase-3+ cells in the MK-8931-treated or control tumors. CCF-3264 xenografts: n = 10 (MK-8931-treated) or 8 (control) tumors; CCF-DI315 xenografts: n = 5 tumors per group.
c,d, Representative immunofluorescent images (c) of CD31 staining to examine vessel density in MK-8931-treated or control GBM xenografts derived from GSCs (CCF-3264 or CCF-DI315). Quantifications (d) show relative vessel density (CD31+ cells) in the MK-8931-treated or control tumors. CCF-3264 xenografts: n = 6 (MK-8931-treated) or 7 (control) tumors; CCF-DI315 xenografts: n = 5 tumors per group.
e,f, Representative immunofluorescent images (e) of Ki-67 staining to detect cell proliferation in MK-8931-treated or control GBM xenografts derived from GSCs (CCF-3264 or CCF-DI315). Quantifications (f) show that fractions of proliferative cells (Ki-67+) in the MK-8931-treated or control tumors. CCF-3264 xenografts: n = 10 (MK-8931-treated) or 8 (control) tumors; CCF-DI315 xenografts: n = 5 tumors per group.
g,h, Representative immunofluorescent images (g) of SOX2 staining to detect GSC populations in MK-8931-treated or control GBM xenografts derived from GSCs (CCF-3264 or CCF-DI315). Quantifications (h) show the fractions of GSCs (SOX2+ cells) in the MK-8931-treated or control tumors. CCF-3264 xenografts: n = 6 (MK-8931-treated) or 7 (control) tumors; CCF-DI315 xenografts: n = 5 tumors per group.
Data are shown as means ± SEM; statistical significance was determined by two-tailed Student’s t-test; p values are indicated on the figures (b,d,f,h).
Extended Data Fig. 5. MK-8931 Treatment Shows Little Effect on Glioma Cells in Vitro.
a,b, Representative images (a) of tumorspheres derived from CCF-3264 GSCs treated with MK-8931 (50 μg/mL) or vehicle control. Quantifications (b) show the number and size of tumorspheres treated with MK-8931 or control. Data are shown as means ± SEM. Statistical significance was determined by two-tailed Student’s t-test. n = 3 independent experiments; ns, not significant.
c, Immunoblot analysis of SOX2 expression in GSCs (CCF-3264 and CCF-DI315) treated with MK-8931 (50 μg/mL) or the vehicle control for three days. GAPDH was blotted as control. Similar results were confirmed in 3 independent experiments.
d, Immunoblot analyses of cleaved PARP and cleaved caspase 3 to detect apoptosis in GSCs (CCF-3264 and CCF-DI315) treated with MK-8931 (50 μg/mL), etoposide (Etop, 1 μM), or the vehicle control for indicated times. GAPDH was blotted as control. Ctl: Control; Etop: Etoposide. Similar results were confirmed in 3 independent experiments.
e, Cell viability assay of GSCs (CCF-3264 and CCF-DI315) treated with MK-8931 (10 or 50 μg/mL) or the vehicle control for three days to examine the effect of MK-8931 treatment on glioma cells. Data are shown as means ± SEM. Significance was determined by one-way ANOVA analysis. n = 4 independent experiments; ns, not significant.
f,g, RNA-seq analyses of GSCs treated with MK-8931 (50 μg/mL) or the vehicle control. The Volcano plot (f) shows differentially and non-differentially expressed genes. Green dots represent the up-regulated genes (40); red dots represent the down-regulated genes (57); and blue dots represent the unaffected genes (24289) by MK-8931 treatment in GSCs. Gene ontology analysis (g) predicts differentially expressed genes enriched in the indicated cellular processes, but none of them was significantly affected by MK-8931 treatment in GSCs.
Extended Data Fig. 6. BACE1 Is Required for the Maintenance of M2-like Macrophages Derived from U937.
a, A protocol for derivation of M2-like macrophages from U937 monocytes (U937-M2) in vitro. Briefly, U937 cells were primed by phorbol 12-myristate 13-acetate (PMA, 5 nM) for two days to generate M0 macrophages and then incubated with IL-4 (20 ng/mL), IL-10 (20 ng/mL), and TGF-β (20 ng/mL) for three days to produce U937-M2 macrophages.
b, qPCR analyses of BACE1 mRNA expression in U937 monocytes, U937-derived M0 macrophages, and U937-derived M2-like macrophages. Data are shown as means ± SEM. n = 3 independent experiments. Statistical significance was determined by one-way ANOVA analysis; U937 vs M0: p=0.0060; U937 vs M2: p=0.0002; M0 vs M2: p=0.0064.
c, Immunoblot analyses of BACE1 and the M2 markers (CD163 and FIZZ1) in U937 monocytes, U937-derived M0 macrophages, and U937-derived M2-like macrophages. GAPDH was blotted as the loading control. Similar results were obtained in 3 independent experiments.
d, Immunoblot analyses of BACE1, the M2 markers (CD163 and ARG1), and the pan macrophage marker IBA1 in U937-M2 macrophages expressing shBACE1 or non-targeting sequence (shNT). GAPDH was blotted as the loading control. Similar results were obtained in 3 independent experiments.
e, Immunoblot analyses of the M2 markers (CD163 and ARG1) and the total macrophage marker IBA1 in U937-M2 macrophages treated with MK-8931 (50 μg/mL) or the vehicle control for three days. GAPDH was blotted as the loading control. Similar results were obtained in 3 independent experiments.
Extended Data Fig. 7. RNA-seq Analyses of Isolated TAMs from GBM Xenografts Treated with MK-8931 or the Vehicle Control in vivo.
a, The volcano plot of differentially and non-differentially expressed genes revealed by RNA-seq analyses in the total TAMs (CD45+/Gr1−/CD11b+/DAPI−) sorted from CCF-3264 GSCs-derived GBM xenografts treated with MK-8931 or vehicle control. The log2 fold change is plotted on the x-axis and the negative log10-adjusted p-value is plotted on the y-axis. Green dots represent the genes up-regulated by MK-8931 treatment in TAMs; red dots represent the genes down-regulated by MK-8931 treatment in TAMs; and blue dots represent the genes that were not affected by MK-8931 treatment in TAMs.
b, Heat map showing differential expression of genes in TAMs (CD45+/Gr1−/CD11b+/DAPI−) isolated from CCF-3264 GSCs-derived GBM xenografts treated with MK-8931 or vehicle control. Expressions of 336 genes (242 genes upregulated, and 94 genes downregulated) were significantly altered by MK-8931 treatment in TMAs sorted from GBM xenografts. Ctl: Control; MK: MK-8931.
c, Gene ontology enrichment analyses showing potential association between differentially expressed genes affected by MK-8931 treatment in TAMs sorted from CCF-3264 GSCs-derived GBM xenografts and the cellular activities involved in immune cell migration, activation, and adhesion, and inflammatory response.
d, Gene expression analyses of the M1 (sTAM) and M2 (pTAM) macrophage-related genes in TAMs (CD45+/Gr1−/CD11b+/DAPI−) sorted from MK-8931-treated GBM xenografts (from CCF-3264 GSCs) relative to that from the control tumors. Nearly all the M1 macrophage (sTAM)-related genes including iNOS (mouse gene: Nos2) and MHC II (mouse genes: H2ab1, H2eb1, H2aa) were upregulated by MK-8931 treatment, while the majority of the M2 macrophage (pTAM)-related genes including CD163 (mouse gene: Cd163) and FIZZ1 (mouse gene: Retnla) were downregulated in TAMs by MK-8931 in vivo.
Extended Data Fig. 8. BACE1 Inhibition by MK-8931 Redirects pTAMs into sTAMs in GBM Xenografts.
a,b, Analysis of relative density of pTAMs by immunofluorescent staining of pTAM markers (CD163 and FIZZ1) and the pan TAM marker IBA1 in GBM xenografts derived from CCF-DI315 GSCs and treated with MK-8931 (30 mg/kg/daily) or a vehicle control for two weeks. Representative images (a) show immunofluorescent staining of pTAMs (CD163+ or FIZZ1+, in red) and total TAMs (IBA1+, in green) in the MK-8931-treated or control GBM xenografts. Quantifications (b) show relative density of pTAMs (CD163+/IBA1+ or FIZZ1+/IBA1+) to total TAMs (IBA1+) in GBM xenografts treated with MK-8931 or the vehicle control. Data were shown as means ± SEM. n = 6 GBM samples per group. Statistical significance was determined by two-tailed Student’s t-test; p<0.0001. Ctl: Control; MK: MK-8931.
c,d, Analysis of relative density of sTAMs by immunofluorescent staining of sTAM markers (HLA-DR and CD11c) and the total TAM marker IBA1 in GBM xenografts derived CCF-DI315 GSCs and treated with MK-8931 (30 mg/kg/daily) or a vehicle control for two weeks. Representative images (c) show immunofluorescent staining of sTAMs (HLA-DR+ or CD11c+, in red) and total TAMs (IBA1+, in green) in MK-8931-treated or the control GBM xenografts. Quantifications (d) show relative density of sTAMs (HLA-DR+/IBA1+ or CD11c+/IBA1+) to total TAMs (IBA1+) in GBM xenografts treated with MK-8931 or the vehicle control. Data are shown as means ± SEM. n = 6 GBM tumors. Statistical significance was determined by two-tailed Student’s t-test; p values are indicated on the figure. Ctl: Control; MK: MK-8931.
Extended Data Fig. 9. The Effect of the Combined Low Doses of Irradiation and MK-8931 Treatment on TAM Polarization in GBM Xenografts.
a-c, Analyses of relative density of pTAMs (a) or sTAMs (b) by double immunofluorescent staining of the pan TAM marker IBA1 (in green) and the pTAM marker CD163 (in red) or the sTAM marker HLA-DR (in red) in CCF3264 GSC-derived GBM xenografts treated with MK-8931, Irradiation (IR, 2×2 Gy), IR plus MK-8931, or a vehicle control. Representative images show immunofluorescent staining of IBA1 and the pTAM marker CD163 (a) or IBA1 and the sTAM marker HLA-DR (b) in GBM xenografts from the four groups. Quantifications (c) show fractions of total TAMs (IBA1+ cells), pTAMs (IBA1+/CD163+ cells) and sTAMs (IBA1+/HLA-DR+ cells) in GBM xenografts from the four groups. Data are shown as means ± SEM. n = 5 GBM tumors per group. Statistical significance was determined by one-way ANOVA analysis; p values are indicated on the figure.
d,e, In vivo analysis of cell apoptosis by immunofluorescent staining of cleaved caspase-3 in CCF3264 GSC-derived GBM xenografts treated with MK-8931, IR (2×2 Gy), IR plus MK-8931, or a vehicle control. Representative images (d) show immunofluorescent staining of cleaved caspase-3 in GBM xenografts from the four groups. Quantifications (e) show the fractions of cleaved caspase-3+ (CC-3+) cells in GBM xenografts from the four groups. Data are shown as means ± SEM. n = 6-8 GBM tumors per group. Statistical significance was determined by one-way ANOVA analysis; p values are indicated on the figure.
Ctl: Control; MK: MK-8931; IR: Irradiation.
Extended Data Fig. 10. BACE1 Expression Predicts Poor Survival of GBM Patients.
a-d, Kaplan-Meier survival analyses showing an inverse correlation between BACE1 expression and overall survival of GBM patients in the databases of TCGA-GBM (a), Rembrandt (b), Gravendeel (c), and LeeY (d). Two-tailed log-rank test was used for the analyses. a: n = 130 (BACE1high) or 134 (BACE1low) GBM patients; p=0.0202; b: n = 76 (BACE1high) or 76 (BACE1low) GBM patients; p=0.0098; c: n = 76 (BACE1high) or 77 (BACE1low) GBM patients; p=0.0049; d: n = 46 (BACE1high) or 48 (BACE1low) GBM patients; p=0.0053.
e, A schematic illustration showing that BACE1 inhibition by MK-8931 reprograms pTAMs into sTAMs to promote TAM phagocytosis of cancer cells and thus suppresses tumor growth. Most malignant tumors including GBM contain abundant tumor-promoting TAMs (pTAMs). BACE1-mediated STAT3 activation is required for maintaining pTAMs. Targeting BACE1 by its inhibitor MK-8931 redirects pTAMs into sTAMs to engulf glioma cells and re-modulate the tumor microenvironment. Thus, BACE1 inhibition by MK-8931 potently suppresses malignant growth of GBM, highlighting the promising therapeutic potential of the macrophage-based therapy through BACE1 inhibition with MK-8931 to improve survival of cancer patients.
Supplementary Material
Acknowledgments
We thank the Brain Tumor and Neuro-Oncology Centers at the Cleveland Clinic for providing GBM surgical specimens for this study. We greatly appreciate the help provided by Ms. Mary McGraw from the Brain Tumor Bank at the Cleveland Clinic. We thank the Flow Cytometry Core, Imaging Core, and Central Cell Services at Cleveland Clinic Lerner Research Institute for their assistance. This work was supported by Cleveland Clinic Foundation and NIH R01 grants NS091080 and NS099175 (to S.B.). This work utilized an IVIS system (Spectrum CT) that was purchased with NIH SIG grants 1S10RR031536-01 and S10OD018205.
Footnotes
Competing Interests Statement
S.B. and K.Z are listed as inventors in a pending patent application related to this study. Other authors declare no competing interests.
Data Availability Statement
Numerical and immunoblot source data for Figs. 1-8 and Extended Data Figs. 1-10 are provided with this paper. Any additional data that support the findings of this study are available from the corresponding author upon reasonable request. Further information on research design is available in the Nature Research Reporting Summary linked to this article. All RNA-seq data were deposited in the Gene Expression Omnibus under the accession codes GSE181649 and GSE181650. The TCGA dataset was downloaded from GlioVis (http://gliovis.bioinfo.cnio.es/). GSC lines are provided upon request to S.B. through a materials transfer agreement.
References
- 1.Klemm F, et al. Interrogation of the Microenvironmental Landscape in Brain Tumors Reveals Disease-Specific Alterations of Immune Cells. Cell 181, 1643–1660 (2020). [DOI] [PMC free article] [PubMed] [Google Scholar]
- 2.Guerriero JL Macrophages: The Road Less Traveled, Changing Anticancer Therapy. Trends Mol. Med 24, 472–489 (2018). [DOI] [PMC free article] [PubMed] [Google Scholar]
- 3.Sorensen MD, Dahlrot RH, Boldt HB, Hansen S & Kristensen BW Tumour-associated microglia/macrophages predict poor prognosis in high-grade gliomas and correlate with an aggressive tumour subtype. Neuropathol. Appl. Neurobiol 44, 185–206 (2018). [DOI] [PubMed] [Google Scholar]
- 4.Lambrechts D, et al. Phenotype molding of stromal cells in the lung tumor microenvironment. Nat. Med 24, 1277–1289 (2018). [DOI] [PubMed] [Google Scholar]
- 5.Gregoire H, et al. Targeting Tumor Associated Macrophages to Overcome Conventional Treatment Resistance in Glioblastoma. Front. Pharmacol 11, 368 (2020). [DOI] [PMC free article] [PubMed] [Google Scholar]
- 6.Sica A, Schioppa T, Mantovani A & Allavena P Tumour-associated macrophages are a distinct M2 polarised population promoting tumour progression: Potential targets of anti-cancer therapy. Eur. J. Cancer 42, 717–727 (2006). [DOI] [PubMed] [Google Scholar]
- 7.Zhou W, et al. Periostin secreted by glioblastoma stem cells recruits M2 tumour-associated macrophages and promotes malignant growth. Nat. Cell Biol 17, 170–182 (2015). [DOI] [PMC free article] [PubMed] [Google Scholar]
- 8.Shi Y, et al. Tumour-associated macrophages secrete pleiotrophin to promote PTPRZ1 signalling in glioblastoma stem cells for tumour growth. Nat. Commun 8, 15080 (2017). [DOI] [PMC free article] [PubMed] [Google Scholar]
- 9.Tao W, et al. Dual Role of WISP1 in maintaining glioma stem cells and tumor-supportive macrophages in glioblastoma. Nat. Commun 11, 3015 (2020). [DOI] [PMC free article] [PubMed] [Google Scholar]
- 10.Grabowski MM, et al. Immune suppression in gliomas. J. Neurooncol 151, 3–12 (2021). [DOI] [PMC free article] [PubMed] [Google Scholar]
- 11.Zhao J, et al. Immune and genomic correlates of response to anti-PD-1 immunotherapy in glioblastoma. Nat. Med 25, 462–469 (2019). [DOI] [PMC free article] [PubMed] [Google Scholar]
- 12.Glass R & Synowitz M CNS macrophages and peripheral myeloid cells in brain tumours. Acta Neuropathol. 128, 347–362 (2014). [DOI] [PubMed] [Google Scholar]
- 13.Reardon DA, et al. Effect of Nivolumab vs Bevacizumab in Patients With Recurrent Glioblastoma: The CheckMate 143 Phase 3 Randomized Clinical Trial. JAMA Oncol. 6, 1003–1010 (2020). [DOI] [PMC free article] [PubMed] [Google Scholar]
- 14.Wen PY & Kesari S Malignant gliomas in adults. N. Engl. J. Med 359, 492–507 (2008). [DOI] [PubMed] [Google Scholar]
- 15.Bao S, et al. Glioma stem cells promote radioresistance by preferential activation of the DNA damage response. Nature 444, 756–760 (2006). [DOI] [PubMed] [Google Scholar]
- 16.Gordon SR, et al. PD-1 expression by tumour-associated macrophages inhibits phagocytosis and tumour immunity. Nature 545, 495–499 (2017). [DOI] [PMC free article] [PubMed] [Google Scholar]
- 17.Yan R & Vassar R Targeting the beta secretase BACE1 for Alzheimer's disease therapy. Lancet Neurol. 13, 319–329 (2014). [DOI] [PMC free article] [PubMed] [Google Scholar]
- 18.Panza F, et al. BACE inhibitors in clinical development for the treatment of Alzheimer’s disease. Expert Rev. Neurother 18, 847–857 (2018). [DOI] [PubMed] [Google Scholar]
- 19.Thaisrivongs DA, et al. Synthesis of Verubecestat, a BACE1 Inhibitor for the Treatment of Alzheimer's Disease. Org. Lett 18, 5780–5783 (2016). [DOI] [PubMed] [Google Scholar]
- 20.Kennedy ME, et al. The BACE1 inhibitor verubecestat (MK-8931) reduces CNS beta-amyloid in animal models and in Alzheimer's disease patients. Sci. Transl. Med 8, 363ra150 (2016). [DOI] [PubMed] [Google Scholar]
- 21.Chris Min K, et al. Pharmacokinetics and Pharmacodynamics of the BACE1 Inhibitor Verubecestat (MK-8931) in Healthy Japanese Adults: A Randomized, Placebo-Controlled Study. Clin. Pharmacol. Ther 105, 1234–1243 (2019). [DOI] [PubMed] [Google Scholar]
- 22.Egan MF, et al. Randomized Trial of Verubecestat for Mild-to-Moderate Alzheimer's Disease. N. Engl. J. Med 378, 1691–1703 (2018). [DOI] [PMC free article] [PubMed] [Google Scholar]
- 23.Egan MF, et al. Randomized Trial of Verubecestat for Prodromal Alzheimer's Disease. N. Engl. J. Med 380, 1408–1420 (2019). [DOI] [PMC free article] [PubMed] [Google Scholar]
- 24.Chen J, et al. SLAMF7 is critical for phagocytosis of haematopoietic tumour cells via Mac-1 integrin. Nature 544, 493–497 (2017). [DOI] [PMC free article] [PubMed] [Google Scholar]
- 25.Yanagimachi MD, et al. Robust and highly-efficient differentiation of functional monocytic cells from human pluripotent stem cells under serum- and feeder cell-free conditions. Plos One 8, e59243 (2013). [DOI] [PMC free article] [PubMed] [Google Scholar]
- 26.Pyonteck SM, et al. CSF-1R inhibition alters macrophage polarization and blocks glioma progression. Nat. Med 19, 1264–1272 (2013). [DOI] [PMC free article] [PubMed] [Google Scholar]
- 27.Chen Z, et al. Cellular and Molecular Identity of Tumor-Associated Macrophages in Glioblastoma. Cancer Res. 77, 2266–2278 (2017). [DOI] [PMC free article] [PubMed] [Google Scholar]
- 28.Muller S, et al. Single-cell profiling of human gliomas reveals macrophage ontogeny as a basis for regional differences in macrophage activation in the tumor microenvironment. Genome Biol. 18, 234 (2017). [DOI] [PMC free article] [PubMed] [Google Scholar]
- 29.van Rooijen N & Hendrikx E Liposomes for specific depletion of macrophages from organs and tissues. Methods Mol. Biol 605, 189–203 (2010). [DOI] [PubMed] [Google Scholar]
- 30.Vatner RE & Formenti SC Myeloid-Derived Cells in Tumors: Effects of Radiation. Semin. Radiat. Oncol 25, 18–27 (2015). [DOI] [PubMed] [Google Scholar]
- 31.Sica A & Mantovani A Macrophage plasticity and polarization: in vivo veritas. J. Clin. Invest 122, 787–795 (2012). [DOI] [PMC free article] [PubMed] [Google Scholar]
- 32.Johnson DE, O'Keefe RA & Grandis JR Targeting the IL-6/JAK/STAT3 signalling axis in cancer. Nat. Rev. Clin. Oncol 15, 234–248 (2018). [DOI] [PMC free article] [PubMed] [Google Scholar]
- 33.Tsukamoto H, et al. Soluble IL6R Expressed by Myeloid Cells Reduces Tumor-Specific Th1 Differentiation and Drives Tumor Progression. Cancer Res. 77, 2279–2291 (2017). [DOI] [PubMed] [Google Scholar]
- 34.Peters M, et al. The function of the soluble interleukin 6 (IL-6) receptor in vivo: sensitization of human soluble IL-6 receptor transgenic mice towards IL-6 and prolongation of the plasma half-life of IL-6. J. Exp. Med 183, 1399–1406 (1996). [DOI] [PMC free article] [PubMed] [Google Scholar]
- 35.Zegeye MM, et al. Activation of the JAK/STAT3 and PI3K/AKT pathways are crucial for IL-6 trans-signaling-mediated pro-inflammatory response in human vascular endothelial cells. Cell Commun. Signal 16, 55 (2018). [DOI] [PMC free article] [PubMed] [Google Scholar]
- 36.Hambardzumyan D, Gutmann DH & Kettenmann H The role of microglia and macrophages in glioma maintenance and progression. Nat. Neurosci 19, 20–27 (2016). [DOI] [PMC free article] [PubMed] [Google Scholar]
- 37.Razavi SM, et al. Immune Evasion Strategies of Glioblastoma. Front. Surg 3, 11 (2016). [DOI] [PMC free article] [PubMed] [Google Scholar]
- 38.Butowski N, et al. Orally administered colony stimulating factor 1 receptor inhibitor PLX3397 in recurrent glioblastoma: an Ivy Foundation Early Phase Clinical Trials Consortium phase II study. Neuro. Oncol 18, 557–564 (2016). [DOI] [PMC free article] [PubMed] [Google Scholar]
- 39.Papadopoulos KP, et al. First-in-Human Study of AMG 820, a Monoclonal Anti-Colony-Stimulating Factor 1 Receptor Antibody, in Patients with Advanced Solid Tumors. Clin. Cancer Res 23, 5703–5710 (2017). [DOI] [PubMed] [Google Scholar]
- 40.Feng M, et al. Phagocytosis checkpoints as new targets for cancer immunotherapy. Nat. Rev. Cancer 19, 568–586 (2019). [DOI] [PMC free article] [PubMed] [Google Scholar]
- 41.Hutter G, et al. Microglia are effector cells of CD47-SIRPalpha antiphagocytic axis disruption against glioblastoma. Proc. Natl. Acad. Sci. U S A 116, 997–1006 (2019). [DOI] [PMC free article] [PubMed] [Google Scholar]
- 42.Gholamin S, et al. Disrupting the CD47-SIRPalpha anti-phagocytic axis by a humanized anti-CD47 antibody is an efficacious treatment for malignant pediatric brain tumors. Sci. Transl. Med 9, eaaf2968 (2017). [DOI] [PubMed] [Google Scholar]
- 43.Klichinsky M, et al. Human chimeric antigen receptor macrophages for cancer immunotherapy. Nat. Biotechnol 38, 947–953 (2020). [DOI] [PMC free article] [PubMed] [Google Scholar]
- 44.Farah MH, et al. Reduced BACE1 Activity Enhances Clearance of Myelin Debris and Regeneration of Axons in the Injured Peripheral Nervous System. J. Neurosci 31, 5744–5754 (2011). [DOI] [PMC free article] [PubMed] [Google Scholar]
- 45.Liu LJ, et al. Increased TNFR1 expression and signaling in injured peripheral nerves of mice with reduced BACE1 activity. Neurobiol. Dis 93, 21–27 (2016). [DOI] [PubMed] [Google Scholar]
- 46.Poon CC, Sarkar S, Yong VW & Kelly JJP Glioblastoma-associated microglia and macrophages: targets for therapies to improve prognosis. Brain 140, 1548–1560 (2017). [DOI] [PubMed] [Google Scholar]
- 47.Darmanis S, et al. Single-Cell RNA-Seq Analysis of Infiltrating Neoplastic Cells at the Migrating Front of Human Glioblastoma. Cell Rep. 21, 1399–1410 (2017). [DOI] [PMC free article] [PubMed] [Google Scholar]
- 48.Omuro A & DeAngelis LM Glioblastoma and other malignant gliomas: a clinical review. JAMA 310, 1842–1850 (2013). [DOI] [PubMed] [Google Scholar]
- 49.Prager BC, Bhargava S, Mahadev V, Hubert CG & Rich JN Glioblastoma Stem Cells: Driving Resilience through Chaos. Trends Cancer 6, 223–235 (2020). [DOI] [PMC free article] [PubMed] [Google Scholar]
- 50.Ruffell B & Coussens LM Macrophages and therapeutic resistance in cancer. Cancer Cell 27, 462–472 (2015). [DOI] [PMC free article] [PubMed] [Google Scholar]
- 51.Genard G, Lucas S & Michiels C Reprogramming of Tumor-Associated Macrophages with Anticancer Therapies: Radiotherapy versus Chemo- and immunotherapies. Front. Immunol 8, 828 (2017). [DOI] [PMC free article] [PubMed] [Google Scholar]
- 52.Lee M, Park JJ, Ko YG & Lee YS Cleavage of ST6Gal I by radiation-induced BACE1 inhibits golgi-anchored ST6Gal I-mediated sialylation of integrin beta1 and migration in colon cancer cells. Radiat. Oncol 7, 47 (2012). [DOI] [PMC free article] [PubMed] [Google Scholar]
- 53.Mann J, Ramakrishna R, Magge R & Wernicke AG Advances in Radiotherapy for Glioblastoma. Front. Neurol 8, 748 (2017). [DOI] [PMC free article] [PubMed] [Google Scholar]
- 54.Yu H, Pardoll D & Jove R STATs in cancer inflammation and immunity: a leading role for STAT3. Nat. Rev. Cancer 9, 798–809 (2009). [DOI] [PMC free article] [PubMed] [Google Scholar]
- 55.Shi Y, et al. Ibrutinib inactivates BMX-STAT3 in glioma stem cells to impair malignant growth and radioresistance. Sci. Transl. Med 10, eaah6816 (2018). [DOI] [PMC free article] [PubMed] [Google Scholar]
- 56.Guryanova OA, et al. Nonreceptor tyrosine kinase BMX maintains self-renewal and tumorigenic potential of glioblastoma stem cells by activating STAT3. Cancer Cell 19, 498–511 (2011). [DOI] [PMC free article] [PubMed] [Google Scholar]
- 57.Cheng L, et al. Elevated invasive potential of glioblastoma stem cells. Biochem. Biophys. Res. Commun 406, 643–648 (2011). [DOI] [PMC free article] [PubMed] [Google Scholar]
- 58.Cheng L, et al. Glioblastoma Stem Cells Generate Vascular Pericytes to Support Vessel Function and Tumor Growth. Cell 153, 139–152 (2013). [DOI] [PMC free article] [PubMed] [Google Scholar]
- 59.Zhou W, et al. Targeting Glioma Stem Cell-Derived Pericytes Disrupts the Blood-Tumor Barrier and Improves Chemotherapeutic Efficacy. Cell Stem Cell 21, 591–603 (2017). [DOI] [PMC free article] [PubMed] [Google Scholar]
- 60.Sharma P, Hu-Lieskovan S, Wargo JA & Ribas A Primary, Adaptive, and Acquired Resistance to Cancer Immunotherapy. Cell 168, 707–723 (2017). [DOI] [PMC free article] [PubMed] [Google Scholar]
Methods-only References
- 61.Fang X, et al. Inhibiting DNA-PK induces glioma stem cell differentiation and sensitizes glioblastoma to radiation in mice. Sci. Transl. Med 13, eabc7275 (2021). [DOI] [PubMed] [Google Scholar]
- 62.Ying W, Cheruku PS, Bazer FW, Safe SH & Zhou B Investigation of macrophage polarization using bone marrow derived macrophages. J. Vis. Exp 23, e50323 (2013). [DOI] [PMC free article] [PubMed] [Google Scholar]
- 63.Guerriero JL, et al. Class IIa HDAC inhibition reduces breast tumours and metastases through anti-tumour macrophages. Nature 543, 428–432 (2017). [DOI] [PMC free article] [PubMed] [Google Scholar]
Associated Data
This section collects any data citations, data availability statements, or supplementary materials included in this article.
Supplementary Materials
Data Availability Statement
Numerical and immunoblot source data for Figs. 1-8 and Extended Data Figs. 1-10 are provided with this paper. Any additional data that support the findings of this study are available from the corresponding author upon reasonable request. Further information on research design is available in the Nature Research Reporting Summary linked to this article. All RNA-seq data were deposited in the Gene Expression Omnibus under the accession codes GSE181649 and GSE181650. The TCGA dataset was downloaded from GlioVis (http://gliovis.bioinfo.cnio.es/). GSC lines are provided upon request to S.B. through a materials transfer agreement.


