Abstract
Pancreatic cancer expression profiles largely reflect a classical or basal-like phenotype. The extent to which these profiles vary within a patient is unknown. We integrated evolutionary analysis and expression profiling in multiregion-sampled metastatic pancreatic cancers, finding that squamous features are the histologic correlate of an RNA-seq-defined basal-like subtype. In patients with coexisting basal and squamous and classical and glandular morphology, phylogenetic studies revealed that squamous morphology represented a subclonal population in an otherwise classical and glandular tumor. Cancers with squamous features were significantly more likely to have clonal mutations in chromatin modifiers, intercellular heterogeneity for MYC amplification and entosis. These data provide a unifying paradigm for integrating basal-type expression profiles, squamous histology and somatic mutations in chromatin modifier genes in the context of clonal evolution of pancreatic cancer.
Despite the wealth of data pertaining to the biology and genetics of pancreatic ductal adenocarcinoma (PDAC), this solid tumor remains one of the most lethal tumor types1–3. Large-scale sequencing studies have revealed the recurrent genomic features of this disease that target a defined number of core pathways4–8. In some patients a genome instability signature is also seen based on either microsatellite instability or on a high number of structural rearrangements5,9. Transcriptional studies have revealed that PDAC can be segregated into two or more major subtypes6,7,10,11. At this time the ‘classical’ and ‘basal-like’ subtypes have the greatest supporting evidence7.
Recently a phylotranscriptomic model was put forth to clarify the significance of interpatient transcriptional heterogeneity in PDAC12. In that model, the authors proposed that classical and basal-like subtypes arise from a common precursor but represent different molecular subtypes with different therapeutic vulnerabilities. While this model is compatible with available large-scale datasets, those datasets are almost entirely represented by a single sample per patient. Thus, the extent to which intratumoral transcriptional heterogeneity exists in PDAC remains unknown, and this is critical to know for development of a molecular taxonomy to guide therapy.
We previously leveraged multiregional sampling to define the genetic evolution of pancreatic cancer metastasis. We found within each patient that the primary tumor and metastases shared identical driver-gene mutations, suggesting that at least one major clonal sweep had occurred. The cells that descended from this sweep were endowed with all of the genetic drivers needed to metastasize6,7,11. We have also observed that metastases from the same patients may have divergent morphologic and molecular features, despite identical genomes13. In light of these observations and the importance of developing a molecular taxonomy for pancreatic cancer we posited that an integrated analysis of the histologic, genomic and transcriptional features of PDAC would provide insight into this biological question, both within the primary and metastatic sites.
Results
Review of patient cohort.
In this study, we aimed to perform integrated analyses of the histology, expression profiles and genetic alterations within each single patient (Fig. 1a). First, we reviewed hematoxylin and eosin (H&E)-stained sections from 156 research autopsy participants spanning two institutions, all of whom had been clinically or pathologically diagnosed with PDAC before death. More than 7,000 unique formalin-fixed paraffin-embedded (FFPE) tissues were reviewed from the 156 patients. After histologic review, 33 cases were excluded (the rationale and criteria for exclusion are shown in Extended Data Fig. 1a) leaving 2,928 individual sections from 123 cases (median of 17 tumor sections per case) that fulfilled our criteria for further study (Supplementary Table 1).
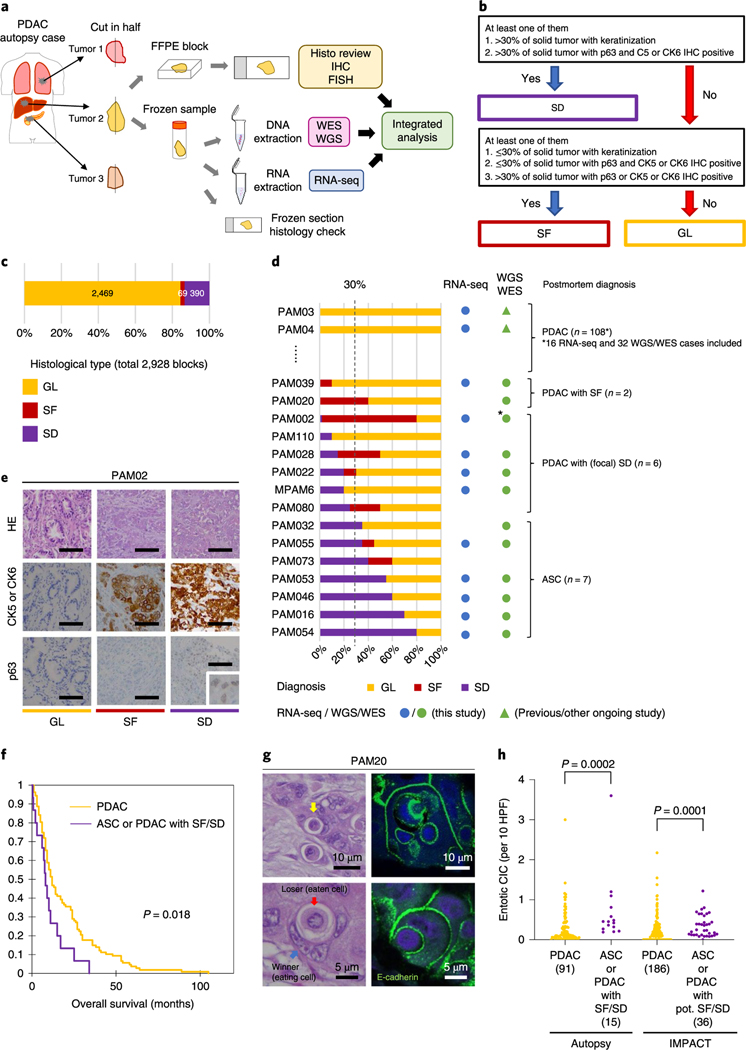
Fig. 1 |. Study overview and morphologic heterogeneity for squamous features in PDAC.
a, Study overview of integrated analysis in PDAC using multiregional sampling, b, Schematic for classification of sections. SD or SF was determined for each block in all cases based on the combination of histomorphological features and p63 and CK5/6 IHC. c, Summary of block diagnoses, d, Postmortem case diagnoses based on combination of the number of blocks with SF or SD of all blocks analyzed per patient and the percent of SF or SD within each positive block. PAM02 was reanalyzed for this study using previous data. e, Representative histomorphological and immunohistochemical images (167 IHC images taken from a total of 31 cases) of GL, SF and SD. (Images shown are in patient PAM02). SD areas showed a solid growth pattern with both CK5/6 and p63 positivity, whereas SF areas showed CK5/6-positive labeling but were negative for p63. f, Kaplan-Meier analysis of normal PDAC or PDAC with SF/SD or ASC. PDAC with SF/SD or ASC (n=15) showed poorer prognosis than PDACs without SF/SD (n = 106; P=0.018, log-rank test), g, Representative histomorphological and immunofluorescence (IF) images of entotic CICs in patient PAM20 (IF performed on 18 slides from ten cases). A clearly defined ‘moonshape’ host nucleus, intervening vacuolar space and internalized cell is identified. IF images clear e-cadherin membranous labeling of the winners (eating cells) and losers (eaten cells), h, Average number of entotic CICs in ASCs or PDACs with potential (pot.) SF/SD versus conventional GL patterns in autopsy (P=0.0002, two-sided Mann-Whitney U-test) and MSK Clinical IMPACT cohorts (P= 0.0001, two-sided Mann-Whitney U-test) respectively. Each sample number is shown in the figure.
Morphologic heterogeneity for squamoid features in PDAC.
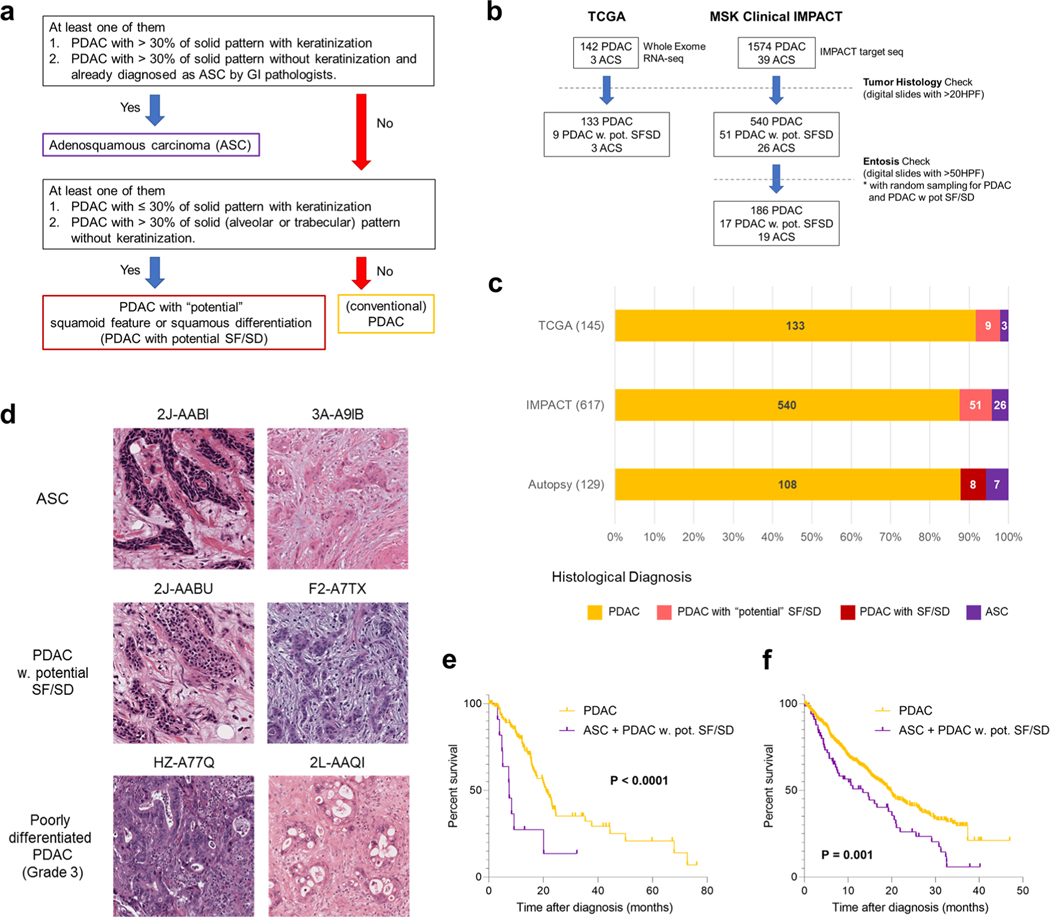
Histologic review in combination with immunohistochemical labeling of representative blocks for the common squamous differentiation markers CK5, CK6 and p63 (refs.14,15) was performed so that each individual formalin-fixed section was categorized as having a conventional glandular (GL) pattern of growth, squamoid features (SF) or squamous differentiation (SD; Fig. 1b and Extended Data Fig. 1b). Of 2,928 blocks, 459 (15.7%) showed SF or SD within the histologic section (Fig. 1c). As described in previous studies15, SF or SD occurred as circumscribed regions within a PDAC or as an admixture of GL and squamous morphologies. We therefore estimated the proportion of squamous differentiation in each carcinoma on the basis of the number of blocks with SF or SD and the area of SF or SD within each block. On the basis of World Health Organization criteria16 seven carcinomas (5.7%) were classified as adenosquamous carcinoma (ASC), six PDACs (4.9%) had focal (<30%) SD and two PDACs (1.6%) had SF (Fig. 1d and Extended Data Fig. lc). Six PDACs (PAM02, PAM22, PAM28, PAM55, PAM73 and PAM80) had all three morphologies present (Fig. 1d,e). When present, the proportion of SF orSD in a carcinoma ranged from 2–80% (Fig. 1d). By univariate analysis, patients with ASCs or PDACs with SF or SD had a poorer survival than patients with PDACs without SF or SD (Fig. 1f). A similar finding was noted in two independent cohorts of patients with PDAC within the MSK Clinical IMPACT cohort17,18 and The Cancer Genome Atlas (TCGA) cohort7 (see Methods, Extended Data Fig. 2 and Supplementary Table 2). For these cohorts, in addition to the ASC cases, we identified PDAC cases with potential SF or SD on the basis of histologic features. We use the term ‘potential’ because immunohistochemistry (IHC) for the squamous markers used in this study (p63 and CK5/6) was not available (Extended Data Fig. 2a,d).
During histologic review of all 2,928 sections we also noted that ASCs and PDACs with SF or SD exhibited entosis, a distinct form of cell death in which one cancer cell engulfs another (Fig. 1g)19. To more rigorously determine the relationship of SF or SD to entosis we adopted strict criteria to count entotic cell-in-cell structures (CICs; see Methods)20. The number of entotic CICs was higher in PDACs with SF or SD or ASCs compared to PDACs without SF or SD in our cohort (interquartile range was 0.29–0.69 (median 0.45) versus 0.05–0.33 (median 0.12) per ten representative high power fields (HPFs) respectively, P = 0.0002, Mann-Whitney U-test, twosided) (Fig. 1h). We also reviewed the number of entotic CICs specifically in ten cases where both morphologies existed in the same carcinoma and at least three slides were available for each morphology, revealing that in five PDACs the SF and/or SD blocks had a significantly higher number of CICs compared to GL blocks (Extended Data Fig. 3a). To determine whether entosis is more reflective of stage of disease versus morphology, we reviewed histologic images from the MSK Clinical IMPACT cohort that included a large number of otherwise unselected patients with available PDAC material used for clinical grade targeted sequencing of more than 400 cancer genes18 (see Methods and Extended Data Fig. 2b). Similarly to the findings in the autopsy cohort, ASCs or PDACs with potential SF or SD had more entotic CICs than conventional PDACs (interquartile range was 0.12–0.48 (median 0.24) versus 0–0.28 (median 0.12), respectively, P= 0.0001, two-sided Mann-Whitney [U-test; Fig. 1h). However, there was no difference in the number of entotic CICs in autopsy ASCs or PDACs with SF or SD compared to ASCs or PDACs with potential SF or SD in the MSK IMPACT cohort, suggesting entosis is a feature of SF or SD and but not tumor progression per se.
Transcriptional heterogeneity for SF in PDAC.
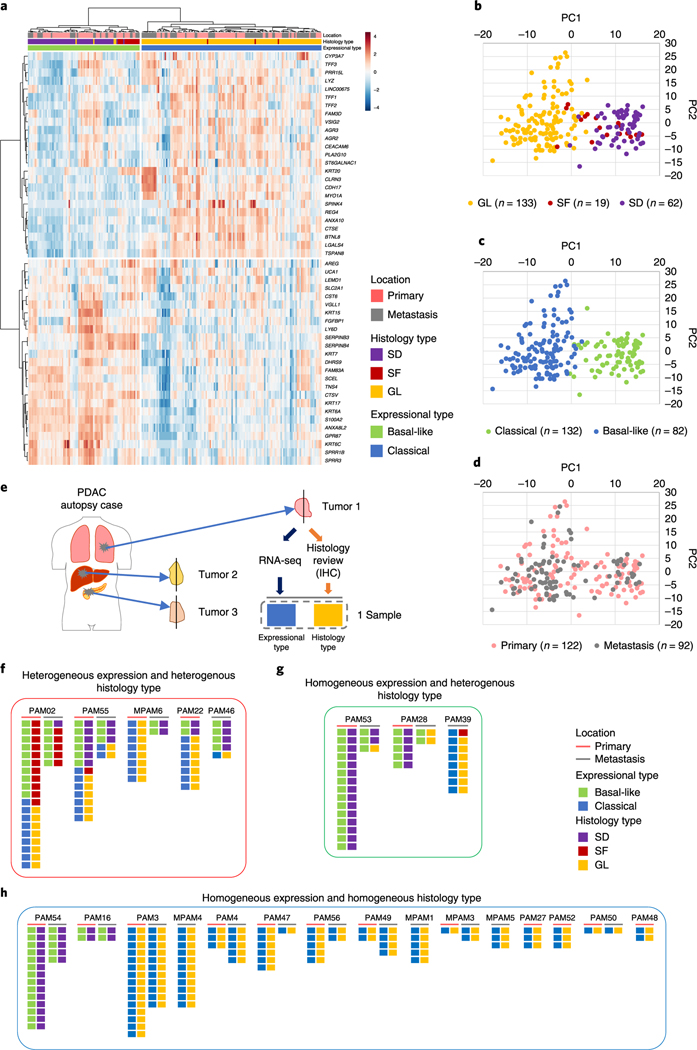
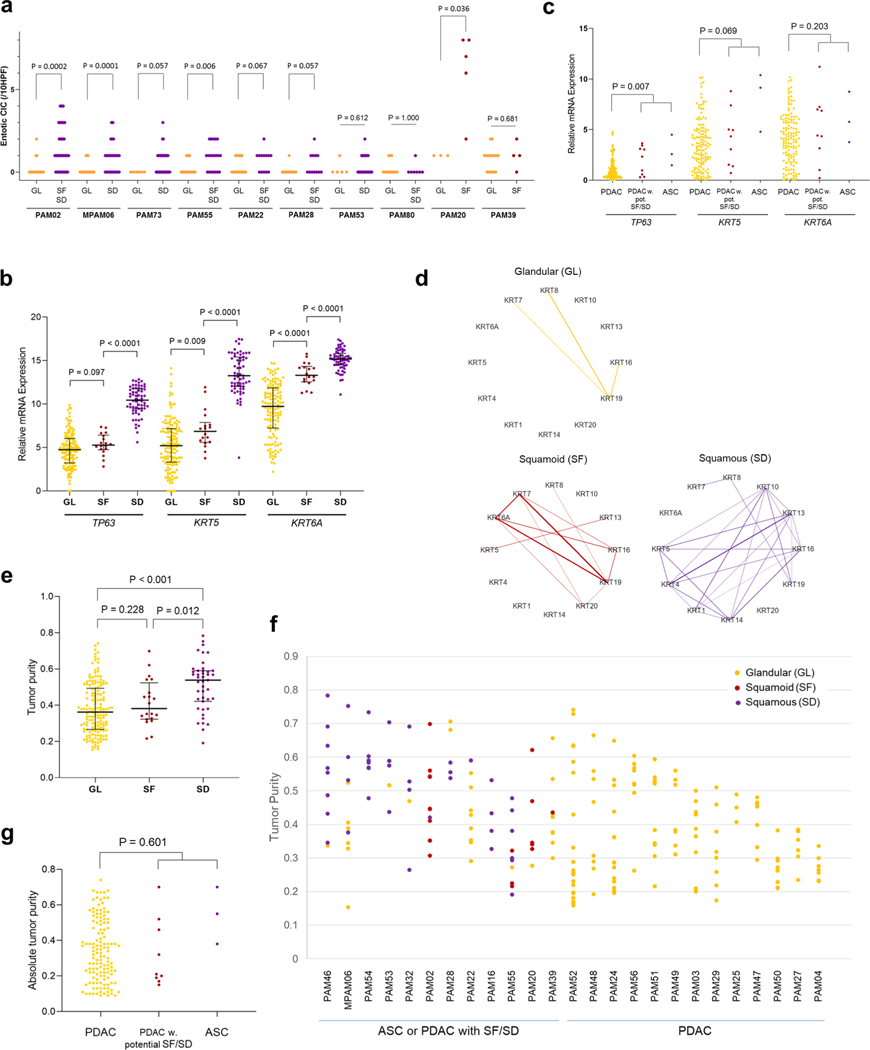
We next sought to determine the extent that the observed morphologic findings corresponded to the classical and basal-like type transcriptional signatures described7,11. We extracted total RNA from 480 frozen samples in triplicate; in all cases the frozen tissue was matched to the formalin-fixed sections used for morphologic and IHC analyses. A total of 214 frozen samples from 27 patients in our cohort (median of 6 samples, range 1–26 samples per patient) meeting quality criteria (see Methods) were used for RNA sequencing (Supplementary Table 3 and Supplementary Dataset 1). These 27 cases included 5 ASCs and 5 PDACs with focal SF or SD; for these 10 cases the GL and SF or SD regions were independently extracted and analyzed. Normalized mRNA expression levels of TP63, KRT5 and KRT6A confirmed that GL samples had the lowest expression of all three markers, whereas SD samples had the highest expression levels of all three markers. Samples designated as having SF had an intermediate expression pattern between GL and SD samples (Extended Data Fig. 3b). Similar findings were confirmed in TCGA cohort (Extended Data Fig. 3c). Consistent with this finding, network analysis highlights KRT5 and KRT6A as hub genes in samples with SF or SD morphology and SF or SD morphology shows more complex co-expression patterns in keratin filament and keratinization pathways than in samples with GL morphology (Extended Data Fig. 3d). Samples with SD had higher tumor purity than GL type samples in our cohort, and this pattern was seen when analyzing all patients and within a single patient specifically (Extended Data Fig. 3e–g). For this reason we next classified our 214 samples into classical and basal-like PDAC subtypes using the 50 pancreas cancer gene set reported by Moffitt et al.11 because a recent TCGA re-analysis showed that this classification was least affected by tumor purity or stromal contamination7. This revealed an almost perfect concordance of morphologic features with transcriptional subtype, as most SF PDAC (15 of 18) and all SD PDAC (63 of 63) samples corresponded to the basal-like expression pattern, whereas most GL PDACs corresponded to the classical-type pattern (129 of 133; P<0.0001, two-sided Fisher’s exact test; Fig. 2a). Principal-component analysis (PCA) using this same gene set revealed a similar distribution on the basis of morphologic features (Fig. 2b) or RNA expression subtype (Fig. 2c), whereas no obvious relationship was found for the site of collecting each sample (primary or metastasis; Fig. 2d). This confirms that the basal-like type expression signature as defined by the 50-gene signature reflects SF or differentiation in PDAC.
Fig. 2 |. Transcriptional heterogeneity for SF in end-stage PDAC.
RNA-seq was performed on snap-frozen tissues of 214 unique samples from 27 patients, including 5 ASCs and 5 PDACs with (focal) SF or SD. RNA-seq data were used to classify each of the 214 samples into basal-like and classical tumors (Moffitt et al.)11. a-d, Heatmap (a), and PCA plots based on histology type (b), expressional type (e) and location (d) indicate a strong correlation of SF or SD morphology with a basal-like transcriptional signature, and GL morphology with a classical transcriptional signature, e, Analysis overview. Each pair of boxes corresponds to one sample. The left box shows the expression type of the sample and right box the histological type.f-h, Integrated analysis of transcriptional subtype with unique block diagnosis from multiregional sampling. Five out of 23 cases showed intratumoral heterogeneity for both transcriptional signatures and histomorphological features (f) and 3 cases showed intratumoral heterogeneity for transcriptional signatures (g) in a subset of PDACs. (h) Remaining 15 cases showed intratumoral homogenity for both transcriptional signatures and histomorphological features.
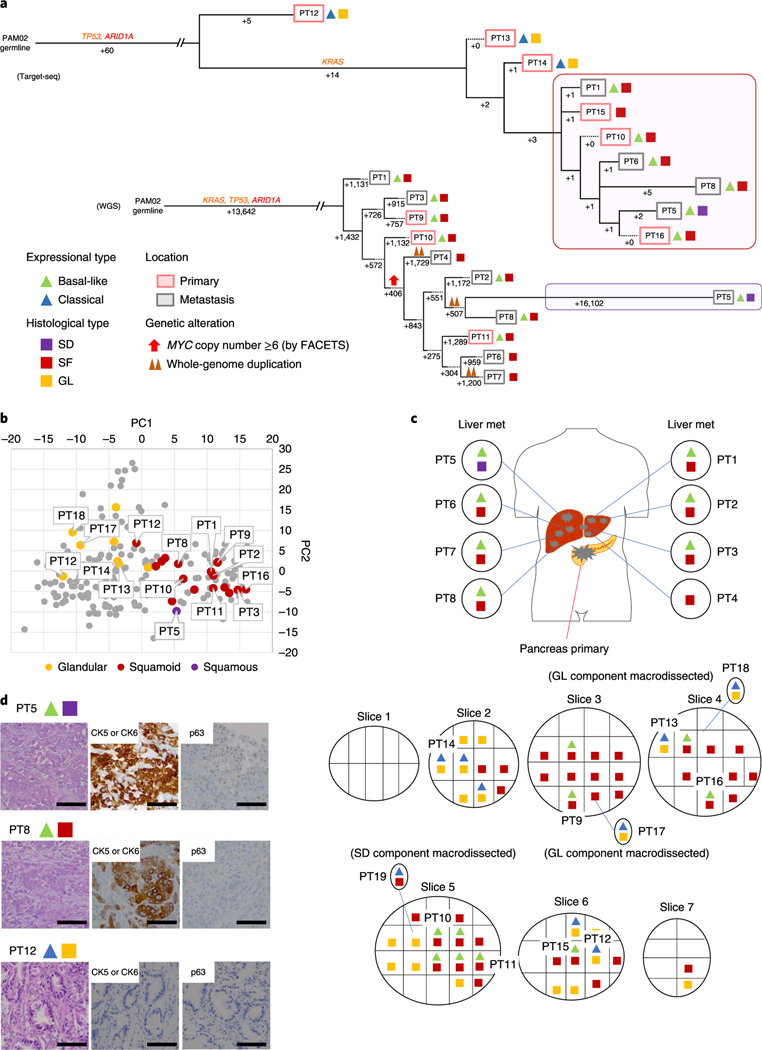
For 23 of these 27 patients, two or more samples were analyzed by RNA-seq and we used these cases for further integrated analyses related to intratumoral heterogeneity for transcriptional subtypes (Fig. 2e). Intratumoral heterogeneity for expression profiles was identified in five patients (PAM02, PAM22, PAM46, PAM55 and MPAM6) indicating that the classical and basal-like subtypes can co-exist within a single patient (Fig. 2f). With two exceptions (one primary tumor sample each in PAM02 and PAM55), the transcriptional signatures correlated with the histologic features of the sample. In a separate set of three patients (PAM28, PAM39 and PAM53) all samples analyzed were homogenous for their transcriptional subtype despite a degree of morphologic heterogeneity (Fig. 2g). These included a basal-like transcriptional signature but GL morphology in the metastases of PAM28 and PAM53, and a classical expression signature in a metastasis with SD features in PAM39. Finally, in 15 patients all samples studied were homogeneous with respect to both their transcriptional subtype and morphologic pattern (Fig. 2h). The majority of these cases had a GL histology and a classical-type expression signature, although in two patients (PAM 16 and PAM54) prominent SD was identified in all analyzed samples showing a basal-like expression signature.
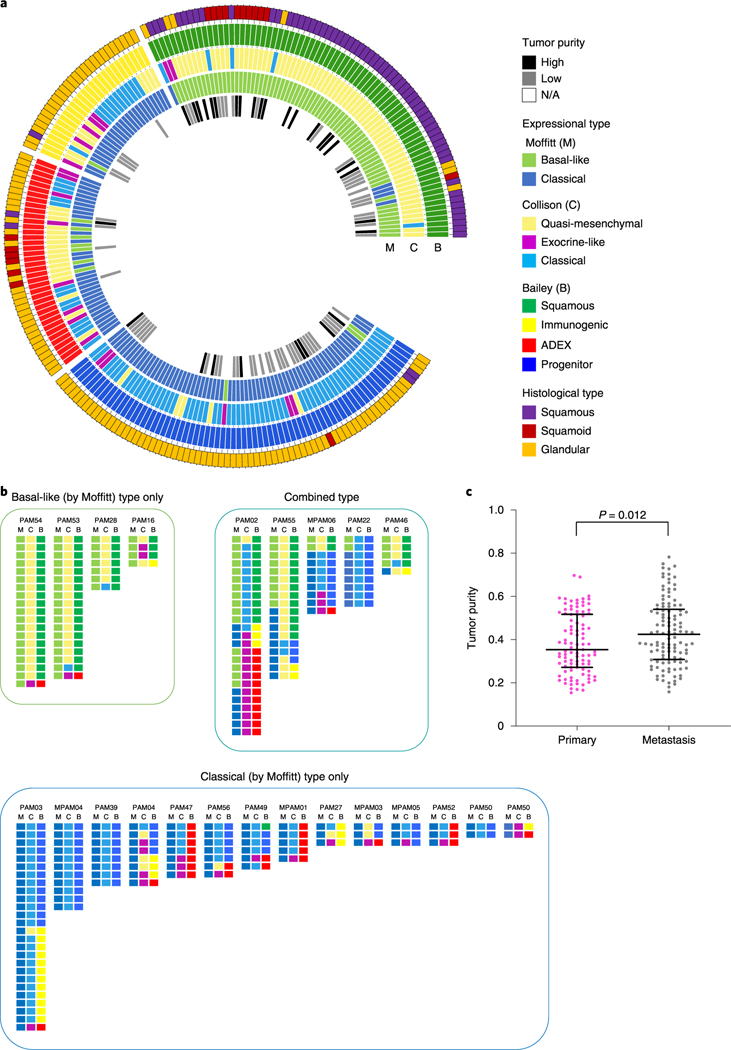
We also determined the correlation of our histologic findings in the autopsy cohort to those subtypes generated using the Bailey6 and Collisson10 gene sets (Fig. 3a). With few exceptions, ASC and PDACs with SF or SD largely corresponded to the Bailey ‘squamous’ subtype6 and the Collisson ‘quasi-mesenchymal’ subtype10. In contrast, PDACs with GL morphology (conventional PDACs) were categorized into a variety of subtypes depending on the classifier used (Fig. 3a)6,7,10,11. In TCGA cohort, 10 of 12 ASCs or PDACs with potential SF or SD corresponded to the Moffitt basal-like expression profile, 10 had the Collisson quasi-mesenchymal expression profile, and 8 had the Bailey squamous expression profile (Supplementary Table 2). These results suggest that PDACs with (potential) SF or SD are represented in TCGA cohort.
Fig. 3 |. Expressional profiles based on three major classification schemes in end-stage PDAC.
a, Circos plot of histological types, tumor purity and expressional subtypes based on the Moffitt, Collisson and Bailey gene sets, b, Expression subtypes within each individual patient reveals intratumoral heterogeneity, c, Tumor purity in primary and metastatic PDACs. Tumor purity obtained using the FACETS tool in end-stage PDAC shows that metastatic samples (n=116) have higher tumor purity than primary samples (n = 99; P = 0.012, two-sided Mann-Whitney U-test). Lines and bars represent median with interquartile range.
When organized by patient, PDAC samples categorized as abnormally differentiated exocrine endocrine (ADEX)6, immunogenic6 or exocrine-Like10 also clustered within the same carcinoma (PAM02 or PAM03; Fig. 3b) suggesting an inherent property of these samples that influences their transcriptional profile and hence, classification. We re-reviewed the histologic sections of these representative cases, which indicated that the majority were derived from the primary tumor in each patient. Thus, this finding likely reflects that these samples have a relatively lower tumor cellularity than others in the same patient21, and low cellularity is associated with lower confidence in calling transcriptional subtypes7. Consistently with this notion, we found that the tumor cellularity was indeed lower in primary tumors than in metastases in our autopsy cohort (Fig. 3c).
Genomic landscape of PDACs with and without SF.
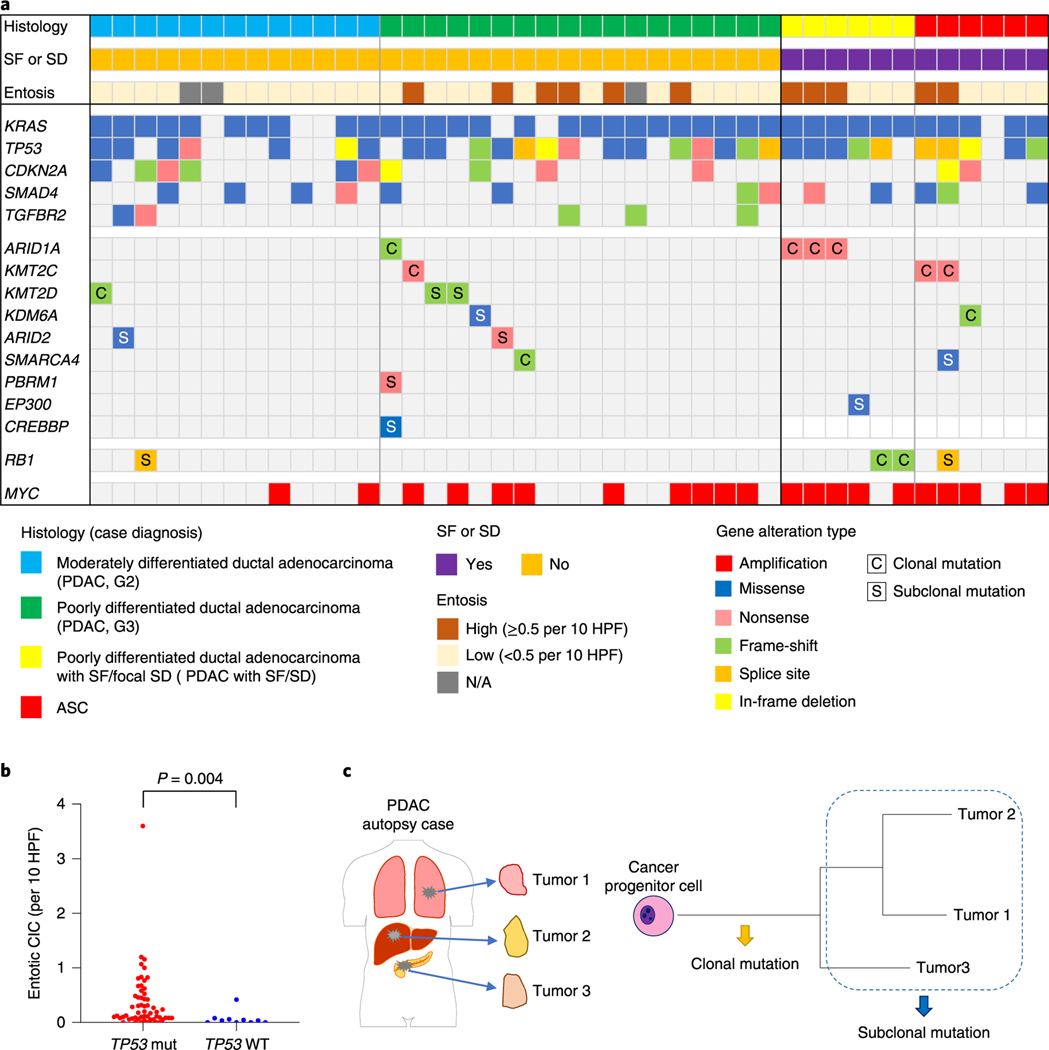
We next determined the relationship of the coding genomic landscape with the presence of SF or SD and entosis by performing multiregion whole-exome sequencing (WES) or whole-genome sequencing (WGS) on frozen samples matched to histologically and IHC-characterized formalin-fixed sections in 43 patients (Fig. 1a). Overall the genetic features of this cohort were consistent with the PDAC genomic landscape (Fig. 4a and Supplementary Table 4)4–8 and TP53 mutations were correlated with a significantly higher number of entotic CICs compared to TP53 wild-type tumors as described20 (Fig. 4b). No mutations of UPF1 were identified that have previously been reported in ASC22. However, two carcinomas had a KDM6A mutation6,23, both in females and one with an ASC, leading us to more closely evaluate all chromatin modifier genes that were mutated in these 43 patients. The most common chromatin modifier gene with a deleterious mutation was ARID1A (four carcinomas, 9%), followed by KMT2C and KMT2D (three carcinomas, 7%), ARID2, KDM6A and SMARCA4 (two carcinomas each, 5%). Two patients had somatic alterations in more than one of these genes. Overall, 7 of 12 patients (58%) with a PDAC with SF, SD or ASC had a mutation in a chromatin modifier gene compared to 9 of 31 patients (29%) with a PDAC without SF or SD (P=0.092, two-sided Fisher’s exact test). We also noted RBI mutations in three PDAC with SF or SD cases (25%) compared to only one case without SF or SD (3%), although this finding was also not statistically significant (P= 0.059, two-sided Fisher’s exact test).
Fig. 4 |. Genomic landscape of end-stage PDAC with and without SF.
a, Oncoprint illustrating the driver-gene somatic alterations of 43 cases with respect to their histologic and immunolabeling profiles. Any chromatin modifier gene alteration detected as driver genes were shown. Clonal mutations in chromatin modifier genes and MYC amplification are significantly enriched in PDACs with SF or (focal) SD and ASCs (n = 12) compared to conventional PDACs without SF or SD (n = 31; P = 0.017 and P= 0.007, respectively, two-sided Fisher’s exact test), b, Entotic CICs occur more frequently in TP53 mutant PDACs (n = 57) than in TP53 wild-type PDACs (n = 10; P= 0.0004, two-sided Mann-Whitney U-test). c, Categories of mutation (clonal and subclonal) on the basis of a schematic phylogenetic tree of human tumors.
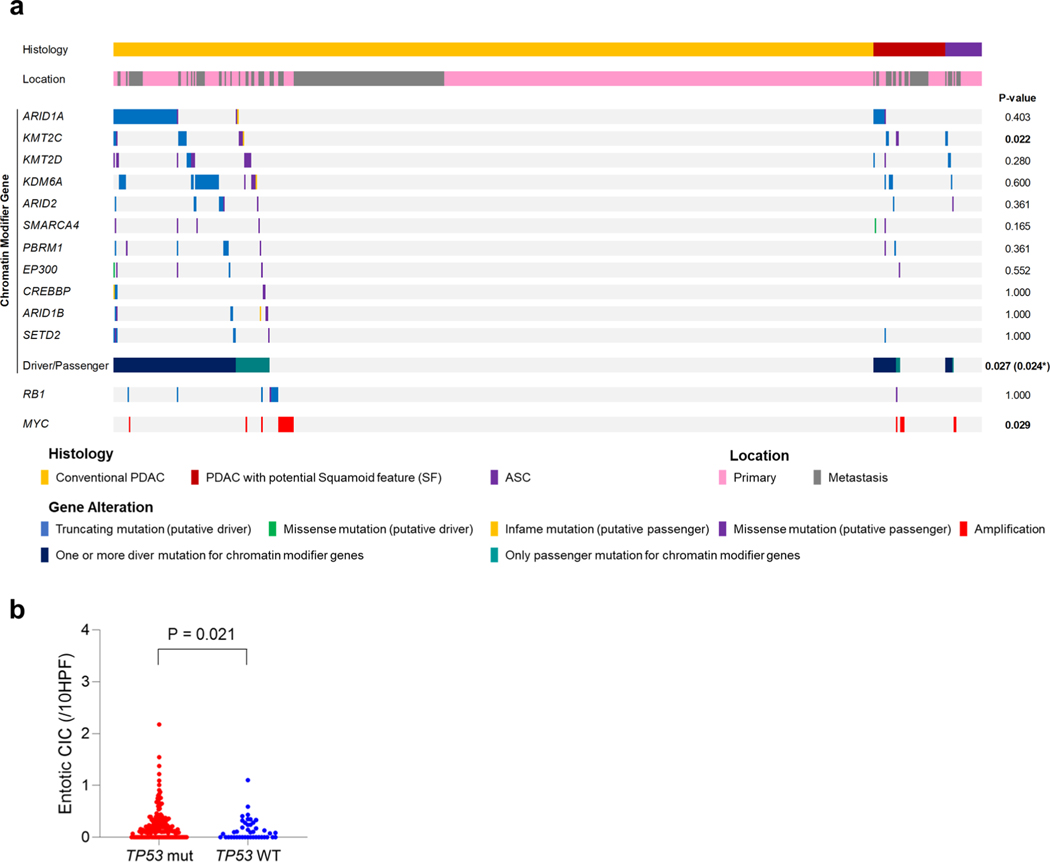
To better understand the role of mutations in chromatin modifier genes or RBI in the development of SF or SD we analyzed genetic data from the MSK Clinical IMPACT cohort as well as that reported in the TCGA cohort of patients with PDAC7,18. The TCGA cohort included fewer patients than the MSK Clinical IMPACT cohort but was based on rigorous case selection by controlling for sample quality metrics and histologic criteria7. These differences are represented in part by the lower number of ASCs or PDACs with potential SF or SD in the TCGA cohort (12 of 145 cases, 8.3%) compared to the MSK Clinical IMPACT cohort (77 of 617 cases, 12.5%; Supplementary Table 4 and Extended Data Fig. 2a,c). KMT2C mutations were significantly enriched in ASC or PDAC with potential SF or SD compared to conventional PDAC in the MSK Clinical IMPACT cohort, whereas SMARCA4 mutations were significantly enriched in ASC or PDAC with potential SF or SD in the TCGA cohort (P=0.022 and P< 0.0001 respectively, two-sided Fisher’s exact test; Extended Data Fig. 4a and Supplementary Table 4). We next evaluated the overall frequency of any mutation in a chromatin modifier gene to ASC or PDAC with potential SF or SD. Functionally deleterious mutations in any chromatin modifier gene were significantly enriched in ASC or PDACs with potential SF or SD in the MSK Clinical IMPACT cohort (21 of 77, 27% versus 87 of 540,16%, P=0.024, two-sided Fisher’s exact test; Extended Data Fig. 4a and Supplementary Table 4), whereas a trend in the same direction was noted for the TCGA cohort (6 of 12, 50% versus 34 of 133, 26%, P= 0.092). RBI mutations were not enriched in ASC or PDACs with potential SF or SD in the MSK Clinical IMPACT or TCGA cohorts, although the numbers of RBI mutations in each study were exceedingly low and likely precluded a meaningful analysis. However, a comparison of the frequency of RBI mutations in the autopsy cohort (4 of 43, 6%) to the MSK Clinical IMPACT (10 of 617, 2%) or TCGA (1 of 145,1%) cohorts revealed a significantly higher frequency in end-stage disease (each comparison, P=0.010, two-sided Fisher’s exact test), suggesting RBI mutations may segregate with those PDACs that predominantly present with unresectable disease. Moreover, as found in the autopsy cohort, entotic CICs were more common in TP53 mutant carcinomas than in TP53 wildtype carcinomas in the MSK Clinical IMPACT cohort (Extended Data Fig. 4b).
High-quality single-nucleotide variants and small insertions or deletions identified for each sample were used to recreate the phylogenetic relationships and subclonal events among the spatially distinct samples within each patient. To understand the approximate timing of accumulation of each mutation in the evolutionary history of each neoplasm, we classified them into two categories: clonal or subclonal (Fig. 4c). While there was a trend but no significant difference in the prevalence of mutations in chromatin modifier genes in cancers with or without SF or SD, the timing by which each mutation occurred (clonal or subclonal) revealed an influential relationship among the evolutionary timing that a mutation in a chromatin modifier gene arises and the extent of squamous morphology in the carcinoma (Fig. 4a). For example, 6 of 12 PDACs with an SF or SD morphology or ASCs had clonal chromatin modifier gene mutations identified (Figs. 4a–6 and Extended Data Figs. 5 and 6), compared to only 4 of the 31 PDACs with GL morphology (P=0.017, two-sided Fisher’s exact test). In the remaining PDACs with GL morphology, mutations in chromatin modifier genes were found in a single sample in that patient indicating it was a subclonal event. Curiously, we noted that two PDACs with SF or SD and wildtype chromatin modifier genes (PAM28 and MPAM6) had deleterious clonal mutations of RBI (Extended Data Fig. 7) buttressing the notion that RBI mutant PDACs present as relatively more aggressive disease. Collectively, we conclude that transcriptional heterogeneity for basal-like features corresponds to morphologic heterogeneity for SF or SD, and these features occur in the setting of clonal mutations in chromatin modifier genes, most often but not exclusively ARID1A, KMT2C, KMT2D or RBI.
Fig. 6 |. Integration of transcriptomic and morphologic features with phylogenetic patterns in PDAC PAM02 with clonal ARID1A mutation.
a, Phylogenetic analysis illustrating the clonal relationship of samples analyzed in patient PAM02. The predicted timing of somatic alterations in driver genes, whole-genome duplication and MYC amplification are shown. Mutations in chromatin modifier genes are in red font and all others are in orange. Red and purple outlines indicate samples that have SF or SD based on RNA-seq (triangles) and/or histology (squares). Phylogenetic analysis on the basis of WGS (bottom) or targeted sequencing (top) of an overlapping set of samples from patient PAM02. Clonal driver genes are notable for an ARID1A somatic alteration. Primary and metastatic samples with SF or SD in this patient were clonally related, b, PCA (214 samples from 27 patients) illustrates the divergent expression profiles between GL samples (n=8) and SF or SD samples (n=17) in patient PAM02. c, Relationship of anatomic location to morphologic and transcriptional heterogeneity. Both GLand SF were seen in the primary tumor, with corresponding classical or basal-like expression profiles, respectively. One liver metastasis (PT5) showed SD. d, Representative histological and IHC images of metastases samples PT5and PT8 and primary tumor samples PT12 (a total of 63 histological images were taken for PAM02). Scale bars, 100 μm. The H&Eand IHC images are the same as in Fig. 1e.
Integration of transcriptomic and morphologic features with phylogenetic patterns in PDAC.
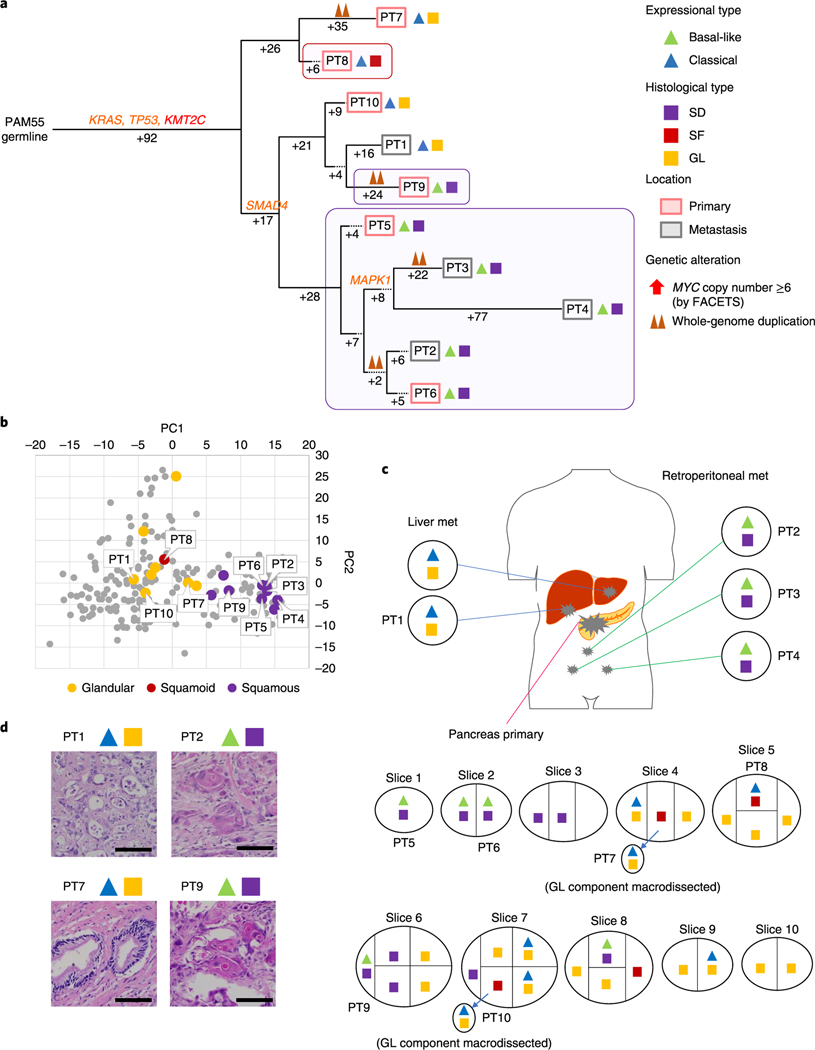
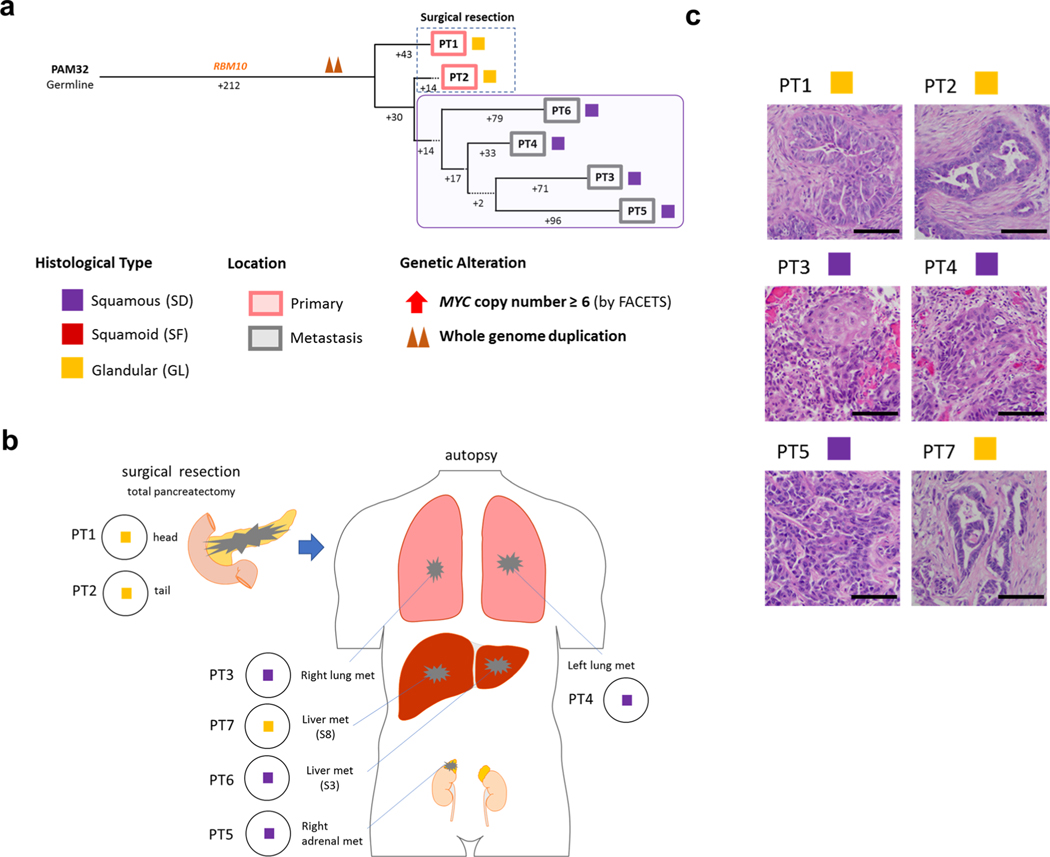
We next determined the relationship of heterogeneous morphologic or transcriptional features with the derived phylogenetic relationships of spatially distinct samples within a single patient. In 10 of 12 patients, the samples with squamous features (SF or SD) were confined to the same clade. For example, all samples with SF or SD in two or more samples were phylogenetically more closely related to each other than to the sample(s) with GL morphology in the same patient (Figs. 5–7 and Extended Data Figs. 6–9). These phylogenetic relationships did not imply a shared anatomic location, as genetically, morphologically and transcriptionally similar samples could be found in both the primary tumor and in metastatic sites. In the remaining two patients (PAM22 and PAM39) the SF or SD was exclusive to a single sample analyzed (Extended Data Figs. 6a–d and 8a–d) indicating a small subclonal population occupying a single region of the tumor in these two patients. The integration of phylogenetic trees, morphologic features and spatial location also suggested that SF or SD can develop independently in the same neoplasm, for example in PAM55 (Fig. 5) in which samples PT8, PT9 and samples PT2-PT6 were contained within three different clades, respectively. This suggests that beyond clonal genetic alterations in chromatin modifier genes, subclonal populations with SF or SD may be further defined by a combination of epigenetic and/or microenvironmental cues13,24.
Fig. 5 |. Integration of transcriptomic and morphologic features with phylogenetic patterns in PDAC PAM55 with clonal KMT2C mutation.
a, Phylogenetic tree of patient PAM655. Red and purple outlines indicate samples that have SF or SD on the basis of RNA-seq (triangles) and/or histology (squares). The predicted timing of somatic alterations in driver genes and whole-genome duplication are also shown. Mutations in chromatin modifier genes are in red font, all others are in orange. SF or SD in this carcinoma have arisen as three independent subclones as defined by their genetic features: in primary tumor sample PT8, in primary tumor sample PT9 and in the subclone giving rise to the evolutionary related primary tumor samples PT5 and PT6 and metastases PT2-PT4. b, PCA (214 samples from 27 patients) illustrates intratumoral expressional heterogeneity and the transition between GL samples (n = 8) and SF or SD samples (n=10) in patient PAM55. c, Relationship of anatomic location to morphologic and transcriptional heterogeneity. The spatial location of each sample is shown within the primary tumor or distant sites along with their corresponding transcriptional and histological subtypes. Both histological and transcriptional heterogeneity are identified in the primary tumor, whereas retroperitoneal metastases (met) showed SD with basal-like-type expression and multiple liver metastases showed GL with classical-type expression, d, Representative histological images of tumors in the same patient, PAM55 (a total 38 histological images were taken). Scale bars, 100 μm.
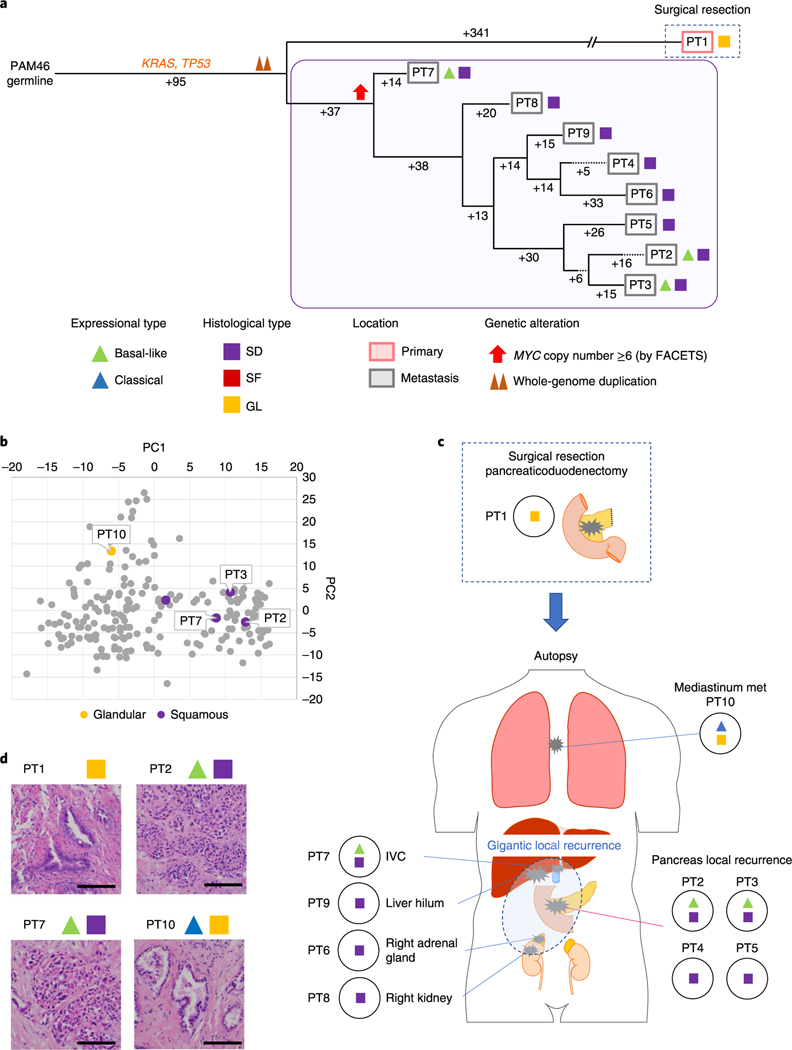
Fig. 7 |. Integration of transcriptomic and morphologic features with phylogenetic patterns in PDAC PAM46 with MYC amplification.
a, Phylogenetic tree of patient PAM46. The purple outline indicates samples that have SFor SD on the basis of RNA-seq (triangles) and/or histology (squares). The predicted timing of somatic alterations in driver genes, whole-genome duplication and MYC amplification are also shown. No mutations in chromatin modifier genes were identified. MYC amplification (>6 copies) was detected in all samples of local recurrence but not the original resected primary tumor PT1. b, PCA (214 samples from 27 patients) indicates PT10 (GL morphology, n=1) shows a different expressional type from other SD samples (n = 4) in patient PAM46. c, Relationship of anatomical location to morphological and transcriptional heterogeneity. The spatial location of each sample is shown within the primary tumor or distant sites and their corresponding transcriptional and histological subtypes. The GL pattern was only identified in primary surgical resection and mediastinum metastasis (PT10) at autopsy. IVC, inferior vena cava, d, Representative histological images of representative tumors in the same patient (a total of 79 images were taken for PAM46). Scale bars, 100 μm.
Phenotypic characteristics of MYC amplification during PDAC evolution.
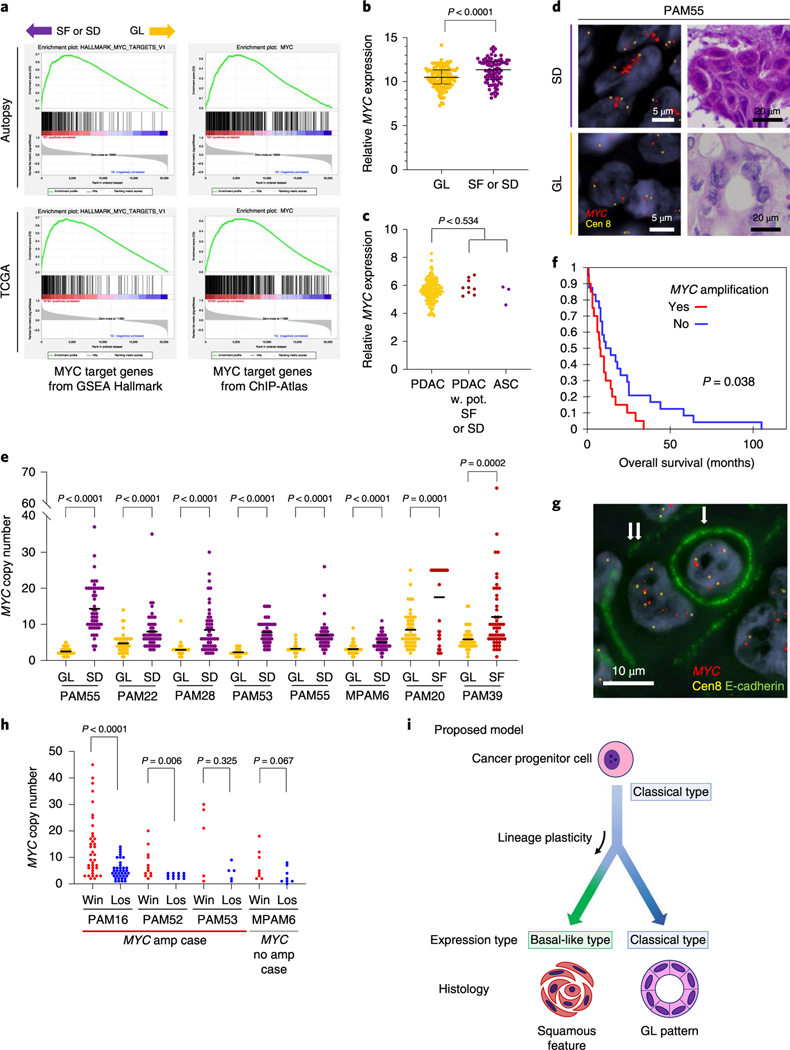
To gather insight into potential molecular features that contribute to the development of SF or SD in PDAC, we mined our RNA-seq dataset to determine the transcriptional differences between samples with GL morphology and SF or SD morphology in an unbiased manner. MYC gene expression was significantly higher in SF or SD in our end-stage cohort (P< 0.0001, Mann-Whitney U-test; Fig. 8a). Gene-set enrichment analysis (GSEA) using Hallmark gene sets and transcription factor target gene sets (Methods and Supplementary Table 5) revealed that the cell cycle pathway (E2F target genes) and the MYC pathway (MYC target genes) were significantly enriched in samples with SF or SD compared to GL morphology (Fig. 8b, Supplementary Tables 6 and 7), a finding similar to that reported by Bailey et al.6. MYC gene expression differences were not confirmed in resectable PDAC in the TCGA cohort (Fig. 8c), although MYC pathway enrichment was suggested (Fig. 8a and Supplementary Tables 8 and 9).
Fig. 8 |. Squamous features in pancreatic ductal adenocarcinoma correspond to enhancement of MYC.
a, GSEA using Hallmark gene sets and transcription factor target gene sets collected from the ChlP-Atlas identify MYC target genes as the significantly enriched gene set in SF or SD (see also Supplementary Tables 5–8). b, Normalized MYC mRNA expression in the autopsy cohort. Transcript abundance is significantly higher in SF or SD samples (n=81) than in GL samples (n=133) in the end-stage autopsy cohort (P< 0.0001, two-sided Mann-Whitney U-test), Lines and bars indicate the median and interquartile range, c, MYC mRNA expression in the TCGA cohort. No significant expressional difference was found between PDAC (n=133) and PDAC with potential SF or SD (n = 9) or ASC (n = 3; P= 0.534, two-sided Mann-Whitney U-test). d, Representative images of MYC FISH in SF or SD and GL regions (total 46 FISH-processed images), e, Analysis of MYC copy number in eight cases indicates that MYC is significantly amplified in SF or SD regions compared to GL regions in the same carcinoma. Each P value was calculated with a two-sided Mann-Whitney U-test. For each region, 50 cells were randomly picked up for MYC copy number count. Bars indicate the median, f, Kaplan-Meier analysis, indicating patients whose carcinomas have an MYC high (≥6) copy number (n = 20) have a worse outcome than carcinomas with a low MYC copy number (n = 24; P= 0.038, log-rank test), g, Representative images of entosis (single arrow indicates a loser (eaten cell), double arrows indicate a winner (eating cell); total 38 immuno-FISH-processed images), h, Winner (win) cells have a higher MYC copy number than loser (los) cells. P values were calculated using a two-sided Mann-Whitney U-test. Overall, 38,12,5 and 8 entotic CIC patterns were evaluated for PAM16, PAM52, PAM53 and MPAM6, respectively, i, Proposed model for the relationship of squamous feature and basal-like expression in PDAC. In this model, the development of squamous feature (SF or SD) is an adaptive process that results from a combination of genetic alterations, epigenetic plasticity and microenvironmental changes over the lifetime of the neoplasm.
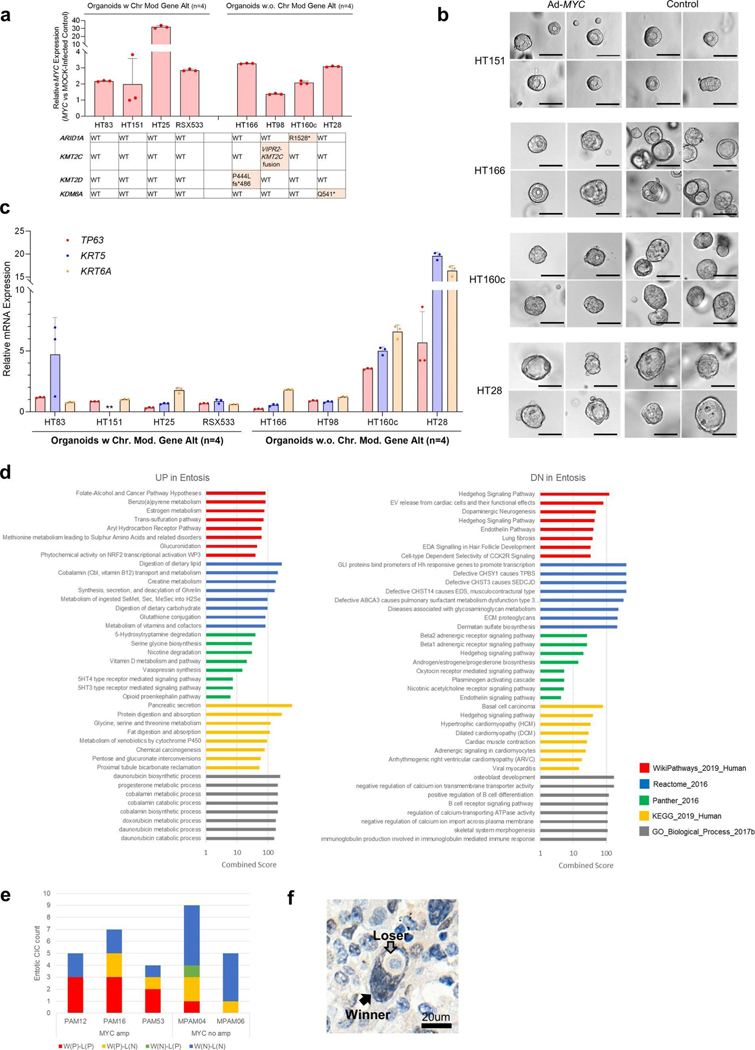
We focused more closely on the MYC pathway given MYC is a known target of amplification in PDAC25,26 and MYC copy number gain was identified in 83% of ASC or PDAC with SF or SD compared to only 35% of conventional PDAC. This difference was statistically significant (P=0.007, two-sided Fisher’s exact test; Fig. 4a) and confirmed in the MSK Clinical IMPACT cohort (P= 0.029; Supplementary Table 10 and Extended Data Fig. 4a). The overall frequency of MYC amplification was also significantly higher in our end-stage cohort (21 of43,49%) compared to the MSK Clinial IMPACT cohort (20 of 617, 3%) or the TCGA cohort (5 of 149, 5%; described in the TCGA paper Fig. 1)7 (P<0.0001, autopsy versus MSK and versus TCGA, two-sided Fisher’s exact test) indicating MYC amplification correlates with disease progression. To further understand the relationship of MYC amplification to SF or SD in end-stage PDAC, we performed fluorescence in situ hybridization (FISH) analysis for MYC copy number in eight carcinomas where both GL and SF or SD morphologies were present within the same tumor or section. In all eight examples, the MYC copy number was significantly higher in regions with SF or SD morphology compared to regions with GL morphology (Fig. 8d,e). Overall these findings indicate that gains in MYC copy number are correlated with PDAC progression, associated with poor clinical outcome (Fig. 8f) and particularly so with SF or SD. To determine the extent that MYC functionally contributes to SF or SD, we overexpressed MYC in eight PDAC organoid models using an adenoviral vector. MYC overexpression was demonstrated in all eight models but did not cause a notable difference in morphology. Four organoid models were wild type for all chromatin modifier genes and four had a deleterious mutation (one each with ARID1A, KMT2C, KMT2D or KMD6A mutations). Two of four organoids with a mutation in a chromatin modifier gene showed overexpression of the squamous markers TP63, KRT5 and KRT6A compared to mock-infected organoids, whereas none of the organoids with MYC overexpression but with wild-type chromatin modifiers, overexpressed these markers (Extended Data Fig. 10a–c). These findings support the role of MYC overexpression, together with epigenetic dysregulation caused by chromatin modifier gene mutations, as contributing to the development of squamous features.
PDACs with MYC amplification also had a higher number of entotic CICs (P= 0.034, two-sided Fisher’s exact test; Fig. 4a). Moreover, RNA-seq analysis indicated that perturbation of numerous metabolic pathways is associated with the presence of entotic CICs (Extended Data Fig. 10d) in keeping with the central role of MYC in cancer cell metabolism27. In light of the correlation of both MYC amplification and entosis with SF or SD, we more closely determined the relationship, if any, between these two observations. First, we reviewed four cases with concurrent MYC amplification and entotic CICs by specifically determining MYC copy number in matched winner cells (eating) and loser cells (eaten; Fig. 8g). This revealed a remarkable degree of intercellular heterogeneity for MYC copy number, in that winner cells had a median of 9 (interquartile range 4–17) copies of MYC compared to only a median of 4 (interquartile range 2–6) copies per loser cell (P< 0.0001, MannWhitney [U-test; Fig. 8h). After normalization for the chromosome 8 copy, the winner cells retained a higher copy number compared to loser cells (a median of 1.5 (interquartile range 1.3–2.3) copies per winner cell compared to a median of 1.5 (interquartile range 1.0–2.0) copies per loser cell), but the difference was not statistically significant (P= 0.283, two-sided Mann-Whitney U-test) suggesting that the gain in MYC copy number is selected for in the context of gains in ploidy28. We therefore evaluated the approximate timing of MYC copy number gain during clonal evolution based on FACETS copy number and ploidy estimations generated for the 12 sequenced cases for which phylogenies were derived. MYC amplification was present in five cases, all in a subclonal manner (Figs. 6a and 7a and Extended Data Figs. 6a,e and 8a). All five cases had whole-genome duplication in one or more samples, and in three cases the phylogenies indicated that MYC amplification accompanied or followed gains in ploidy (Fig. 7a and Extended Data Figs. 6a and 8a). Our integrated phylogenetic analyses and morphologic studies further indicated that, in four cases, the samples with SF or SD occurred in a lineage derived from the subclonal population with MYC amplification (Figs. 6a and 7a and Extended Data Figs. 6a,e). Of note, intercellular heterogeneity for MYC was not always the resulting gene amplification as we identified cases without amplification that nonetheless had intercellular heterogeneity for MYC protein expression, including overexpression in winner cells but not loser cells within entotic CICs (Fig. 8h and Extended Data Fig. 10e,f). Together, these findings support the notion that MYC amplification or overexpression contributes to the development of SF or SD in PDAC.
Discussion
We describe a unifying paradigm for transcriptional subtypes, squamous morphology and somatic mutations in chromatin modifier genes that is rooted in phylogenetic analyses (Fig. 8i). The power of this analysis stems from our use of multiregion sampling of primary and metastatic tumors from a large set of patients. When used in this manner, multiregion sequencing becomes a powerful tool for studying the evolutionary biology of cancer because it permits sampling to completion29 (spatial sampling to a high degree so that clonal relationships are more clearly inferred and false negatives are minimized). This paradigm also provides needed insight into the contexts by which to understand the significance of these molecular events for stratification of patients with PDAC for personalized medicine approaches. We now show that squamous features and basal-like expression signatures are a subclonal feature in PDAC and not an entirely distinct form of the disease that arises from a common precursor cell as proposed12. Three lines of evidence support this interpretation. First, the paucity of data reporting pure early-stage ASCs and that SF or SD are commonly found in association with conventional GL pattern are consistent with this possibility30. Second, previous studies of ASC have reported small foci of residual GL carcinoma when the entire neoplasm is carefully reviewed15,30,31. Finally, whereas SF or SD may arise during the clonal evolution of a PDAC, we did not observe the converse scenario by phylogenetic analysis, that is a subclonal GL component arising in a predominant SF or SD neoplasm. We believe the former is the most parsimonious explanation, yet we acknowledge a second possibility where a common phenotypic intermediate cell type gives rise to both classical and basal-like phenotypes. Our study relied on bulk and macrodis-sected tissues, thus we did not reach the level of resolution required to answer this question definitively. Nonetheless these findings will require revisiting the interpretation of transcriptional subtypes in single biopsies and their relevance for devising a molecular taxonomy of pancreatic cancer.
While mutations in ARID1A, KMT2C and related chromatin modifier genes have consistently been identified in large-scale screens of the PDAC genome6,7, their significance for the natural history of PDAC has remained unclear. We now show that the evolutionary context in which these mutations occur is related to the likelihood that PDAC will develop squamoid or squamous morphology. Considering reports showing that all of the aforementioned genes studied play a role in cellular lineage and plasticity of cancer by modulating chromatin architecture and in some instances by direcdy modulating each other32–35, these findings collectively point to a convergent mechanism in some PDACs related to aberrant cell lineages and differentiation programs. The efficiency of this mechanism in causing plasticity seems to be increased when inactivation occurs early in the life history of PDAC (clonal mutations) where all cells contain the genetic defect. We note this likelihood is not absolute, as evidenced by the deceased patients in our cohort with poorly differentiated PDACs with clonal mutations in chromatin modifier genes. While our findings are consistent with reports that ASCs are associated with a worse outcome36, they also contradict those that report an improved outcome in PDACs with mutations in ARID1A, KMT2C and related chromatin modifier genes37,38. Future efforts that consider somatic mutations in these genes, specifically in the context of whole-genome duplication, MYC copy number and morphologic features may resolve this discrepancy.
These data also contextualize the significance of MYC copy number gain in PDAC by illustrating it is selected for during tumor progression and in association with whole-genome duplication. Furthermore, we identify an unappreciated feature of MYC in PDAC, intercellular heterogeneity for copy number that is associated with entosis. Entosis, a process in which a cancer cell engulfs its neighbor, represents a form of cell competition that is stimulated by low glucose environments19,39. Intriguingly, MYC expression has also been shown to promote competition between normal cells in both fly and mammalian tissues during development40,41, suggesting a potential mechanistic parallel between intercellular heterogeneity for MYC copy number and stimulation of cell competition. In PDAC specifically, these observations provide clues to the microenvironmental changes (glucose depletion) that contribute to MYC amplification or overexpression and the development of SF or SD in association with mutations in chromatin modifier genes42.
We expect that our findings will also have implications for understanding other solid tumor types in which these mutations occur and/or that develop squamous features in the course of disease progression. Ultimately, our hope is that comprehensive studies such as this pave the way for identifying novel therapeutic vulnerabilities or re-evaluation of the utility of currently available therapies on the basis of the genotypes and phenotypes assessed.
Methods
Ethics statement.
This study was approved by the Review Boards of the Johns Hopkins School of Medicine and Memorial Sloan Kettering Cancer Center.
Patient selection.
A cohort of 150 patients from the Gastrointestinal Cancer Rapid Medical Donation Program at the Johns Hopkins Hospital and 6 patients from the Medical Donation Program at Memorial Sloan Kettering Cancer Center were used. All patients had a premortem diagnosis of PDAC based on pathologic review of resected or biopsy material and/or radiographic and biomarker studies.
Histology and IHC.
H&E slides cut from FFPE blocks of each autopsy were reviewed by two gastrointestinal pathologists (AH. and C.AI.-D.). On the basis of review and joint discussion, a consensus diagnosis was rendered. Immunolabeling was performed on unstained serial sections cut from a subset of FFPE blocks per patient, with antibodies against p63 (Ventana, clone 4A4), CK5 or CK6 (Ventana, clone D5/16B4) according to an optimized protocol on a Ventana Benchmark XT autostainer (Ventana Medical Systems). Appropriate positive and negative controls were included in each run. The proportion of SD in each carcinoma was estimated based on the number of blocks with SF or SD and the area of SD within each block (1% tile for 1–5,5% tile for 5–100%).
Histological review for MSK Clinal IMPACT cohort.
All TCGA and MSK Clinal IMPACT slides were reviewed by two gastrointestinal pathologists (A.H. and C.A.I.-D.). Samples with <20 HPFs and/or extensive tissue degeneration were excluded. Twenty-six ASC and 617 PDAC samples met these criteria and were used for further analyses. We referred to PDACs with >30% solid (trabecular or alveolar) components as PDACs with potential SF or SD because IHC for squamous markers (p63, CK5/6) was not available. Of 617 PDACs, we classified 51 as PDACs with potential SF or SD.
Histological review for the TCGA cohort.
A total of 145 TCGA pancreatic cancer slides were reviewed by two gastrointestinal pathologists (A.H. and C.A.I.-D.) using Slide Image Viewer (portalgdc.cancer.gov/image-viewer). Nonductal neoplasms (n=4) and one colloid (mucinous noncystic) carcinoma were excluded. PDACs with >30% solid (trabecular or alveolar) components were classified as a PDAC with potential SF or SD (Extended Data Fig. 2a).
Histological review for entosis.
All H&E sections of each patient were reviewed by two gastrointestinal pathologists (A.H. and C.A.I.-D.) for entotic CICs using the criteria proposed by MacKay20: the cytoplasm of the host cell (winner or engulfing cell), nucleus of the host cell (typically crescent-shaped, binucleate or multilobular and pushed against the cytoplasmic wall), an intervening vacuolar space completely surrounding the internalized cell (loser), cytoplasm of internalized cell and nucleus of internalized cell (often round in shape and located centrally or acentrically). If internalized and/or engulfing cells were undergoing mitosis or any apoptotic changes they were excluded from analysis. Apoptotic changes were characterized by pyknotic nuclei, nuclear fragmentation and loss of nuclear detail. For each H&E section, after whole review of the entire tumor with a low power view, ten representative HPFs without necrosis were randomly picked for entotic CIC review. Any cases in which we had fewer than five slides for review were excluded from this analysis. Representative entotic CICs were validated by IF labeling for e-cadherin in combination with 4,6-diamidino-2-phenylindole (DAPI) to highlight cell nuclei in the Molecular Cytogenetics Core at MSKCC (see MYC Immuno-FISH analysis section below for details).
For the MSK Clinical IMPACT cohort, after initial reviewing, we picked 300 PDACs using a random number generator and all 26 ASC patients were enrolled for the entosis study. To identify the exact areas that were sequenced for IMPACT, we only used cases where the sequencing area digital slides were ≥50 HPFs. Eventually, 186 conventional PDACs, 17 PDACs with potential SF or SD and 19 ASCs were used for the entosis study. All available areas were reviewed for entosis and entotic CICs per ten HPFs were calculated.
RNA sequencing.
Frozen sections were cut from samples for histological review and regions of interest were macrodissected for extracting total RNA using TRIzol (Life Technologies) followed by Rneasy Plus Mini Kit (Qiagen). Each RNA sample was initially quantified by Qubit 2.0 Fluorometer (Thermo Fisher Scientific). Samples were additionally quantified by RiboGreen and assessed for quality control using an Agilent BioAnalyzer in the Integrated Genomics Core at MSKCC and 513ng to 1.0 μg of total RNA with an RNA integrity number ranging 1.3–8.3 underwent ribosomal depletion and library preparation using the TruSeq Stranded Total RNA LT kit (Illumina, RS-122–1202) according to instructions provided by the manufacturer with eight cycles of PCR. Samples were barcoded and run on a HiSeq 4000 in a 100 bp per 100 bp or 125 bp per 125 bp paired end run, using the HiSeq 3000/4000 SBS kit (Illumina). On average, 94 million paired reads were generated per sample and 26% of the data were mapped to the transcriptome.
RNA-seq data alignment and analysis.
RNA-seq data alignment and initial analysis was performed by the MSK Bioinformatics Core. Output data (FASTQ files) were mapped to the target genome using the rnaStar aligner43 that maps reads genomically and resolves reads across splice junctions. The two-pass mapping method outlined by Engstrom44 was used in which the reads were mapped twice, the first mapping performed using a list of known annotated junctions from Ensembl and the second mapping performed on the basis of known and new junctions. Postprocessing of the output SAM files was performed using PICARD tools to add read groups and convert to a compressed BAM format The expression count matrix from the mapped reads was determined using HTSeq (https://htseq.readthedocs.io/en/release_0.11.1) and the raw count matrix generated by HTSeq was processed using the R/Bioconductor package DESeq2 (http://bioconductor.org/packages/release/bioc/html/DESeq2.html) to normalize the entire dataset between sample groups. Log2-transformated data were used as a normalized expression for downstream analyses (Supplementary Dataset 1). Eight samples were sequenced in duplicate for validation.
TCGA RNA-seq data.
TCGA pancreatic cancer (v.2016_01_28 for PAAD) RNA-seq data were downloaded through Firebrowse (http://firebrowse.oig). Transcripts per million (TPM) was calculated from downloaded RNA-seq data45.TPM was used for GSEA and log2-converted TPM values were used as relative mRNA expression.
Molecular subtype, absolute tumor purity and gene mutation in the TCGA cohort.
Molecular subtype, absolute tumor purity and driver-gene mutations in the TCGA cohort were cited from Supplementary Table 1 (https://ars.els-cdn.com/content/image/l-s2.0-S1535610817302994-mmc2.xlsx) of the recent TCGA paper7.
Network analysis and cytoscape visualization.
Co-expression networks were constructed by first identifying the best predicted soft threshold for transforming the data. Pearson correlation between any two genes across samples was next used as the weight between nodes. A subset of keratin family genes was used to construct the weighted gene-gene network and the network structure was visualized using Cytoscape (v.3.7.2)46. We adjusted the width of edges connecting nodes based on the weights and weights that were <0.05 were removed from the network.
Expression type classification and PCA analysis.
A 50 pancreatic cancer-related gene set identified by Moffitt et al. was used to classify all samples into classical and basal-like types11. Clustering analysis and heatmaps were displayed using the R package ‘pheatmap’ using Spearman’s rank correlation. These 50-gene signatures were also used for generating the PCA plot using the DESeq2 package (http://bioconductor.org/packages/release/bioc/html/DESeq2.html).
Expression type classification and circos plot.
Cancer-related gene sets identified by Collisson et al.12 and Bailey et al.6 were used to classify all samples into quasimesenchymal, exocrine-like and classical types for the Collisson criteria, and squamous, immunogenic, ADEX and progenitor types for the Bailey criteria. The circos plot was constructed using Circos (mkweb.bcgsc.ca/circos) and colored according to their subtypes or purity information.
GSEA.
GSEA was performed on the basis of the methods described47. Both gene sets and transcription factor target gene sets (Supplementary Table 4) based on ChlP-seq data downloaded from ChlP-Atlas (http://chip-atlas.org)48 were used for analysis. Only the top 500 ChIP peaks located within 1,000 bp from the transcription start site with scores >50 were used.
Pathway analysis for entosis.
Genes were identified as differentially expressed using the R package DESeq2 with a cutoff of absolute fold change ≥1.5 and adjusted P< 0.05 between experimental conditions (http://bioconductor.org/packages/release/bioc/html/DESeq2.html). Functional enrichments of these differentially expressed genes were performed with the enrichment analysis tool enrichR (https://amp.pharm.mssm.edu/Enrichr)49 and the retrieved combined score (log(P value) × z score) was displayed.
DNA sequencing.
Genomic DNA was extracted from each tissue using QIAamp DNA Mini Kits (Qiagen). WGS, WES and alignment were performed as previously described50. Briefly, an Illumina HiSeq 2000, HiSeq 2500, HiSeq 4000 or NovaSeq 6000 platform was used to target a coverage of 60× for WGS samples and 150× for WES samples. The resulting sequencing reads were analyzed in silico to assess quality, coverage, as well as alignment to the human reference genome (hgl9) using BWA51. After read de-duplication, base quality recalibration and multiple sequence realignment were completed with the PICARD Suite and GATK v.3.1 (refs.52,53), somatic single-nucleotide variants and insertion-deletion mutations were detected using Mutect v.1.1.6 and HaplotypeCaller v.2.4 (refs.52,54). We excluded low-quality or poorly aligned reads from phylogenetic analysis. Filtering of called somatic mutations required each mutant to be observed in at least one neoplastic sample per patient with at least 5% variant allele frequency and with at least 20× coverage; correspondingly, each mutant had to have been observed in <2% of the reads (or fewer than two reads in total) of the matched normal sample with at least 10× coverage. Regarding PAM02, we used the data previously reported50.
Driver-gene annotations.
All somatic variants causing a frameshift deletion, frameshift insertion, in-frame deletion, in-frame insertion, nonsynonymous missense, nonsense, nonstop, splice site or region or a translation start site change were considered. Variants were called driver mutations if they passed at least three of the following methods: 20/20+ (ref. 55), 20/20+ PDAC55, TUSON56 and MutSigCV57. For frameshift deletions, frameshift insertions and nonsense mutations specifically, passing only two of these four methods was required if they identified in MSK-IMPACT17. Additionally, we required a CHASM P value ≤0.05 and false discovery rate ≤0.25 for the 20/20+ and 20/20+ PDAC methods. We also considered genes significantly mutated in large PDAC sequencing studies4,5,7. Driver-gene alterations were confirmed by additional target sequencing and manual review with Integrative Genome Viewer (v.2.7.x)58.
Mutational status of TP53 for the entosis study.
The TP53 status of 74 autopsy cases that were used for the entosis study was confirmed by target sequence and IHC as previously described59 with or without WGS or WES.
MSK Clinical IMPACT and chromatin modifier genes.
All digital images of 1, 574 PDACs or 39 ASCs in the MSK Clinical IMPACT database at the time of this work were visualized through cBioPortal (v.2.2.0)60. The four major driver genes (KRAS, TP53, CDKN2A and SMAD4) and all chromatin modifier genes detected with a frequency > 1% in the MSK Clinical IMPACT (all gene panel versions) were included for further analyses, including Kaplan-Meier analysis. To determine the relation between genetic alteration and morphologic change, 26 ASCs, 51 PDACs with potential SF or SD and 540 conventional PDACs were enrolled for this analysis (see Extended Data Fig. 2b).
Whole-genome duplication.
Whole-genome duplication was performed in combination of computational analysis and manually reviewed following Bielski et al.28, called if mitochondrial copy number ≥2, and ploidy ≥ 2.5 and > 50% of the autosomal genome was affected. Three low tumor purity samples (PAM22PT5, PAM25PT2 and PAM32PT4) which did not match these criteria were judged in consideration of expecting whole-genome duplication occurrent point in phylogenetic trees.
Evolutionary analysis.
We derived phylogenies for each set of samples by using Treeomics 1.7.9 (ref.61). Each phylogeny was rooted at the matched patient’s normal sample and the leaves represented tumor samples. Treeomics employs a Bayesian inference model to account for error-prone sequencing and varying neoplastic cell content to calculate the probability that a specific variant is present or absent The global optimal tree is based on mixed integer linear programming. All evolutionary analyses were performed on the basis of WES data with the exception of PAM02 (using WGS and additional target sequencing)50 and MPAM6 (WGS). Somatic alterations present in all analyzed samples of a PDAC were considered clonal, in a subset of samples or a single sample considered subclonal.
MYC amplification.
MYC amplification was defined as at least sixfold by FACETS62 or FISH (see following paragraph). In brief, FACETS performs a complete analysis that includes library size and (G+C)-content normalization and segmentation of total and allele-specific signals, using coverage and genotypes of single-nucleotide polymorphisms simultaneously across the exome. The resulting segments accurately identify points of change in the exome, accounting for diploidy, purity and average ploidy for each sample. A maximum likelihood approach then assigns each segment with a major and minor integer copy number.
MYC immuno-FISH analysis.
Immuno-FISH was performed on paraffin sections according to procedures optimized at the Molecular Cytogenetics Core Facility. The primary (e-Cadherin (24E10) rabbit monoclonal antibody) and secondary (goat anti-rabbit, Alexa 488) antibody was purchased from Cell Signaling Technology and Invitrogen (Thermo Fisher Scientific), respectively. The two-color MYC-Cen8 probe was prepared in-house and consisted of bacterial artificial chromosome clones containing the full length MYC gene (clones RPI-80K22, RP11–1136L8 and CTD-2267H22; labeled with Red deoxyuridine triphosphate (dUTP)) and a centromeric repeat plasmid for chromosome 8 served as the control (pJM128; labeled with Green dUTP). Briefly, de-waxed paraffin sections were microwaved in lOmM sodium citrate, pretreated with 10% pepsin for lOmin at 37 °C, rinsed in 2× SSC, dehydrated in ethanol series (70%, 90% and 100%), codenatured at 80 °C for 4min with 5–20 μl of MYC-Cen8 DNA-FISH probe and hybridized for 72h at 37°C. Following hybridization, sections were washed with wash buffer (0.01% Tween 20 in 2× SSC), fixed in 4% formaldehyde for 15–20min at room temperature (RT), rinsed in l× PBS, blocked at RT for 1 h (blocking buffer: 5% FBS and 0.01% Tween 20 in l× PBS) and incubated overnight at 4°C with primary antibody (1:100 dilution in 1% FBS and 0.01% Tween 20 in l× PBS). Following overnight incubation, sections were washed with wash buffer, rinsed in l× PBS, incubated with secondary antibody (1:500 dilution) for lhat 37°C, rinsed in l× PBS, stained with DAPI and mounted in antifade (Vectashield, Vector Laboratories). Slides were scanned using a Zeiss Axioplan 2i epifluorescence microscope equipped with Isis 5.5.9 imaging software (MetaSystems Group). Metafer and VSlide modules within the software were used to generate virtual images of H&E- and DAPI-stained sections. In all, corresponding H&E sections assisted in localizing the tumor region and histology (GL, SF or SD). The entire section was systematically scanned under ×63 objectives to assess the MYC-Cen8 copy number across different histologies and to identify entotic CICs. All observed entotic cells and representative regions within a patient were imaged through the depth of the tissue (merged stack of 16 z-section images taken at 0.5-μm intervals) and signal counts were performed on captured images. For correlation of MYC-Cen8 copy number with histology, for each case, a minimum of 50 discrete nuclei were scored (range 50–150). Within a given histology (GL, SF or SD), when the MYC-Cen8 copy number was heterogeneous and topographically distinct, a minimum of 50 discrete nuclei were scored for each distinct region whenever possible. For the correlation of MYC-Cen8 copy number with entosis, only CICs meeting the selection criteria previously described were scored. For each CIC, MYC-Cen8 copy number was recorded separately for the winner and loser. The presence of e-cadherin staining (which highlights the cell perimeter) and nuclear morphology helped distinguish the loser (internalized cell with uniformly round nucleus) from the winner (host cell with crescent-shaped, binucleate or multilobulated nucleus and often pushed against the cytoplasmic wall). To minimize truncation artifacts, only nuclei with at least one signal for MYC and Cen8 were selected. MYC amplification was defined as: ≥2 MYC-Cen8 ratio, ≥6 copies of MYC (discrete signal) or the presence of at least one MYC cluster (≥4 copies; tandem duplications). Overall, 3–5 copies of MYC-Cen8 were regarded as copy number gain (polysomy).
MYC immunohistochemistry.
MYC IHC was performed at the Molecular Cytogenetics Core Facility. Paraffin sections with 5-μm thickness were stained for IHC on Leica Bond RX (Leica Biosystems) with 8 μg ml−1 c-myc rabbit monoclonal antibody (Cell Signaling Technologies,13987) for 1 h on the basis of the default manufacturer Protocol F. The sections were pretreated with Leica Bond ER2 buffer (Leica Biosystems) for 20 min at 100 °C before each staining. After staining the sections were dehydrated and mounted with Permount for digital scanning with Pannoramic Confocal (3dHistech) using ×40 water objective.
Human specimen collection for organoids.
The study was conducted under Memorial Sloan Kettering Cancer Center Institutional Review Board approval (MSKCCIRB 15–149 or 06–107) and all patients provided informed consent before tissue acquisition. Clinical and pathologic data were entered and maintained in a database by the research project coordinator, who generated a separate deidentified database for the investigator team. All eight organoids used for this paper were generated from conventional PDAC as defined by (1) the tubular growth pattern and associated desmoplastic stroma of the originating tissues; and (2) classical-type gene expression (Moffitt criteria) of RNA-seq data generated for each organoid (N. Lecomte, personal communication).
Generation and expansion of patient-derived organoids.
Tissue resections and biopsies from patients with pancreatic cancer were processed according to protocols previously described by H. Clevers63 and slightly modified to ensure maximum viable cell recovery and organoid formation efficiency. Pancreatic tumor cells were seeded in growth-factor-reduced Matrigel (BD biosciences) and cultured in a wnt-driven expansion medium containing: DMEM-F12 Advanced (Gibco), 10 mM Hepes (Gibco), 500 μg ml−1 antibiotics (Gibco), 2mM Glutamax (Gibco), 0.5 μM A83–01 (Tocris), 50 ng ml−1 human epidermal growth factor (EGF) (Peprotech), 100 ng ml−1 human fibroblast growth factor 10 (FGF10) (Peprotech), l00 ng ml−1 human Noggin (Peprotech), 10 nM human Gastrin I (Sigma), 1.25mM N-acetylcysteine (Sigma), l0nM nicotinamide (Sigma), 1× B-27 supplement (Gibco), 50% Wnt-conditioned medium (v/v) produced from L-Wnt3a cells (a gift from H. Clevers) and 10% R-spondin-conditioned medium (v/v) produced from HA-RSPol-Fc cells (a gift from C. Kuo).
MYC ectopic expression by adenovirus or lentivirus infection of organoids.
Exponentially growing human organoids were dissociated into single cells and infected by viral particles at a multiplicity of infection of 50. All virus infections were conducted in 50μ1 of complete organoid medium supplemented with polybrene at 8 μg ml−1 by spinoculation at 600g for 2h followed by incubation at 37°C for 4h in a CO2 incubator. Cells were then resuspended in Matrigel and plated.
Transient ectopic expression of MYC was achieved using Ad-MYC adenoviral particles or Ad-eGFP as a control (Vector Biolabs) driven by a cytomegalovirus (CMV) promotor. At 5–6 d after infection, organoid cells were sorted by GFP expression using a BD FACS Aria (BD Biosciences) and replated. As an alternative strategy, organoids with stable MYC expression driven by an EF1A promotor were developed using Lv-MYC lentivirus or Lv-GFP as control (Kerafast) followed by puromycin selection at 5 μg ml−1. Morphology of MYC or mock-infected organoids was assessed 5 d after sorting and images were captured on Cytation (Biotek).
Quantitative evaluation of PDAC subtype markers by quantitative PCR with reverse transcription.
Total RNA was prepared from organoids using the Trizol Plus RNA Purification kit (Life Technologies) following the manufacturer’s protocol with an additional depletion of all traces of contaminant gDNA using the PureLink DNase removal kit (Life Technologies). RNA quantity and purity were measured using a Nanodrop Lite spectrophotometer (Thermo Scientific). Complementary DNA was synthesized from 500 ng total RNA with the MultiScribe ReverseTranscriptase (Thermo Fisher) for 2h at 37 °C in a Mastercycler Pro (Eppendorf). Quantitative PCR with reverse transcription was performed in a QuantStudio 6 Flex Real-Time PCR system (Applied Biosystems) using TaqMan Gene Expression Master Mix (Applied Biosystems) and predesigned human specific primers and TaqMan FAM (6-carboxyfluorescein)-MGB (minor groove binder) exon-spanning probes (Applied Biosystems): Hs03044422_gl for ACTG1, Hs00978340_ml for TP63, Hs00361185_ml for KRT5, Hs01699178_gl for KRT6A and Hs00153408_ml for MYC. Normalized relative expression was evaluated using the comparative CT method (ΔΔCT) with ACTG1 as the housekeeping gene.
Statistics and reproducibility.
All statistics and graphs were performed and made using XLSTAT (v.2018.2) and/or GraphPad Prism (v.8.2.1) and/or R (v.3.6.1). Parametric distributions were compared by a two-sided chi-squared test, with correction using Fisher’s exact test for sample sizes <5. Nonparametric distributions were compared using a two-sided Mann-Whitney U-test and for analysis of contingency tables, a two-sided Fisher’s exact test was used. Each analysis is described in the Results. Overall survival analyses were performed using the KaplanMeier method and curves were compared by a log-rank test Statistical significance was considered if the P value was <0.05. The FDR q value was used for GSEA.
No statistical method was used to predetermine sample size. No data were excluded from the analyses as long as the library and/or sequencing quality passed our criteria. The experiments were not randomized. The investigators were not blinded to allocation during experiments and outcome assessment except for review of histological slides.
Reporting Summary.
Further information on research design is available in the Nature Research Reporting Summary linked to this article.
Data availability
RNA and DNA sequence data for this study have been deposited at the European Genome-phenome Archive under accession number EGAS00001003974. Published gene sets analyzed here are available from previous papers6,10,11. Sequencing data from the MSK IMPACT cohort that were analyzed here18 are publicly available at cBioPortal (https://www.cbioportal.org/). The other human resected pancreatic cancer data were derived from TCGA Research Network: http://cancergenome.nih.gov/. The dataset derived from this resource that supports the findings of this study is available through Firebrowse (http://firebrowse.org/). Source data for Figs. 1,3,4,8 and Extended Data Figs. 2–4 and 10 have been provided as Source Data Figs. 1,3,4 and 8 and Source Data Extended Data Figs. 2–4 and 10. All other data supporting the findings of this study are available from the corresponding author upon reasonable request.
Extended Data
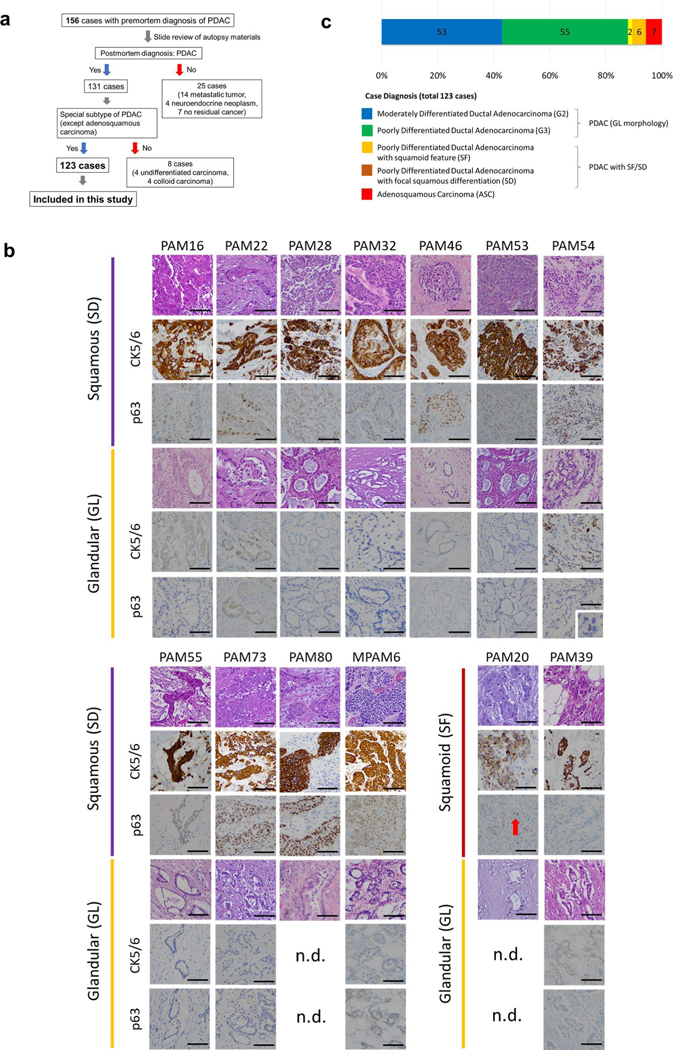
Extended Data Fig. 1 |. Case Selection and Postmortem Diagnosis.
(a) Schematic of case selection for current study, (b) Immunolabelling for glandular and squamous or squamoid components in 13 Representative PDACs. All regions with squamous differentiation (SD) showed positivity for CK5/6 and p63, whereas no labeling was observed in regions with glandular morphology (GL). In two PDACs with the neoplastic cells stained positive for CK5/6 but were negative for p63 and thus classified as having squamoid features, n.d., no immunolabeling performed. IHC was done for 31 case, 167 slides. Scale bar: 100 um. (c) Postmortem case diagnoses. Seven cases corresponded to adenosquamous carcinoma (ASC), two cases showed squamoid features (SF) and four cases showed focal (<30%) squamous differentiation (SD).
Extended Data Fig. 2 |. Squamous Features of Pancreatic Ductal Adenocarcinoma in the TCGA and MSK Clinical IMPACT Patient Cohorts.
(a) Schematic for histological classification of cases in the TCGA and MSK clinical IMPACT cohorts, (b) Schematic for case selection in the TCGA and MSK clin ical IMPACT cohorts, (c) Frequency of case diagnoses in TCGA (n = 145), MSK Clinical IMPACT (n = 617) and our autopsy (n = 123) cohort. (d) Representative digital images of adenosquamous carcinoma (ASC) (out of 3 cases), PDAC with potential squamoid feature or squamous differentiation (PDAC with potential SF/SD) (histologic diagnosis modified based on our re-review) (out of 9 cases), and poorly differentiated ductal adenocarcinoma (out of 57 cases) in TCGA. Alveolar or trabecular pattern was confirmed in ASC or PDAC with potential SF/SD. (e) Kaplan-Meier analysis showed poor prognosis of ASC or PDAC with potential SF/SD (n = 12) compared to conventional PDAC (n = 129) in TCGA cohort (P < 0.0001, Log-rank test), (f) Kaplan-Meier analysis showed poor prognosis of ASC or PDAC with potential SF/SD (n = 70) compared to conventional PDAC (n = 494) in MSK-IMPACT cohort (P = 0.001, Log-rank test).
Extended Data Fig. 3 |. Squamous Feature Associated Alteration and Characteristic in Pancreatic Ductal Adenocarcinoma.
(a) Entotic CICs in matched glandular (GL) versus squamoid or squamous morphology (SF/SD) in 10 patients. Statistics are performed using Mann-Whitney U test, two-sided. (62, 62,73,38,50,26,33,21,8 and 21 blocks/slides were used for entosis evaluation of PAM02, MPAM06, PAM73, PAM55, PAM22, PAM28, PAM53, PAM80, PAM20 and PAM39). (b) mRNA Expression of squamous markers (TP63, KRT5 and KRT6A) in samples with glandular growth pattern (GL) (n = 133), squamoid features (SF) (n = 18) and squamous differentiation (SD) (n = 63). SF have intermediate expression pattern between SD and GL. Each P-value is calculated by Mann-Whitney U test, two-sided. Lines and bars: median with interquartile range, (c) mRNA expression of TP63, KRT5 and KRT6A. ASC (n = 3) and PDAC with potential SF/SD (n = 9) have higher expression of TP63 than conventional PDAC (n = 133) in TCGA (P = 0.007, MannWhitney U test, two-sided), (d) Keratin network based on mRNA expression. In GL, KRTI9 (normally expressed in ductal epithelia) is a hub in pancreas cancer. In SF, KRT6A and KTR5 (normally expressed in squamous epithelium) have some interaction. In SD, stratified squamous epithelium keratins (KRT4, KRT5, KRTI3, KRTI4) and heavy weight keratins (KRT1 and KRTIO) are expressed in the network, (e)-(g) Tumor purity in PDACs with or without squamous feature, (e) Tumor purity by FACETs in end stage PDAC. Samples with squamous differentiation (SD) (n = 43) have higher tumor purity than samples with squamoid feature (SF) (n = 20) or glandular pattern (GL) (n = 152) (P = 0.012 or P < 0.001, Mann-Whitney U test, two-sided). Lines and bars: median with interquartile range, (f) Intratumoral heterogeneity of tumor purity in end stage PDAC. Samples with SF or SD have higher tumor purity in one tumor (9,11,8,5, 6,11,5,9,4,12, 6,9,21,8,14,8,10,7,11,8,3,7,9, 6 and 8 samples were used for PAM46, MPAM06, PAM54, PAM53, PAM32, PAM02, PAM28, PAM22, PAM16, PAM55, PAM20, PAM39, PAM52, PAM48, PAM24, PAM56, PAM51, PAM49, PAM03, PAM29, PAM25, PAM47, PAM50, PAM27, and PAM04) (g) Absolute tumor purity in TCGA cohort. Absolute tumor purity is not different between conventional PDAC (n = 132) and PDAC with potential SF/SD (n = 9) and ASC (n = 3) (P = 0.601, Mann-Whitney U test, two-sided).
Extended Data Fig. 4 |. Mutational Characteristics of the MSK clinical IMPACT cohort.
(a) Oncoprint illustrating somatic alterations of chromatin modifier genes, RB7 and MYC amplification in 617 PDAC cases including 26 ASCsand 51 PDACs with potential SF/SD. P-value was tested using two-sided Fisher’s exact test. * indicates P-value if analysis is confined to driver gene mutations only, (b) Entotic CIC are more frequent occur in TP53 mutant PDACs (n = 180) than in TP53 wild type PDACs (n = 42) (P = 0.021, Mann-Whitney U test, two-sided).
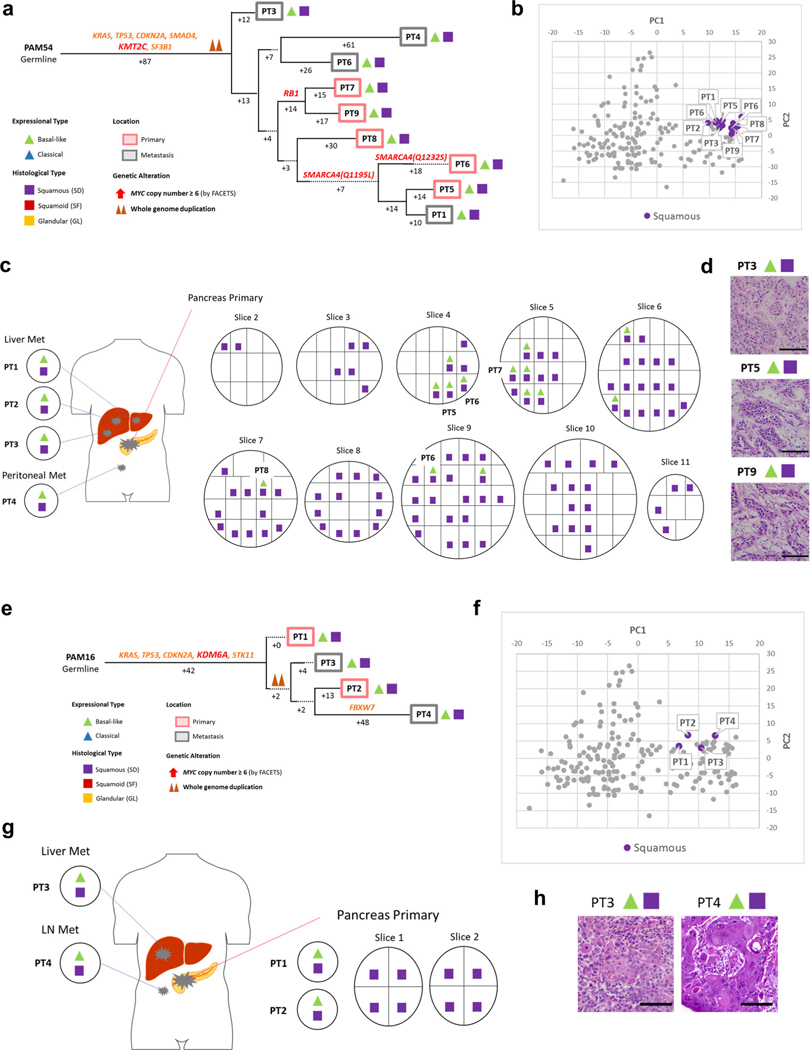
Extended Data Fig. 5 |. Integration of Transcriptomic and Morphologic Features with Phylogenetic Patterns in Pancreatic Ductal Adenocarcinoma (a-d) PAM54 with clonal KMT2C mutation and (e-h) PAM16 with clonal KDM6A mutation.
(a) Phylogenetic analysis illustrating the clonal relationship of samples analyzed in this patient. The predicted timing of somatic alterations in driver genes and whole genome duplication are also shown. Mutations in chromatin modifier genes are in red font, all others in orange. Clonal driver genes are notable for a KMT2C somatic alteration, whereas mutations in RBI and SMARCA4 (two independent mutations) are present in a subset of samples. SD in this carcinoma was found in all samples analyzed, although it was admixed with a minor glandular component in some samples, (b) Principal components analysis (214 samples from 27 patients) highly similar expression between samples (all SD, n = 18) in PAM54. (c) Relationship of anatomic location to morphologic and transcriptional profiles, (d) Representative histologic images of tumors (out of total 108 histologic images for PAM54) in the same patient. Scale bar:100um. (e) Clonal driver genes are notable fora KDM6A somatic alteration. SD in this carcinoma was found in all samples analyzed, although it was admixed with a minor GL component in some samples. (f) Principal components analysis (214 samples from 27 patients) illustrates highly similar expression between samples (all SD, n = 4) in PAM16. (g) Relationship of anatomic location to morphologic and transcriptional profiles, (h) Representative histologic images of metastatic tumors PT3 and PT4 (out of total 15 histologic images for PAM16). Scale bar: 100μm.
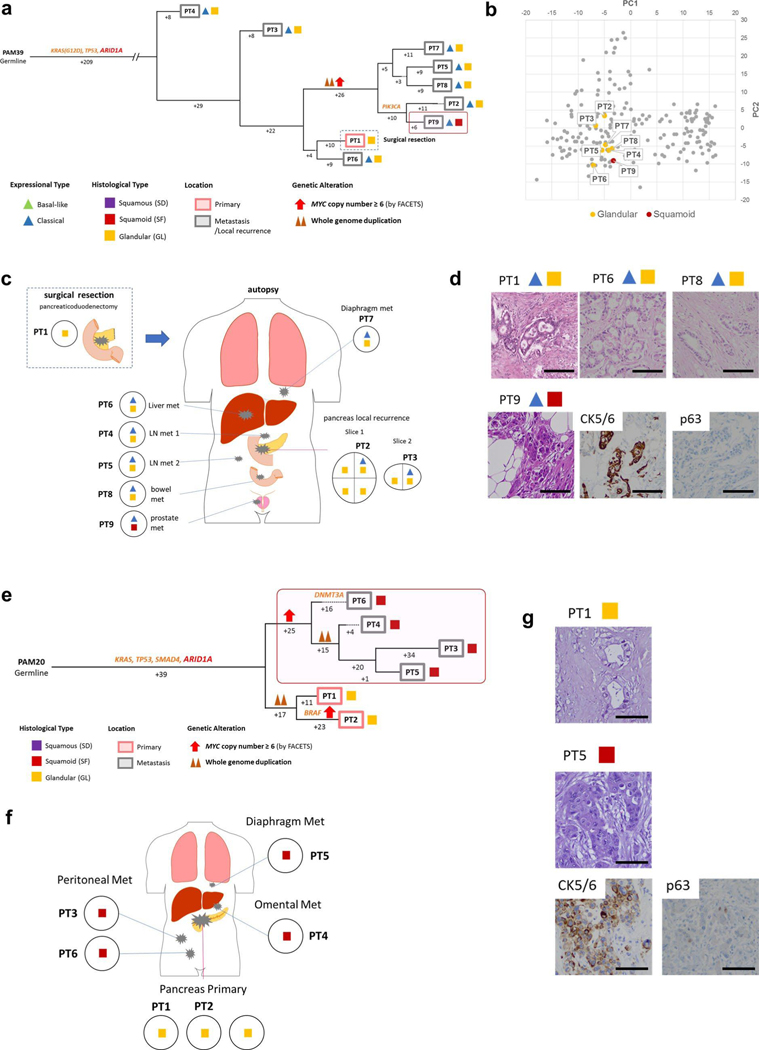
Extended Data Fig. 6 |. Integration of Transcriptomic and Morphologic Features with Phylogenetic Patterns in Pancreatic Ductal Adenocarcinoma (a)-(d) PAM39 and (e)-(g) PAM20 with clonal ARID1A mutation.
(a) Phylogenetic analysis illustrating the clonal relationship of samples analyzed in this patient. The predicted timing of somatic alterations in driver genes, whole genome duplication and MYC amplification are shown. Mutations in chromatin modifier genes are in red font, all others in orange. Red outline indicates the one sample with SF based on histology and immunohistochemical analysis (squares) but a classical type expression profile (triangle). Clonal driver genes are notable for an ARID1A somatic alteration. SF is confined to one prostate metastasis sample (PT9). (b) Principal components analysis (214 samples from 27 patients) shows a similar gene expression profile between the samples with GL (n = 7) or SF (n = 1) morphology in PAM39. (c) Relationship of anatomic location to morphologic and transcriptional heterogeneity, (d) Representative histologic and/or immunohistochemical images of the primary (PT1) and metastasis (PT6, PT8, PT9) tumors (out of total 21 histologic images for PAM39). Scale bar: 100um. (e) Clonal driver genes are notable for an ARID1A somatic alteration. MYC amplification (≥ 6 copies) was detected in all samples with SF, and in a phylogenetically distinct sample with GL within the primary tumor. Samples with SF in this carcinoma (PT3-PT6) are clonally related, (f) Relationship of anatomic location to morphologic heterogeneity. The metastasis samples PT3-PT6 showed SF whereas the primary tumor samples showed GL. (g) Representative histologic and/or immunohistochemical images of the primary tumor (PT1) and diaphragm metastasis (PT5) (out of total 8 histologic images for PAM20). Scale bar: 100um.
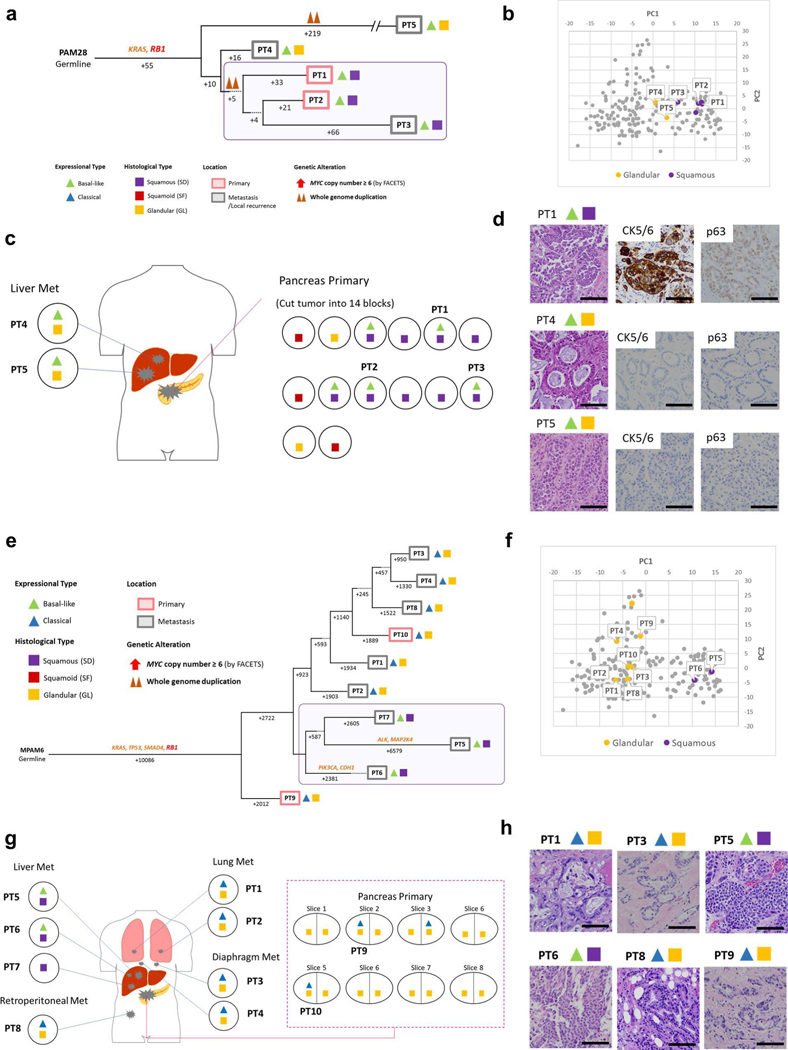
Extended Data Fig. 7 |. Integration of Transcriptomic and Morphologic Features with Phylogenetic Patterns in Pancreatic Ductal Adenocarcinoma (a)-(d) PAM28 and (e)-(h) MPAM6 with clonal RBI Mutation.
(a) Phylogenetic analysis illustrating the clonal relationship of samples analyzed in this patient. The predicted timing of somatic alterations in driver genes and whole genome duplication are shown. The mutation in RBI is in red font, all others in orange. Purple outline indicates samples that have SD based on histology (squares). Clonal driver genes are notable for an RBI somatic alteration. Samples with SD are more related to each other than to other samples in this patient, (b) Principal components analysis (214 samples from 27 patients) shows that samples PT1-PT3 with basal-like type expression and SD morphology (n = 5) are distinct from samples PT4 and PT5 that have basal-like type expression but GL morphology (n = 2) in PAM28. (c) Relationship of anatomic location to morphologic and transcriptional heterogeneity. Both GLand SF/SD were seen in the primary tumor, yet liver metastases PT4 and PT5 have GL morphology and a basal-like type expression profile, (d) Representative histologic images and immunohistochemical labeling of primary tumor sample PT1 and liver metastases PT4 and PT5 (out of total 26 histologic images for PAM28). Scale bar: 100um. (e) Clonal driver genes are notable for a deleterious RBI mutation. Samples with SD (PT5-PT7) are more related to each other than to other samples in the same patient, (f) Principal components analysis (214 samples from 27 patients) indicates distinct gene expression profiles between GL (n = 8) and SD (n = 2) samples in MPAM06. (g) Relationship of anatomic location to morphologic and transcriptional heterogeneity. SD is confined to the liver metastases (PT5-PT7). (h) Representative histologic images of the primary and multiple metastatic tumors in the same patient (out of total 62 histologic images for MPAM6). Scale bar: 100um.
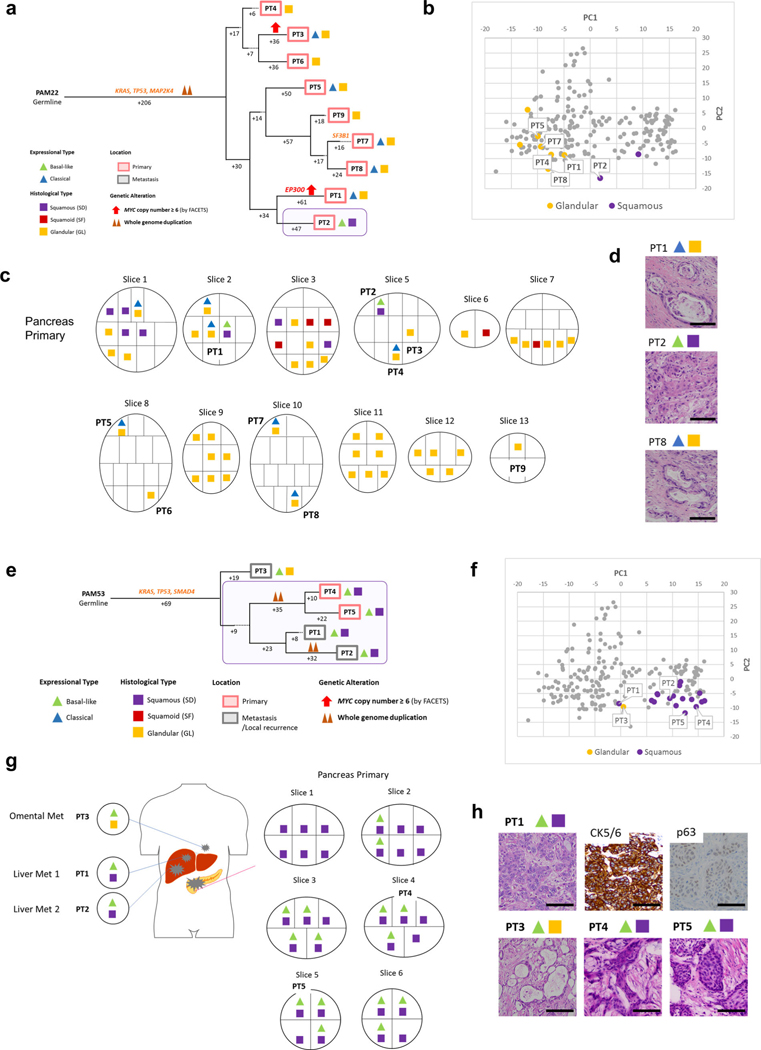
Extended Data Fig. 8 |. Integration of Transcriptomic and Morphologic Features with Phylogenetic Patterns in Pancreatic Ductal Adenocarcinoma (a)-(d) PAM22 and (e)-(h) PAM53.
(a) Phylogenetic analysis illustrating the clonal relationship of samples analyzed in this patient. Purple outline indicates samples that have SD based on RNAseq (triangles) and histology/immunohistochemistry (squares). The predicted timing of somatic alterations in driver genes, whole genome duplication and MYC amplification are also shown. SD is confined to a single sample within the multiregion sampled primary tumor (PT2). (b) Principal components analysis (214 samples from 27 patients) indicates that SD (n = 2) including PT2 show a different expression profile from all other primary tumor samples that have GL (n = 7) morphology in PAM22. (c) Relationship of anatomic location within the primary tumor to morphologic and/or transcriptional heterogeneity for SF/SD. (d) Representative histologic images of representative tumors in the same patient (out of total 50 histologic images for PAM22). Scale bar: 100um. (e) The one sample with a classical expression profile and GL (PT3) morphology forms the outgroup in the tree. Four samples with basal-like expression and SD correspond to both the primary tumor (PT4 and PT5) and metastasis (PT1 and PT2). (f) Principal components analysis (214 samples from 27 patients) indicates samples PT1 and PT3 have relatively different expression profiles from other SD samples (total 18 samples) in PAM53. (g) Relationship of anatomic location to morphologic and transcriptional heterogeneity. SD was found in one omental metastasis (PT3) which is also showed basal-like expression, (h) Representative histologic and immunohistochemical images of the primary tumor samples PT4and PT5, liver metastasis PT1 and omental metastasis PT3 (out of total 33 histologic images for PAM22). Scale bar: 100um.
Extended Data Fig. 9 |. Morphologic Features with Phylogenetic Patterns in Pancreatic Ductal Adenocarcinoma PAM32.
(a) Phylogenetic analysis illustrating the clonal relationship of samples analyzed in this patient. The predicted timing of somatic alterations in driver genes and whole genome duplication are also shown. Purple outline indicates samples that have SD based on histology and immunolabeling (squares). Samples PT3-PT6 with SD are more closely related to each other than to other samples in the same patient, (b) Relationship of anatomic location to morphologic heterogeneity. One liver metastasis (PT7, not sequenced) showed GL morphology, (c) Representative histologic images of the primary and metastatic tumors in this patient (out of total 39 histologic images for PAM32). Scale bar: 100um.
Extended Data Fig. 10 |. Molecular Characteristics in Squamous Feature and Entosis.
(a)-(d) Impact of MYC-overexpression Using PDAC Organoid Models, (a) Overexpression of MYC and alteration status of chromatin modifier genes in eight PDAC organoids. Center value and bar: mean and SD. Three data points in each organoid means technical triplicates of qPCR data, (b) Representative images of PDAC organoids (out of 8 organoids, 64 images). Images of organoids were acquired 5 days post-sorting (10 days total post-infection). No obvious morphological changes were identified between the MYC-infected vs the mock-infected organoids. Scale bar: 50um. (c) Relative mRNA expression of squamous markers (TP63, KRT5and KRT6A) after MYC overexpression. Two PDAC organoids with chromatin modifier mutations (HT160c and HT28) shows higher expression of all three markers whereas no effects are seen in the absence of mutations in these genes. Center value and bar: mean and SD. Three data points in each organoid means technical triplicates of qPCR data. **Appropriate KRT5 in HT151 signal was not detected with qPCR due to low expression, (d) Metabolic pathways are enriched in Entotic cases based on five different databases, (e) MYC expression in Entotic CIC. Winner (MYC positive)-Loser (MYC negative) pattern was identified both MYC amplified and non-amplified cases. W(P)-L(P), W(P)-L(N), W(N)-L(P) and W(N)-L(N) are Winner (MYC positive)-Loser (MYC positive), Winner (MYC positive)-Loser (MYC negative), Winner (MYC negative)-Loser (MYC positive) and Winner (MYC negative)-Loser (MYC negative) patterns respectively, (f) Representative image of Winner (positive)-Loser (negative) pattern (out of 9, 6,1 and 14 images in W(P)-L(P), W(P)-L(N), W(N)-L(P) and W(N)-L(N) patterns).
Supplementary Material
Acknowledgements
We are grateful to G. Askan, A. Yavas and J.V. Egger for assistance in identifying resected adenosquamous samples for use in this study, to S. Yamamoto for analysis tool information and to S. Oki for technical support. We gratefully acknowledge the members of the Molecular Diagnostics Service in the Department of Pathology for MSK IMPACT. This work was supported by National Institutes of Health grant nos. R01 CA179991 and R35 CA220508 to C.I.D., F31 CA180682 and 2T32 CA160001-06 to A.M.M. and CA62924 to R.H.H., the Daiichi-Sankyo Foundation of Life Science Fellowship to A.H., the Mochida Memorial Foundation for Medical and Pharmaceutical Research Fellowship to A.H., Cycle for Survival and the Marie-Josée and Henry R. Kravis Center for Molecular Oncology. MSK IMPACT was funded in part by the Marie-Josée and Henry R. Kravis Center for Molecular Oncology and the National Cancer Institute Cancer Center Core grant no. P30-CA008748.
Competing interests
D.S.K. is a consultant and equity holder to Paige.AI and a consultant to Merck Pharmaceuticals and receives royalties from UpToDate and the American Registry of Pathology.
Footnotes
Additional information
Extended data is available for this paper at https://doi.org/10.1038/s43018-019-0010-l.
Supplementary information is available for this paper at https://doi.org/10.1038/S43018-019-0010-1.
References
- 1.Kamisawa T„ Wood LD„ Itoi T. & Takaori K. Pancreatic cancer. Lancet 388, 73–85 (2016). [DOI] [PubMed] [Google Scholar]
- 2.Gillen S, Schuster T„ Meyer Zum Buschenfelde C, Friess H. & Kleeff J. Preoperative/neoadjuvant therapy in pancreatic cancer: a systematic review and meta-analysis of response and resection percentages. PLoS Med. 7, el000267 (2010). [DOI] [PMC free article] [PubMed] [Google Scholar]
- 3.Siegel R„ Miller KD & Jemal, A Cancer statistics, 2019. CA Cancer J. Clin 69, 7–34 (2019). [DOI] [PubMed] [Google Scholar]
- 4.Biankin AV et al. Pancreatic cancer genomes reveal aberrations in axon guidance pathway genes. Nature 491, 399–405 (2012). [DOI] [PMC free article] [PubMed] [Google Scholar]
- 5.Waddell N. et al. Whole genomes redefine the mutational landscape of pancreatic cancer. Nature 518, 495–501 (2015). [DOI] [PMC free article] [PubMed] [Google Scholar]
- 6.Bailey P. et al. Genomic analyses identify molecular subtypes of pancreatic cancer. Nature 531, 47–52 (2016). [DOI] [PubMed] [Google Scholar]
- 7.The Cancer Genome Atlas Research Network. Integrated genomic characterization of pancreatic ductal adenocarcinoma. Cancer CeU 32, 185–203 (2017). [DOI] [PMC free article] [PubMed] [Google Scholar]
- 8.Witkiewicz AK et al. Whole-exome sequencing of pancreatic cancer defines genetic diversity and therapeutic targets. Nat. Commun 6, 6744 (2015). [DOI] [PMC free article] [PubMed] [Google Scholar]
- 9.Wilentz RE et al. Genetic, immunohistochemical, and clinical features of medullary carcinoma of the pancreas: a newly described and characterized entity. Am. J. Pathol 156, 1641–1651 (2000). [DOI] [PMC free article] [PubMed] [Google Scholar]
- 10.Collisson EA et al. Subtypes of pancreatic ductal adenocarcinoma and their differing responses to therapy. Nat. Med 17, 500–503 (2011). [DOI] [PMC free article] [PubMed] [Google Scholar]
- 11.Moffitt RA et al. Virtual microdissection identifies distinct tumor- and stroma-specific subtypes of pancreatic ductal adenocarcinoma. Nat. Genet 47, 1168–1178 (2015). [DOI] [PMC free article] [PubMed] [Google Scholar]
- 12.Collisson EA, Bailey P, Chang DK & Biankin AV Molecular subtypes of pancreatic cancer. Nat. Rev. Gastroenterol. Hepatol 16, 207–220 (2019). [DOI] [PubMed] [Google Scholar]
- 13.McDonald OG et al. Epigenomic reprogramming during pancreatic cancer progression links anabolic glucose metabolism to distant metastasis. Nat. Genet 49, 367–376 (2017). [DOI] [PMC free article] [PubMed] [Google Scholar]
- 14.Brody JR et al. Adenosquamous carcinoma of the pancreas harbors KRAS2, DPC4 and TP53 molecular alterations similar to pancreatic ductal adenocarcinoma. Mod. Pathol 22, 651–659 (2009). [DOI] [PubMed] [Google Scholar]
- 15.Kardon DE„ Thompson LD„ Przygodzki RM & Heffess CS Adenosquamous carcinoma of the pancreas: a clinicopathologic series of 25 cases. Mod. Pathol 14, 443–451 (2001). [DOI] [PubMed] [Google Scholar]
- 16.Fukushima N. et al. In WHO Classification of Tumors 4th edn. (ed. Bosnian FTet al), 292–296 (2010). [Google Scholar]
- 17.Cheng DT et al. Memorial Sloan Kettering-integrated mutation profiling of actionable cancer targets (MSK IMPACT): a hybridization capture-based next-generation sequencing clinical assay for solid tumor molecular oncology. }. Mol. Diagn 17, 251–264 (2015). [DOI] [PMC free article] [PubMed] [Google Scholar]
- 18.Zehir A. et al. Mutational landscape of metastatic cancer revealed from prospective clinical sequencing of 10,000 patients. Nat. Med 23, 703–713 (2017). [DOI] [PMC free article] [PubMed] [Google Scholar]
- 19.Overholtzer M. et al. A nonapoptotic cell death process, entosis, that occurs by cell-in-cell invasion. Cell 131, 966–979 (2007). [DOI] [PubMed] [Google Scholar]
- 20.Mackay HL et al. Genomic instability in mutant p53 cancer cells upon entotic engulfment Nat. Commun. 9, 3070 (2018). [DOI] [PMC free article] [PubMed] [Google Scholar]
- 21.Torphy RJ et al. Stromal content is correlated with tissue site, contrast retention, and survival in pancreatic adenocarcinoma. JCO Precis. Oncol 10.1200/p0.17.00121 (2019). [DOI] [PMC free article] [PubMed] [Google Scholar]
- 22.Liu C. et al. The UPF1 RNA surveillance gene is commonly mutated in pancreatic adenosquamous carcinoma. Nat. Med 20, 596–598 (2014). [DOI] [PMC free article] [PubMed] [Google Scholar]
- 23.Andricovich J. et al. Loss of KDM6A activates super-enhancers to induce gender-specific squamous-like pancreatic cancer and confers sensitivity to BET inhibitors. Cancer Cell 33, 512–526.e518 (2018). [DOI] [PMC free article] [PubMed] [Google Scholar]
- 24.Lomberk G. et al. Distinct epigenetic landscapes underlie the pathobiology of pancreatic cancer subtypes. Nat. Commun 9, 1978 (2018). [DOI] [PMC free article] [PubMed] [Google Scholar]
- 25.Schleger C, Verbeke C, Hildenbrand R, Zentgraf H. & Bleyl U. c-MYC activation in primary and metastatic ductal adenocarcinoma of the pancreas: incidence, mechanisms, and clinical significance. Mod. Pathol 15, 462–469 (2002). [DOI] [PubMed] [Google Scholar]
- 26.Wirth M„ Mahboobi S, Kramer OH & Schneider G. Concepts to Target MYC in pancreatic cancer. Mol Cancer Ther. 15, 1792–1798 (2016). [DOI] [PubMed] [Google Scholar]
- 27.Stine ZE„ Walton ZE„ Altman BJ, Hsieh AL & Dang CV MYC, metabolism, and cancer. Cancer Discov. 5, 1024–1039 (2015). [DOI] [PMC free article] [PubMed] [Google Scholar]
- 28.Bielski CM et al. Genome doubling shapes the evolution and prognosis of advanced cancers. Nat. Genet 50, 1189–1195 (2018). [DOI] [PMC free article] [PubMed] [Google Scholar]
- 29.Iacobuzio-Donahue CA et al. Cancer biology as revealed by the research autopsy. Nat. Rev 19, 686–697 (2019). [DOI] [PMC free article] [PubMed] [Google Scholar]
- 30.Simone CG et al. Characteristics and outcomes of adenosquamous carcinoma of the pancreas. Gastroint. Cancer Res 6, 75–79 (2013). [PMC free article] [PubMed] [Google Scholar]
- 31.Yamaguchi K. & Enjoji M. Adenosquamous carcinoma of the pancreas: a clinicopathologic study. /. Surg. Oncol 47, 109–116 (1991). [DOI] [PubMed] [Google Scholar]
- 32.Gonzalez-Vasconcellos I. et al. Hie Rbl tumour suppressor gene modifies telomeric chromatin architecture by regulating TERRA expression. Sri. Rep 7, 42056 (2017). [DOI] [PMC free article] [PubMed] [Google Scholar]
- 33.Versteege I, Medjkane S, Rouillard D. & Delattre O. A key role of the hSNF5/INIl tumour suppressor in the control of the Gl-S transition of the cell cycle. Oncogene 21, 6403–6412 (2002). [DOI] [PubMed] [Google Scholar]
- 34.Mu R et al. SOX2 promotes lineage plasticity and antiandrogen resistance in TP53- and RBI-deficient prostate cancer. Science 355, 84–88 (2017). [DOI] [PMC free article] [PubMed] [Google Scholar]
- 35.Ku SY et al. Rbl and Trp53 cooperate to suppress prostate cancer lineage plasticity, metastasis, and antiandrogen resistance. Science 355, 78–83 (2017). [DOI] [PMC free article] [PubMed] [Google Scholar]
- 36.Boyd CA, Benarroch-Gampel J, Sheffield KM„ Cooksley CD & Riail TS 415 patients with adenosquamous carcinoma of the pancreas: a population-based analysis of prognosis and survival J. Surg. Res 174, 12–19 (2012). [DOI] [PMC free article] [PubMed] [Google Scholar]
- 37.Sausen M. et al. Clinical implications of genomic alterations in the tumour and circulation of pancreatic cancer patients. Nat. Commun 6, 7686 (2015). [DOI] [PMC free article] [PubMed] [Google Scholar]
- 38.Dawkins JB et al. Reduced expression of histone methyltransferases KMT2C and KMT2D correlates with improved outcome in pancreatic ductal adenocarcinoma. Cancer Res. 76, 4861–4871 (2016). [DOI] [PMC free article] [PubMed] [Google Scholar]
- 39.Sun Q. et al. Competition between human cells by entosis. Cell Res. 24, 1299–1310 (2014). [DOI] [PMC free article] [PubMed] [Google Scholar]
- 40.de la Cova C, Abril M„ Bellosta R, Gallant R & Johnston LA Drosophila myc regulates organ size by inducing cell competition. Cell 117, 107–116 (2004). [DOI] [PubMed] [Google Scholar]
- 41.Claveria C, Giovinazzo G, Sierra R. & Torres M. Myc-driven endogenous cell competition in the early mammalian embryo. Nature 500, 39–44 (2013). [DOI] [PubMed] [Google Scholar]
- 42.Hamann JC et al. Entosis is induced by glucose starvation. Cell Rep. 20, 201–210 (2017). [DOI] [PMC free article] [PubMed] [Google Scholar]
- 43.Dobin A et al. STAR: ultrafast universal RNA-seq aligner. Bioinformatics 29, 15–21 (2013). [DOI] [PMC free article] [PubMed] [Google Scholar]
- 44.Engstrom R G. et al. Systematic evaluation of spliced alignment programs for RNA-seq data. Nat. Meth 10, 1185–1191 (2013). [DOI] [PMC free article] [PubMed] [Google Scholar]
- 45.Wagner GR, Kin K. & Lynch VJ Measurement of mRNA abundance using RNA-seq data: RPKM measure is inconsistent among samples. Theor. Biosci 131, 281–285 (2012). [DOI] [PubMed] [Google Scholar]
- 46.Shannon R et al. Cytoscape: a software environment for integrated models of biomolecular interaction networks. Genome Res. 13, 2498–2504 (2003). [DOI] [PMC free article] [PubMed] [Google Scholar]
- 47.Subramanian A. et al. Gene set enrichment analysis: a knowledge-based approach for interpreting genome-wide expression profiles. Proc. Natl Acad. Sri. USA 102, 15545–15550 (2005). [DOI] [PMC free article] [PubMed] [Google Scholar]
- 48.Oki S. et al. ChIP-Atlas: a data-mining suite powered by full integration of public ChlP-seq data. EMBO Rep. 19, e46255 (2018). [DOI] [PMC free article] [PubMed] [Google Scholar]
- 49.Kuleshov MV et al. Enrichr: a comprehensive gene set enrichment analysis web server 2016 update. Nucleic Acids Res. 44, W90–W97 (2016). [DOI] [PMC free article] [PubMed] [Google Scholar]
- 50.Makohon-Moore A P. et al. Limited heterogeneity of known driver gene mutations among the metastases of individual patients with pancreatic cancer. Nat. Genet 49, 358–366 (2017). [DOI] [PMC free article] [PubMed] [Google Scholar]
- 51.Li H. & Durbin R. Fast and accurate short read alignment with BurrowsWheeler transform. Bioinformatics 25, 1754–1760 (2009). [DOI] [PMC free article] [PubMed] [Google Scholar]
- 52.DePristo MA et al. A framework for variation discovery and genotyping using next-generation DNA sequencing data. Nat. Genet 43, 491–498 (2011). [DOI] [PMC free article] [PubMed] [Google Scholar]
- 53.Mose LE„ Wilkerson MD„ Hayes DN, Perou CM & Parker JS ABRA improved coding indel detection via assembly-based realignment Bioinformatics 30, 2813–2815 (2014). [DOI] [PMC free article] [PubMed] [Google Scholar]
- 54.Cibulskis K. et al. Sensitive detection of somatic point mutations in impure and heterogeneous cancer samples. Nat. Biotechnol 31, 213–219 (2013). [DOI] [PMC free article] [PubMed] [Google Scholar]
- 55.Tokheim CJ, Papadopoulos N, Kinzler KW, Vogelstein B. & Karchin R. Evaluating the evaluation of cancer driver genes. Proc. Natl Acad. Sci. USA 113, 14330–14335 (2016). [DOI] [PMC free article] [PubMed] [Google Scholar]
- 56.Davoli T. et al. Cumulative haploinsufficiency and triplosensitivity drive aneuploidy patterns and shape the cancer genome. CeU 155, 948–962 (2013). [DOI] [PMC free article] [PubMed] [Google Scholar]
- 57.Lawrence MS et al. Mutational heterogeneity in cancer and the search for new cancer-associated genes. Nature 499, 214–218 (2013). [DOI] [PMC free article] [PubMed] [Google Scholar]
- 58.Robinson JT et al. Integrative genomics viewer. Nat. Biotechnol 29, 24–26 (2011). [DOI] [PMC free article] [PubMed] [Google Scholar]
- 59.Yachida S. et al. Clinical significance of the genetic landscape of pancreatic cancer and implications for identification of potential long-term survivors. Clin. Cancer Res 18, 6339–6347 (2012). [DOI] [PMC free article] [PubMed] [Google Scholar]
- 60.Gao J. et al. Integrative analysis of complex cancer genomics and clinical profiles using the cBioPortal Sci. Signal. 6, pH (2013). [DOI] [PMC free article] [PubMed] [Google Scholar]
- 61.Reiter JG et al. Reconstructing metastatic seeding patterns of human cancers. Nat. Commun 8, 14114 (2017). [DOI] [PMC free article] [PubMed] [Google Scholar]
- 62.Shen R. & Seshan VE FACETS: allele-specific copy number and clonal heterogeneity analysis tool for high-throughput DNA sequencing. Nucleic Acids Res. 44, el31 (2016). [DOI] [PMC free article] [PubMed] [Google Scholar]
- 63.Boj SF et al. Organoid models of human and mouse ductal pancreatic cancer. Cell 160, 324–338 (2015). [DOI] [PMC free article] [PubMed] [Google Scholar]
Associated Data
This section collects any data citations, data availability statements, or supplementary materials included in this article.
Supplementary Materials
Data Availability Statement
RNA and DNA sequence data for this study have been deposited at the European Genome-phenome Archive under accession number EGAS00001003974. Published gene sets analyzed here are available from previous papers6,10,11. Sequencing data from the MSK IMPACT cohort that were analyzed here18 are publicly available at cBioPortal (https://www.cbioportal.org/). The other human resected pancreatic cancer data were derived from TCGA Research Network: http://cancergenome.nih.gov/. The dataset derived from this resource that supports the findings of this study is available through Firebrowse (http://firebrowse.org/). Source data for Figs. 1,3,4,8 and Extended Data Figs. 2–4 and 10 have been provided as Source Data Figs. 1,3,4 and 8 and Source Data Extended Data Figs. 2–4 and 10. All other data supporting the findings of this study are available from the corresponding author upon reasonable request.


