
Figure 2. Naturally occurring insertions and deletions (InDels) in human populations.
(A) Size distributions of human InDels within different regions. (B) Log2 odds ratios for different categories of InDels. Each dot represents a transcription factor (TF) pair with corresponding spacing relationship. Mann–Whitney U test was used to compare the odds ratios between different spacing relationships. Non-significant (n.s.) if p-value is larger than 0.01.
Figure 2—source data 1. The numbers and odds ratios of different categories of insertions and deletions (InDels) at or between transcription factor (TF) binding sites.
elife-70878-fig2-data1.txt (4.7KB, txt)

Figure 2—figure supplement 1. Composition of insertions and deletions (InDels) with different allele frequency (AF) for representative transcription factor (TF) pairs.
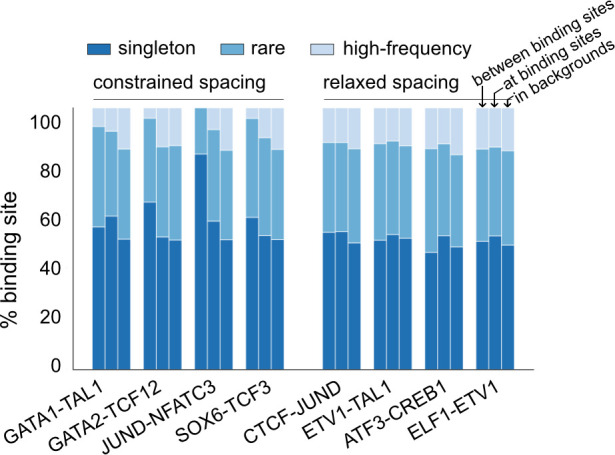
InDels were divided into high-frequency variants (AF>0.01%), rare variants (AF<0.01%, allele count [AC]>1), and singletons (AC = 1).
Figure 2—figure supplement 2. Log2 odds ratios for insertions and deletions (InDels) separately, complementary to the results of all InDels in Figure 2B.

Each dot represents a transcription factor (TF) pair. Mann–Whitney U test was used to compare the odds ratios between different spacing relationships. Non-significant (n.s.) if p-value is larger than 0.01.