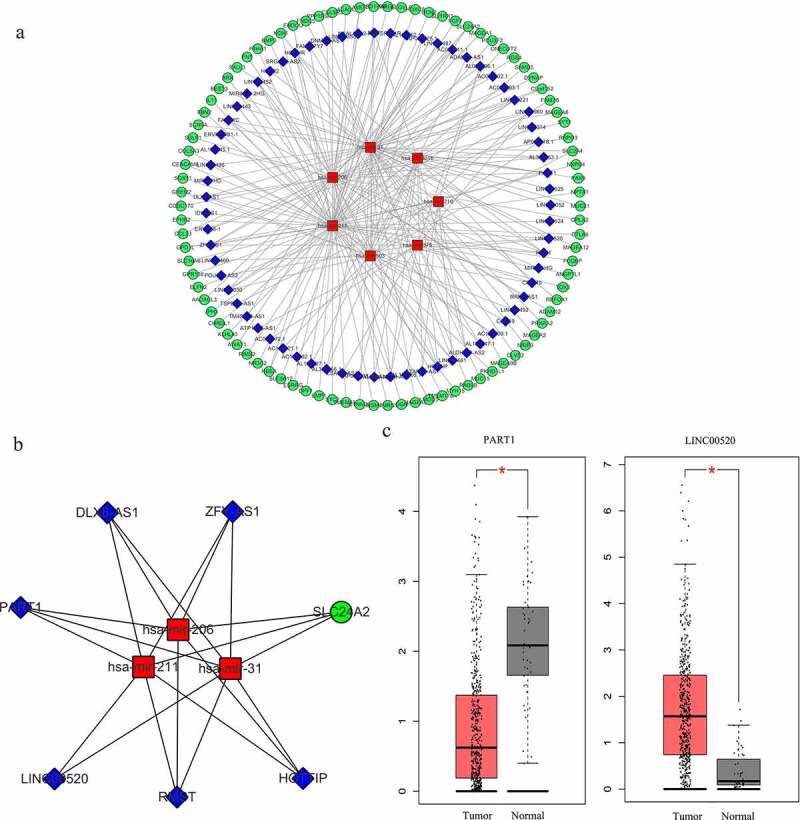
Figure 4.

Construction of the lncRNA-miRNA-mRNA interactive ceRNA networks. (a) ceRNA network in HNSCC. A total of 164 genes including 90 DEGs, 67 DELs and 7 DEMs were used to construct the ceRNA network. (b) A ceRNA subnetwork was constructed with the top 10 hub genes showing the highest MCC scores. Green, blue and red nodes represented DEGs, DELs and DEMs, respectively. An edge in the networks represented the interactive relationship between two genes. MCC, Maximal Clique Centrality. (c) The expression of lncRNA PART1 and LINC00520 in HNSCC and normal tissues (p < 0.01)
