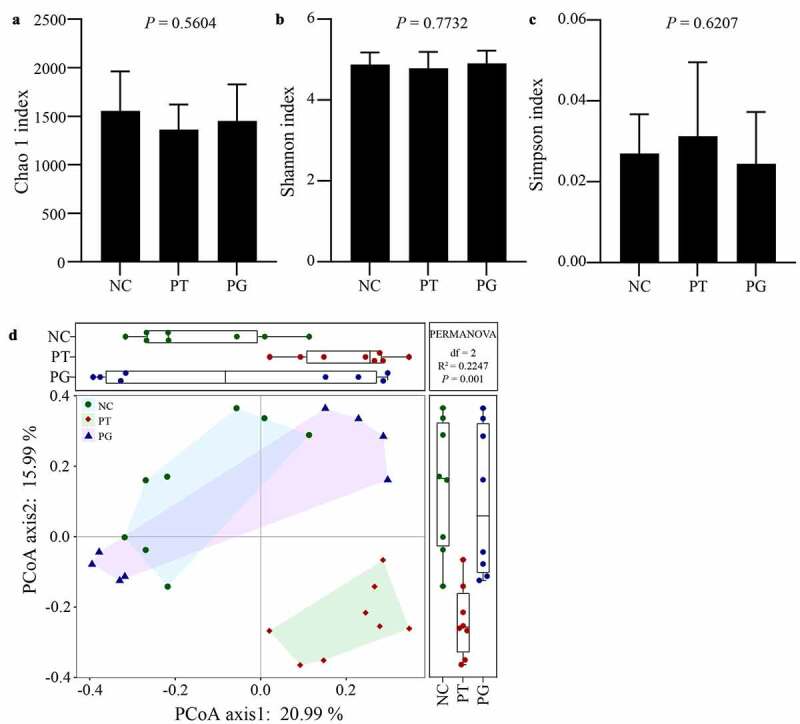
Figure 4.

Gastrodin changed the gut microbiota diversity. Alpha diversity analysis characterized by the (a) Chao1, (b) Shannon and (c) Simpson indices, respectively. (d) Beta diversity was characterized by a Braye-Curtis analysis depending on the levels of operational taxonomic units. Values are represented as mean ± standard deviation (M± SD). Different superscript letters within a column showed significant difference (P < 0.05)
