Abstract
Recently, the hospital systems face a high influx of patients generated by several events, such as seasonal flows or health crises related to epidemics (e.g., COVID’19). Despite the extent of the care demands, hospital establishments, particularly emergency departments (EDs), must admit patients for medical treatments. However, the high patient influx often increases patients’ length of stay (LOS) and leads to overcrowding problems within the EDs. To mitigate this issue, hospital managers need to predict the patient’s LOS, which is an essential indicator for assessing ED overcrowding and the use of the medical resources (allocation, planning, utilization rates). Thus, accurately predicting LOS is necessary to improve ED management. This paper proposes a deep learning-driven approach for predicting the patient LOS in ED using a generative adversarial network (GAN) model. The GAN-driven approach flexibly learns relevant information from linear and nonlinear processes without prior assumptions on data distribution and significantly enhances the prediction accuracy. Furthermore, we classified the predicted patients’ LOS according to time spent at the pediatric emergency department (PED) to further help decision-making and prevent overcrowding. The experiments were conducted on actual data obtained from the PED in Lille regional hospital center, France. The GAN model results were compared with other deep learning models, including deep belief networks, convolutional neural network, stacked auto-encoder, and four machine learning models, namely support vector regression, random forests, adaboost, and decision tree. Results testify that deep learning models are suitable for predicting patient LOS and highlight GAN’s superior performance than the other models.
Keywords: ED demands, Patient LOS, Overcrowding, Prediction, Deep learning
Introduction
Over the past decade, emergency departments (EDs) faced challenging conditions to fulfill their missions. Thus, optimally controlling and managing patient flux, risk management, and care process are needed to ensure suitable care quality. For several years, this has resulted in various strategic and operational actions in the health care sectors. However, despite the combined efforts, the EDs still suffer from numerous constraints (structural, human, material, and financial), moral crisis (Clancy 2007; Kellermann 2006) and crowding situations (Hoot and Dominik 2008; Kadri et al. 2014b; Stone et al. 2019). The EDs are often the first line providing care for patients with sudden illness and injury (Jun et al. 2011). Their activity has been steadily increasing over the last decades. For example, in France, the ED visits have been doubled during this time with +3.5% per year (Bejaoui et al. 2018). In this context, EDs often face the influx of patients generated by events and/or exceptional situations like health threats related to epidemics. Therefore, emergencies must be able to receive and manage patients’ flux that is sometimes very important for medical and surgical treatments. Hence it has become essential to predict ED activities, which is necessary for appropriate patient flows control and for optimal utilization of resources (human and material) in the ED (Bhattacharjee and Ray 2014; Chen et al. 2019; Kadri et al. 2017).
Nowadays, the hospital systems have faced the influx of patients generated by several events such as seasonal flow epidemics (e.g., influenza, colds, gastroenteritis, bronchiolitis in winter, and trauma in summer) or health crises related to epidemics (e.g., COVID’19). Therefore, hospital establishments, particularly EDs, must receive patients for medical treatments regardless of the extent of the care demands. The consequence of the patient influx often result in increasing the length of stay of patients (LOS) in EDs, which leads the overcrowding problems and strain situations within the ED ( Kadri et al. 2014a, b; Boyle et al. 2012; Visintin et al. 2019; Wachtel and Elalouf 2017). The management of ED overcrowding is one of the most critical challenges faced by many hospital establishments which require significant human and material resources (unfortunately these latter’s are limits). To overcome this issue, hospital managers must predict the patient’s LOS. This latter is considered as an essential indicator for the assessment of the ED overcrowding (Stone et al. 2019; Chung-Hsien et al. 2017).
The rapid advancement in machine learning (ML) technology has generated high opportunities in data-based applications, especially healthcare (Vijay and Bala 2018; Xue et al. 2018). In recent years, many statistical and machine learning models have been proposed to improve predictions of EDs activities (Carter and Potts 2014; Beunza et al. 2019; Stewart et al. 2018; Wason 2018; Yucesan et al. 2020). The implication of machine intelligence in healthcare can result in improved performance in wide medical applications, such as enhancing ECG signal classification and arrhythmia analysis (Kumar et al. 2020) and predicting inpatient mortality in departments of internal medicine (Schwartz et al. 2018). Importantly, machine learning models can be employed to develop intelligent medical decision support tools for clinical interpretation and analysis and enable saving time for practitioners (Abacha et al. 2015; Benbelkacem et al. 2019; Daghistani Tahani et al. 2019; Ichikawa et al. 2016; Layeghian et al. 2018). For example, in Li et al. (2013). Back-propagation (BP) neural network is applied to predict patient LOS surgery services to help the medical staff individualize patient treatment. To this end, the patient’s age, gender, patient admission conditions, and other hospitalization information are used as input features for the neural network model. Similarly, in Gentimis et al. (2017), a neural network-based model is considered to predict hospital LOS using information extracted from the patient admission, discharges, and transfer information’s with medical and laboratory information. The authors in Pendharkar and Khurana (2014) investigated three different ML techniques, namely regression tree (CART), chi-square automatic interaction detection (CHAID), and support vector regression (SVR), to predict patient LOS in Pennsylvania Federal and Specialty hospitals. In Mekhaldi et al. (2020), the authors investigated the factors influencing the patient LOS in a Hospital setting and explored random forest and the gradient boosting model for patient LOS prediction. In Awad et al. (2017), authors presented an overview of the methods and applications of LOS and mortality prediction in acute medicine and critical care units. The study in Elbattah and Molloy (2016) investigates the feasibility of machine learning in predicting the inpatient LOS and discharge destinations of hip-fracture patients using patient historical data. Results revealed that the random forests provided superior performance compared to Neural networks and Linear regression model, by reaching an overall classification accuracy of 0.88. In Bacchi et al. (2020), four models have been investigated to predict LOS and discharge destination in a hospital: the artificial neural network (ANN), the convolutional neural network (CNN), logistic regression, and random forest. Results showed that ANN excels the other models in predicting LOS and discharge destinations. In Ma et al. (2020), an approach combining just-in-time learning (JITL) with a one-class extreme learning machine (ELM) procedure is introduced for predicting the number of days a patient stays in intensive care units (ICU) in a hospital. Experiments are conducted based on physiological data of ICU patients. The JITL-ELM approach reached good prediction accuracy with an AUC of 0.8510 and outperformed traditional binary classification schemes (i.e., one-class ELM and one-class SVM). Recently, in Bacchi et al. (2020b), authors reported a review regarding LOS prediction based on machine learning methods. In He et al. (2021), the authors proposed a multi-task approach to predict LOS and classify inpatient flow simultaneously. This approach is designed based on artificial neural networks and multi-task learning (MTL) methods. Results based on data from a hospital in New York City revealed the superior performance of the multi-task approach compared to four single-task learning models.
With computer technology’s progress and the massive increase of collected data, deep learning technology showed improved performance compared to the traditional machine learning models and has progressively become a hot topic (Wang et al. 2018; Harrou et al. 2020b; Pham et al. 2017; SabaLuca et al. 2019). Deep learning methods have gained particular attention in healthcare applications because of their outstanding generalization capability and superior nonlinear approximation (Lalmuanawma et al. 2020; Xue et al. 2019; Chang et al. 2020; Harrou et al. 2018). Moreover, they enable automatic learning of relevant features from complex data (Lundervold 2019; Guo et al. 2018; Mai et al. 2019; Pham et al. 2017). For instance, in Liu et al. (2019), an iHome smart dental health—internet of things (IoT) system has been proposed using intelligent hardware, deep learning, and a mobile terminal. This study explored the possibility of dental treatment using home-based dental health care services. In Wang et al. (2020), deep learning and machine learning methods are considered in detecting Parkinson’s disease (PD) by monitoring some premotor features of PD, i.e., rapid eye movement (REM), sleep behaviour disorder (RBD), and olfactory loss. Results highlighted the superior performance of deep learning in discriminating normal individuals and patients aected by PD. In Mefraz et al. (2019), a transfer learning-based approach with intelligent training data selection has been employed for Alzheimer’s diagnosis from magnetic resonance imaging (MRI) images. In Xiaokang et al. (2020), a semisupervised deep learning-based strategy is used to improve human activity recognition on the Internet of Healthcare environments. In Yuan et al. (2018), a unified multi-view deep learning approach is proposed to detect Electroencephalogram seizure on a clinical scalp multi-channel EEG epilepsy dataset. Results demonstrate the potential advantages of deep learning for EEG seizure detection. In Harrou et al. (2020a), authors applied a particularly promising deep learning-based model called a variational autoencoder (VAE) to the problem of predicting patient admissions and flow through an emergency department in a pediatric hospital. Results show that the VAE model has a much better performance than the other models. This result is mainly due to the extended capacity of the VAE model to learn higher-level features that permit good forecasting precision. In another study (Liao et al. 2020), a deep learning-based approach is developed to assess physical rehabilitation exercises toward enhanced patient outcomes. In Kretz et al. (2020), a regression convolutional neural net (CNN) is used to estimate mammography image quality reliably. This approach is tested using data, including virtual mammography with known ground truth and real images of the contrast-detail phantom for mammography (CDMAM) phantom. It has been shown that the trained CNN can predict contrast-detail curves from single simulated and single real images of the CDMAM phantom. In Chang et al. (2019), a deep learning-based approach is employed to design an intelligent medicine recognition system. This system, called ST-Med-Box, enables recognizing drugs and delivering recognition outputs systematically and practically for chronic patients. The considered system comprises an intelligent medicine recognition device, an application implemented in an android-based mobile device, a cloud-based management platform, and a deep learning training server. Successful results were obtained by this system with a 96.6% recognition rate when applied to recognize eight different medicines. These applications of the deep learning models are examples of how deep learning can interpret and extract meaning from complicated data sets.
Recently, generative adversarial networks (GANs) have shown good efficacy in synthesizing visually appealing images (Goodfellow et al. 2014). A GAN essentially comprises two networks: the generator network and the discriminator network (Goodfellow et al. 2014). The generator attempts to learn the distribution underlying the input data and then generate new data points following the learned distribution to elude the discriminator, aiming to distinguish real data points from fake ones (Zhang et al. 2018). GANs give a promising strategy to avoid the overfitting phenomena (Creswell et al. 2018). Thereby, the GANs desirable features have been exploited in numerous applications, including text-to-image synthesis (Zhang et al. 2018), face synthesis (Di et al. 2018), and single image super-resolution (Ledig et al. 2017). Of course, GAN architecture is flexible, enabling to choose any neural network architecture as generator or discriminator resulting in a deeper model able to learn more complex features. Essentially, this study investigates the effectiveness of the GAN-based approach to anticipate overcrowding and strain situations by predicting the patient LOS at EDs, where the input data are time-series data instead of images.
In our previous work (Benbelkacem et al. 2019), supervised machine learning models, including Naive Bayes, C4.5, and SVM methods, have been applied to predict the length of stay in the PED at the Lille University Hospital. However, these models are static and cannot capture dynamics in data. In another work (Kadri and Abdennbi 2020), we investigated the performance of recurrent neural networks (RNNs), including LSTM and GRU, trained in a supervised manner to forecast patient flow in a hospital emergency department. Recently, in Harrou et al. (2021), we combine the advantages of the autoregressive-moving-average (ARMA) model with the detection capacity of the generalized likelihood ratio (GLR) scheme to detect abnormal high patient influx in an ED. Results revealed the superior performance of this coupled monitoring scheme compared to the conventional charts (e.g., Shewhart chart and an exponentially weighted moving average chart). This work aims to develop an unsupervised predictive approach, based on GAN deep learning models, for predicting patient LOS at an emergency department. As we know, this is the first study presenting an unsupervised deep learning model for patient LOS prediction. Overall, the contributions of this paper are three-fold:
Firstly, this study introduces an effective prediction approach based on a deep learning-driven GAN model. This is the first study introducing the GAN-based model to effectively forecast patient LOS in ED to the best of the author’s knowledge. This choice is motivated by the flexibility of GAN architecture, which enables selecting any neural network architecture as a generator or discriminator, resulting in a deeper model to learn more complex features. Furthermore, the GAN-driven approach flexibly can learn relevant information from linear and nonlinear processes without prior assumptions on data distribution and significantly enhances the prediction accuracy. Crucially, the GAN-driven method is trained in an unsupervised manner. A predictor layer has been amalgamated in the GAN as the output layer to perform LOS prediction.
Moreover, we classified the predicted patients’ LOS according to time spent at the PED to further help decision-making and prevent overcrowding. The presented classes are manually established and validated based on the expertise and knowledge of pediatric medical experts.
Thirdly, this study compared the prediction performance of the proposed GAN-driven approach with other deep learning models, including deep belief networks (DBN) (Hinton Geoffrey et al. 2006), convolutional neural network (CNN) (LeCun et al. 1998), stacked auto-encoder (SAE) (Vincent et al. 2010), and support vector regression (SVR) (Awad and Khanna 2015), random forests (RF), AdaBoost, and decision tree (DT). Here, DBN and an SAE for comparison purposes, which are unsupervised and generative deep learning models. We used DBN and an SAE for comparison purposes, which are unsupervised and generative deep learning models. In addition, we used a powerful deep learning model widely used, namely CNN. Also, four efficient machine learning models, namely SVR, RF, DT, and AdaBoost, are incorporated in the comparison.
The GAN-based LOS prediction performance has been assessed via an actual database collected from the pediatric emergency department (PED) in Lille regional hospital center, France. It has been shown that the proposed GAN-based predictor achieves better prediction accuracy performance than other investigated models.
The remaining sections of the paper are organized as follows. Section 2 provides a brief presentation of the GAN model, how it can be applied to predict patient LOS in EDs, and presents the used metrics of effectiveness. Section 3 presents the used dataset, the statistical data analysis, and discusses the results of applying the proposed approach to the data collected from the pediatric emergency department of Lille (France). Section 4 reviews the main points discussed in this work and concludes the study.
Methodology
The proposed deep learning-driven prediction approach in this paper aims to predict the patient LOS in EDs. This section introduces firstly an overview of the GAN model and how it is used. Then presents the deep learning-driven patient LOS prediction procedure.
Generative adversarial networks
GANs are effective deep learning models that can learn complex data representations and capture data distributions without any need for labeling (i.e., in an unsupervised manner) (Creswell et al. 2018; Lin et al. 2018). Specifically, GANs are formed of two neural networks (called generator and discriminator) arranged in an adversarial way in competition with each other. The composite architecture of GAN is inspired from the game theory (two-person zero-sum games), where the gain of one person is the loss of the other making the sum zero. The two persons participating in the game are representing a generator and a discriminator. During the training, GAN attempts to learn the statistical distribution of the training dataset through high-dimensional distributions modeling based on two deep learning models, the generator and the discriminator .
The following steps describe the role of the generator and the discriminator.
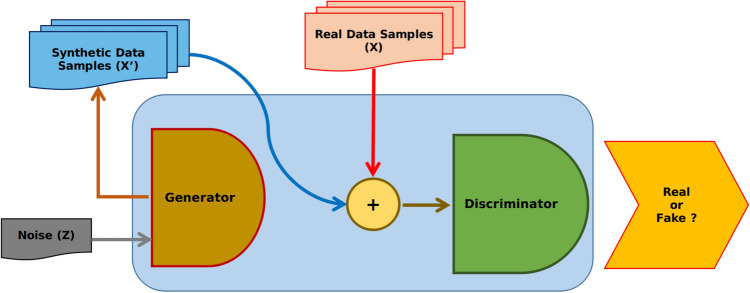
The Generator model produces synthetic data (called fake data) and introduces noise to make realistic samples. To do that, it learns to capture the probability distribution of the training and generate new data samples.
The Discriminator model input is the fake and real data and aims to determine whether the input data is from the actual data or the generator (Fig. 1).
Both models are driven by adversarial competition to enhance further the quality of the fake data generated, which becomes progressively comparable to real data (training data).
The optimum is reached until an equilibrium between the two models is found: achieving superior discriminative capacity and suitability mimics the fake data with approximatively identical distribution to the real data.
The real data distribution is represented by the probability density function . The distribution of the data produced by the generator (fake) is denoted by , while z represents noise vector obtained from the given distribution uniform distribution is usually used in this case. The discriminator function parameterized by , which are updated during the training based on the loss function defined as follow:
| 1 |
With the generator function parameterized by . The minimizing is done through the maximization of and minimization . The training objective of is to derive the generated probability distribution closest to the true data distribution , during the training phase, the distribution is used to draw a batch of samples to feed , that will produce a new outputs, where the outputs is constrained to generate data that meet the statistical distribution of (ie:. more realistic data generated). The parameters of are updates with the respect to the loss function defined as follow:
| 2 |
GAN training optimize a value function , which is built based on the two loss functions and in order to form a two-player minimax game:
| 3 |
The Eq. (4) denotes the stochastic gradient used by the discriminator to update its parameters during the training phase:
| 4 |
While the second Eq. (5) is used by the generator to update the model parameter based on a descending stochastic gradient
| 5 |
The discriminator D function convergence is expressed in the Eq. (6), Where the training data distribution is denoted by , while represents the learned distribution.
| 6 |
Indeed GAN is trained by alternately updating the generator’s parameters and a discriminator based on the batch (a subset sampled from the training dataset). For the prediction problems, the adversarial training strategy achieved promising performance, even-though if GAN was designed for computer vision problems.
Fig. 1.
GAN architecture
In summary, the training of the GAN model, which is composed of generative and discriminative models, is performed using an unsupervised learning approach by alternately optimizing the generative and discriminative models (Goodfellow et al. 2014). The training objective is to learn the LOS data distribution approximation through learning to generate samples that resemble the LOS data points. After completing the training, the discriminator is used for the rest of the study since the role of the generator is to help the discriminator to distinguish between true and fake (noisy) data; so at the end of the training, the discriminator output constitutes a features ma or space that provide a compact continuous representation of the input data (LOS variables). Note that this study aims to predict LOS time series data based on the GAN model. Thus, the output layer of the discriminator should provide a vector of real values (i.e., LOS predictions). In particular, the last layer of the GAN model serves as a predictor layer. The proposed models should produce a single output representing the LOS; for this reason, we added a mapping layer that we call a predictor (Figs. 2, 3). It should be noted that the discriminator and the predictor training are done via supervised learning to learn the mapping between the observed LOS variables and the LOS value.
Fig. 2.
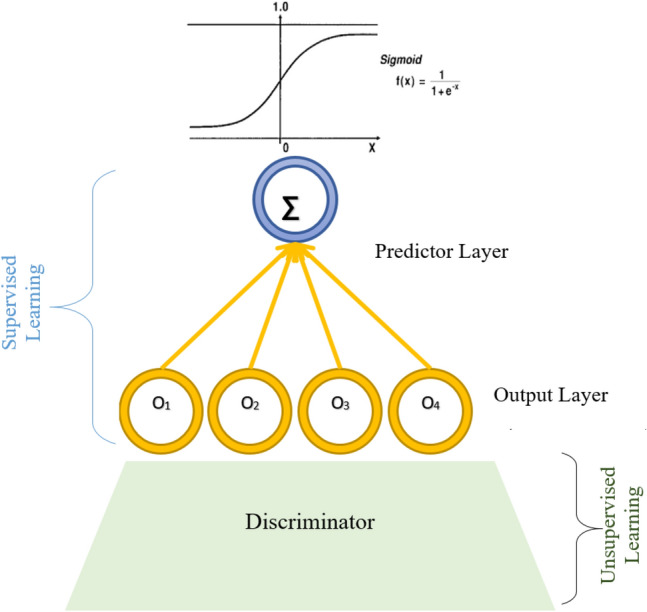
Illustration of the GAN predictor layer
Fig. 3.
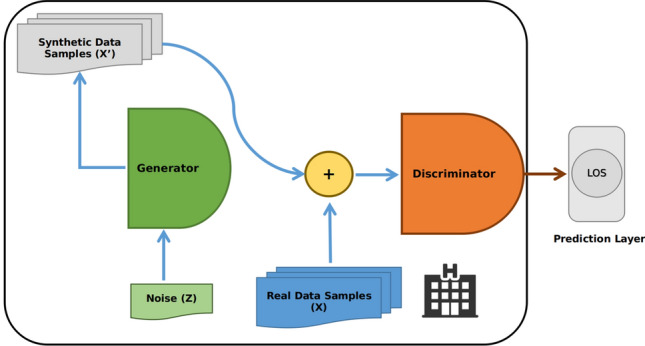
Schematic illustration of GAN-driven predictor
Building GAN prediction model
Here, we propose a deep generative approach for LOS prediction, called GAN Predictor (GAN-P), which was proposed initially to deal with computer vision problems like image classification (Fig. 3). Indeed we adapt it to perform a prediction of LOS time-series based on a set of input variables. Essentially, the main objective of GAN is to learn the probability distribution of the underlining training dataset, which represents a mapping between given patient cases and the time spent waiting before leaving. The learning procedure is divided into two stages; first, unsupervised training is established to approximate the probability distribution based on dual models, namely generator and discriminator, which learn to gather in an adversarial way to learn and discover features reconstruct them with an objective to minimize the reconstruction error.
While the second stage consists of fine-tuning the discriminator model parameters. Specifically, fine-tuning aims to adjust and optimize the already trained parameters to reach the global optimum. Moreover, a predictor layer is added in this stage to complete the whole architecture; initially, the predictor is randomly initialized and optimized during the fine-tuning step to learn how to map a given observation to its LOS. This why we called the proposed approach GAN-P.
Evaluation metrics
In this study, we assess the accuracy of the prediction models using six commonly used metrics: coefficient of determination (R2), Root mean square error (RMSE), mean absolute percentage error (MAPE), mean absolute error (MAE), explained variance (EV), and root mean squared log error (RMSLE).
| 7 |
| 8 |
| 9 |
| 10 |
| 11 |
where is the patient’s LOS, is its correspond-ing forecasted LOS, and n is the number of data points. Lower RMSE, MAE, MAPE, and RMSLE values and higher EV and R2 would imply better precision and prediction quality.
The proposed forecasting framework
The flowchart of the proposed LOS forecasting framework is depicted in Fig. 4. The recorded LOS time-series datasets are first preprocessed and then used to train deep learning and machine learning models. Importantly, to improve data quality, outliers are discarded, and missing values are imputed (Wu et al. 2020). Handling missing values and outlier detection are essential steps in the data preparation process (Wu and Luo 2020). Outliers are distinct from typical samples in quantity and quality in a given dataset. Hence, outliers are usually removed to increase the performance of a forecasting method (Wu et al. 2019; Liu et al. 2008). On the other hand, to improve data quality, numerous techniques have been reported in the literature to impute missing values and appropriately predict missing data, including k-nearest neighbors and Random Forest regressor (Wu et al. 2021; Aydilek and Arslan 2012).
Fig. 4.
Deep learning-driven LOS forecasting procedure
In this study, we normalize the LOS data, , by min-max normalization within the interval [0, 1].
| 12 |
where and denotes the minimum and maximum of the LOS data, respectively. Note that we allied a reverse procedure after the forecasting process.
Here, we adopted the GAN-driven forecasting approach and compared its performance with three deep learning models (i.e., DBN, CNN, and SAE) and four machine learning models (i.e., SVR, DT, RF, and AdaBoost) to forecast LOS time-series data recorded in a pediatric emergency department. Toward this end, we split the normalized data into training and testing sub-datasets. Firstly, the forecast models are established using a training set, and the parameters of each model are computed. For GAN and DBN, a new layer having only single output is incorporated for forecasting purposes. The whole structure of each model is trained for optimizing its parameters to get suitable performance. For instance, the training in the coupled GAN and forecaster layer is performed in an unsupervised way. At first, the first layer is trained, and the latent variables at every layer are employed as the input for training the following layer. After this greedy layer-wise training, supervised fine-tuning is employed to tune weight matrices and bias of the network to minimize the loss function. Essentially, the crucial role of fine-tuning is adjusting the network parameters to minimize information losses. After that, we evaluate the forecasting performance of each model using testing data. The quality of each model is jugged in terms of six statistical metrics: R2, RMSE, MAPE, MAE, EV, and RMSLE.
Results and discussion
Data source: presentation of the pediatric emergency department (PED)
A daily patient visit data set recorded from the PED in CHRU-Lille is used to assess the considered methods. The Lille hospital serves about four million residents in Nord-Pas-de-Calais in France, and its PED admits, on average, 23,900 demands yearly.
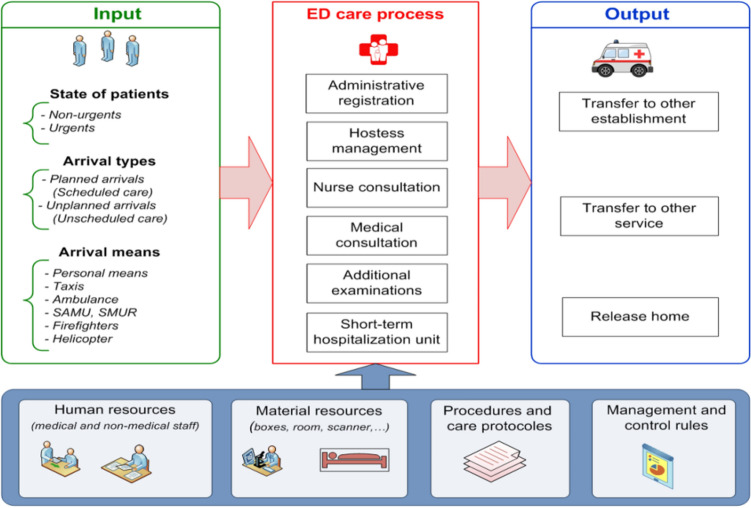
The patient care process within PED begins when the patient arrives and ends when the patient exits the PED (Fig. 5). The general process of patient management at the PED in CHRU-L is characterised by the following parameters:
input of the care process.
output of the care process.
resources (human and material resources).
procedures and care protocols.
management and control rules.
ED care process.
When the patient does not present a vital emergency, he rst goes through the administrative registration. Then he will be supported by the hostess before starting the nurse and medical consultations. If the patient presents a vital emergency, he will be directly admitted to a vital emergency room without administrative registration (in general, the administrative registration is after the treatment).
Fig. 5.
Schematic illustration of the general procedure performed for managing patient in the PED (Kadri and Abdennbi 2020)
According to the interviews conducted with the PED medical staff, by taking into account the patient’s state of emergency upon arrival at the PED (critical state or not) and the need or not for additional examinations, we identified, we established a dynamic model of care process in the PED (see Fig. 6).
Fig. 6.
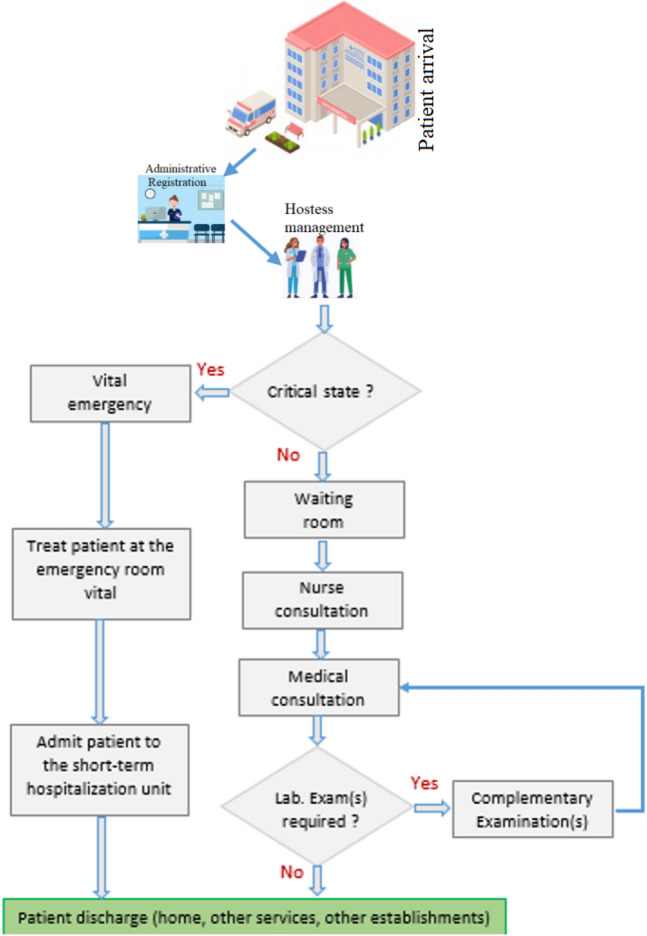
Stages of care process according to the type of patient admitted to the PED
Data pre-processing and data analysis
This study utilized a dataset extracted from the PED database at CHRU-L from January 1, 2011, to December 31, 2012. This dataset includes 44 676 patients. Each patient is assigned a length of stay at the PED, . Each patient is described by 12 descriptors . The meaning and description of the attributes are given in Table 1.
Table 1.
description and dignification of features
| Feature | Name | Type | Description |
|---|---|---|---|
| X1 | Arrival date | Date | Date of patient arrival at the PED (yyyy,mm,dd) |
| X2 | Arrival time | Hour | Hour of patient arrival at the PED (hh:mm:ss) |
| X3 | String | Arrival mean | Arrival mean of patients at the PED (personal, fireman, mobile emergency) |
| X4 | Numeric | Age of patient | Age of patients (in months) |
| X5 | String | Sex of patient | Sex of patients (M = boy, F = girl) |
| X6 | String | Main diagnostic | Diagnostic of patient |
| X7 | String | GEMSA | Multicentric Emergency Department Study Group (GEMSA 1–6) |
| X8 | String | CCMU | Clinical classification of emergency patients (CCMU 1–5, D and P) |
| X9 | Boolean | Biology | If the patient had a biology test |
| X10 | Boolean | Echography | If the patient had an echography |
| X11 | Boolean | Radiology | If the patient had a radiology |
| X12 | Boolean | Scanner | If the patient had a scanner |
| Y | Numeric | LOS | Length of stay at pediatric ED |
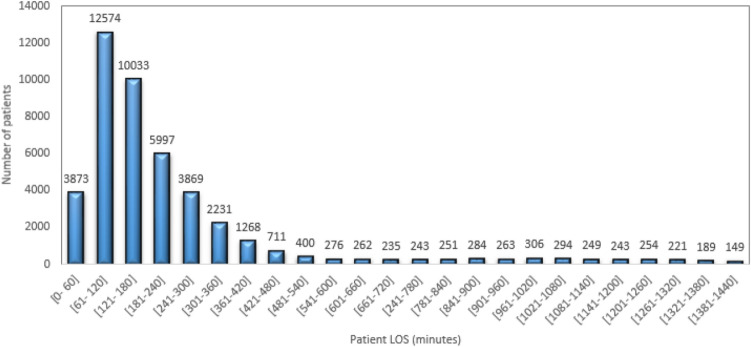
Figure 7 presents the repartition of the patient length of stay (LOS) at the PED for the whole studied period. From Fig. 7, more than 28% of patients who arrived at the PED have LOS between [1–2] h, and 22.46%, 13.42%, and 8.66% of patients have a LOS between [2–3] h, [3–4], and [4–5] h respectively.
Fig. 7.
Repartition of the patient’s length of stay at the PED
To help decision-making and prevent overcrowding situations within the PED, we have defined and classified patients according to their length of stay (LOS). With the help of the medical staff, we defined the patient LOS as the time between when the patient completes their administrative registration at the PED and their discharge (departure) from the PED; we also proposed five classes of patient LOS. The proposed classes of patient LOS were validated by the pediatric medical staff and defined as follow:
Class C1 (LOS 120 min): represents the very short LOS.
Class C2 (120 min < LOS 210 min): represents the short LOS.
Class C3 (210 min < LOS 300 min): represents the average LOS.
Class C4 (300 min <LOS 480 min): represents the long LOS.
Class C5 (LOS > 480 min): represents the very long LOS.
The six groups of the GEMSA classification developed by the Multicentric Emergency Department Study Group are summarized in Table 2. Each group is associated with a type of patient (Afilal et al. 2016; Kadri et al. 2014b). The classification criteria is established according to the patient’s entry and exit mode and the planned or unplanned care activity. This classification provides information on the arrival of patients, which requires significant and prolonged care (Afilal et al. 2016; Kadri et al. 2014b). According to Table 2, more than 81% of patients arriving at the PED are unplanned (GEMSA2). In general, these patients return to their homes after taking the needed care. The GMESA4 group represents unexpected arrivals (10.614 %), and most of these patients are hospitalized after emergency treatment, which increases their length of stay.
Table 2.
GEMSA groups description and distribution for the studied period (2011–2012)
| GEMSA groups | Description | Distribution (%) |
|---|---|---|
| GEMSA 1 | Patient deceased on arrival or before any intensive care | 0.002 |
| GEMSA 2 | Unexpected arrival, return home after the urgent care | 81.963 |
| GEMSA 3 | Expected arrival, return home after emergency care | 5.325 |
| GEMSA 4 | Unexpected arrival, hospitalized after treatment emergency | 10.614 |
| GEMSA 5 | Expected arrival, hospitalized after treatment emergency | 2.050 |
| GEMSA 6 | Unexpected arrival, patient requiring immediate or prolonged care | 0.045 |
The clinical classification of patients in an ED (CCMU) is viewed as coding that assesses the patient’s condition in the ED, his level of severity, and his medical prognosis. Table 3 presents the classification and the distribution of patients treated at the PED level for the whole studied period (2011–2012). We note that patients classified CCMU2 represent the majority of patients admitted to the PED (more than 62% ), then patients classified CCMU1 with more than 31%. These patients presented a non-urgent state, and they all returned home after the medical cares.
Table 3.
CCMU groups description and distribution for the studied period (2011–2012)
| CCMU classification | Description | Distribution (%) |
|---|---|---|
| CCMU 1 | Stable clinical state, no necessary complementary diagnostic act | 31.691 |
| CCMU 2 | Lesion state/functional prognosis stable. no expectation or appropriate service is predictable | 62.220 |
| CCMU 3 | Lesion state/functional prognosis which may worsen in the emergency service | 5.289 |
| CCMU 4 | Pathological situation involving the vital prognosis without immediate resuscitation procedures | 0.334 |
| CCMU 5 | Vital prognosis engaged, care management is immediate | 0.090 |
| CCMU D | Patient already died on arrival at emergency department | 0.060 |
| CCMU P | Psychiatric state and absence of any associated unstable somatic pathology | 0.049 |
According to the studied period data, a patient may be required to have additional examinations depending on its state severity. The five types of complementary examinations are presented in Table 4. This Table shows that more than 66% of patients admitted to the PED have undergone medical imaging, and more than 23% and 19% undergo respectively radiology and biology examinations. These data allow us to explain the patient’s LOS at the PED.
Table 4.
Distribution of patients according to additional examinations for the studied period (2011–2012)
| Additional examinations | Distribution (%) |
|---|---|
| Imaging | 66.948 |
| Echography | 5.450 |
| Scanner | 1.981 |
| Radiology | 23.846 |
| Biology | 19.496 |
According to data analysis and PED staff, we identified new features from the raw data summarized in Table 1. The new deduced features are presented in Table 5. Note that we did not apply any features selection algorithms identifying these new features.
Period of year: The period of the year has an influence on the LOS and especially the epidemic period that takes place between November and March (see Fig. 8. Three different periods were be distinguished. We also add the Month of the year as a new variable that may be used as a new descriptor variable.
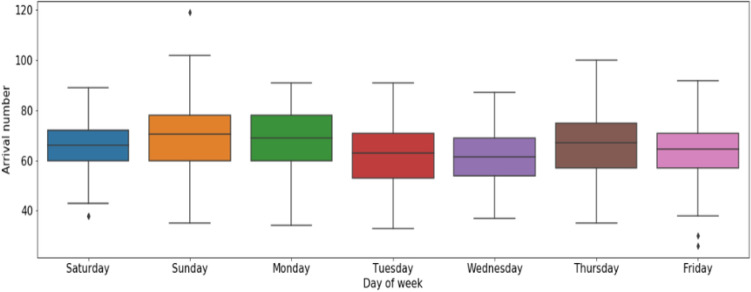
Day of week: patient arrival number varies according to the day of the week. Figure 9 presents the box plots of the patient arrivals by day of the week for the two studied years. We remarked that Sunday accounts for the highest number of arrivals at the PED, followed by Monday, Saturday, and Thursday.
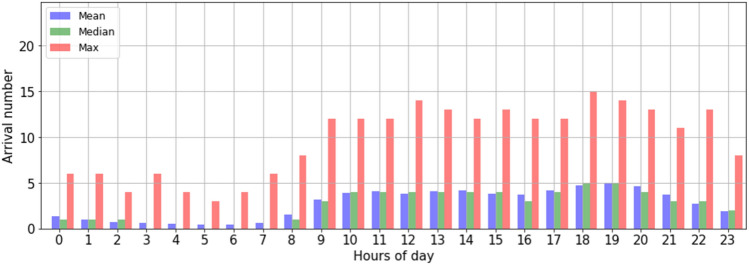
Period of day: The data analysis on the arrival number by day shows that the number of patient arrivals varies according to the hours of the day (in general, the number of patient arrivals is low between [0–7 am]. From [8 am to 7 pm], the number of arrivals increases gradually (see Fig. 10). From this analysis, three separate daily periods were deduced.
Table 5.
New deduced features
| Feature | Name | Type | Description |
|---|---|---|---|
| X13 | Period of year | String | Period 1: January to June |
| Period 2: July to September | |||
| Period 3: October to December | |||
| X14 | Month of year | String | Patient arrival per month of year |
| X15 | Day of week | String | Patient arrival per day of week |
| X16 | Period of day | String | Night [0–7 h] |
| Morning [7–19 h] | |||
| Evening [19–23 h] |
Fig. 8.
Patient arrival at the PED by month of year
Fig. 9.
Distribution of PED visits time-series by day of the week
Fig. 10.
Descriptive statistics (mean, median and max) of hourly PED visit time-series in the daytime
Building and validation models for patient LOS prediction
Before starting the training process, the dataset is arranged to meet the mapping , where and observation vector and its mapping represented by the LOS, meaning that Y is the corresponding LOS. We evaluate the performance of the proposed GAN-P against three deep learning models (i.e., CNN, DBN, and SAE) and four machine learning models (i.e., SVR, DT, RF, and AdaBoost). Table 6 presents the model parameters obtained in the training phase using the grid search approach. Note that DBN and SAES are trained using the same way as the proposed approach, using two steps unsupervised first to learn the training data distribution, and then a predictor layer is added to the model, where the whole architecture is fine-tuned based on supervised training to learn the LOS mapping. However, CNN is trained in a supervised way to learn the LOS mapping through nonlinear transformations aiming to extract features building a feature space that helps to learn this mapping. Furthermore, SVR is a supervised machine learning model based on a statistical approach to perform a nonlinear regression that maps statistical features to the corresponding LOS value.
Table 6.
Signification and description of model parameters
| Model | Parameters | Batch size | Epoch | Loss function | Optimizer |
|---|---|---|---|---|---|
| SVR | kernel=’rbf’,C=1.0,epsilon=0.15 | ||||
| DT | kernel=’max_depth=5 | ||||
| RF | n_estimators=5,max_depth=5 | ||||
| AdaBoost | n_estimators=50,learning_rate=1,loss=’linear’ | ||||
| CNN | Layers: 5, config:10,Conv(32), Conv(32), Maxpool, 1 | 250 | 200 | Cross entropy | Rmsprop |
| SAES | Layers: 5, config:10,32,32,31,1 | 250 | 200 | Cross entropy | Rmsprop |
| DBN | Layers: 3, config:10,16,1 | 250 | 200 | Cross entropy | Rmsprop |
| GAN | Layers: 5, config:10,16,1,1,16 | 250 | 200 | Cross entropy | Rmsprop |
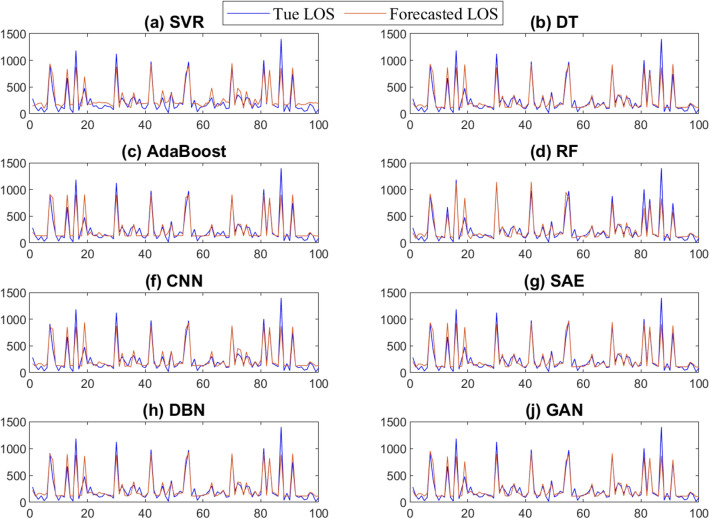
Forecasting results from the trained models using the testing are depicted in Fig. 11. From Fig. 11, we observe that these models can follow the trend of the patient LOS time series. Figure 12 depicts the boxplots of the prediction errors of each model based on testing LOS data. The prediction errors represent the mismatch separating the recorded and forecasted patient’s LOS from the trained models. In fact, in comparing boxplots, wider distribution is characterized by a large box with large ranges. In contrast, small and compact boxes with a central line (median) nearby zero reveal that prediction error is small. We observe that SVR and CNN have the largest errors, as indicated by the width of the central box and whiskers of the boxplots of the prediction errors of these two methods. The GAN and SAE models have compressed box plots with relatively narrower interquartile intervals and whiskers, and prediction errors are tightly fluctuating around zero. Visually, one can see that the GAN reaches superior LOS prediction(i.e., having the shortest boxes with a median around zero) compared to the other models.
Fig. 11.
Forecasting results obtained by the considered methods
Fig. 12.
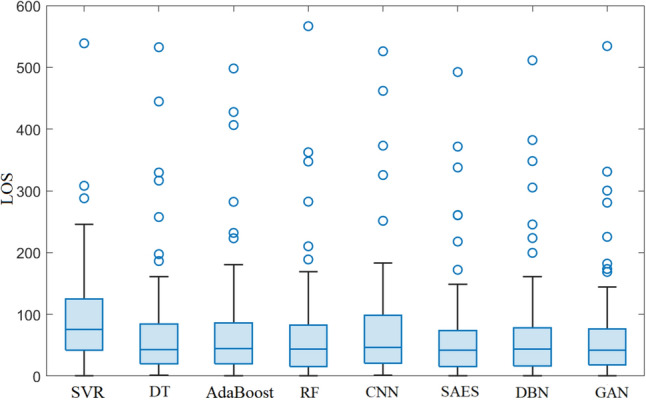
Boxplot of forecasting errors obtained by the considered methods
Table 7 illustrates the prediction results of the proposed approach GAN-P and the other investigated models. The evaluation is based on statistical metrics such as RMSE, MAE, R2, EV, MDAE, and MLSE. Results show that GAN-P has recorded the lowest prediction error measured by (RMSE, MAE) around (100.309, 61.722) and MDAE of 37.322. While GAN-P is maximizing the fitting score (how well did the model fit the input) denoted by R2 and EV of , on the other hand, we have MLSE that shows how bad did the model has performed the prediction, as we can see GAN-P has recorded the lowest value of 0.272.
Table 7.
Validation measures applied to patient LOS prediction
| MODEL | RMSE | MAE | R2 | EV | MDAE | MLSE |
|---|---|---|---|---|---|---|
| SVR | 118.22 | 91.115 | 0.821 | 0.843 | 75.751 | 0.495 |
| DT | 108.576 | 67.047 | 0.849 | 0.85 | 42.52 | 0.302 |
| AdaBoost | 109.912 | 69.841 | 0.846 | 0.846 | 44.516 | 0.33 |
| RF | 107.478 | 67.12 | 0.852 | 0.853 | 43.491 | 0.305 |
| CNN | 113.414 | 73.432 | 0.836 | 0.837 | 45.905 | 0.324 |
| SAES | 101.359 | 63.048 | 0.869 | 0.869 | 42.151 | 0.278 |
| DBN | 105.257 | 65.181 | 0.858 | 0.859 | 43.281 | 0.298 |
| GAN-P | 100.309 | 61.722 | 0.871 | 0.872 | 37.322 | 0.272 |
Bold values indicate the best approach
Firstly, deep learning models have outperformed the baseline approaches (i.e., SVR, DT, RF, and Adaboost). This could be attributed to the efficiency of deep learning models are efficient to learn deep information embed in time-series data. Results also demonstrate the robustness of the proposed approach again another generative model, namely DBN and SAE, which are trained in the same way. Furthermore, GAN-P has demonstrated its superiority compared to the deep 1D CNN. The proposed approach achieves superior performance due to its learning procedure based on duality and adversarial architecture, using two deep learning models to accurately capture complex features and models.
Figure 13 displays the results of the prediction LOS values for 100 patients when using the GAN-based model. Results indicate that the GAN-P model achieved a good prediction of the five patient LOS classes presented in Sect. 3.2. This information is crucial for PED managers to better prepare for managing each class. According to this study, the developed GAN-P model has a good prediction ability and can be used to predict the patient LOS at the PED.
Fig. 13.
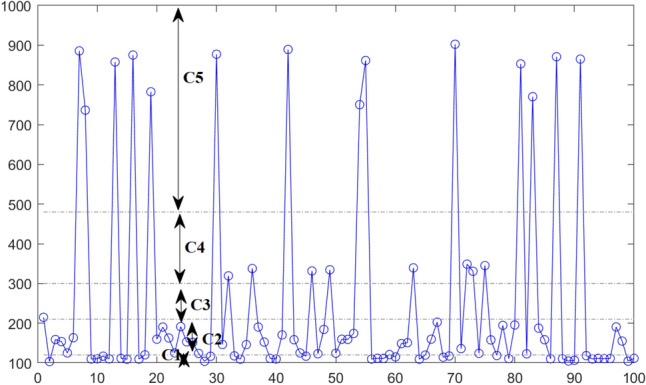
Prediction of patient LOS at the PED using GAN-based model
Conclusion
The prediction of LOS at the pediatric emergency department (PED) in Lille hospital, France, was studied using a deep learning framework. Predictions of LOS in emergency departments can help ED managers effectively manage human and material resources within their establishments and efficiently increase the quality of patient care. Therefore, predicting the ED patient length of stay is essential in controlling and managing health resources.
Firstly, this paper reports developing a deep learning-driven approach for predicting the patient LOS in EDs using a generative adversarial network (GAN) model. Secondly, the GAN model was used to predict the patient LOS at the pediatric emergency department (PED) in Lille regional hospital center, France. The experiments were carried out on an actual database collected from the PED. The GAN model results were compared with other deep learning models (SAES, DBN, and CNN) and four machine learning models (i.e., SVR, DT, RF, and AdaBoost). The results clearly show the promising performance of these deep learning models in predicting patient LOS and emphasize the GAN’s better performance compared to the other models.
However, this study raises several questions about the patient LOS prediction within EDs; predicting patient LOS on more refined LOS classes and time scales would be very interesting. We could also improve these predictions by taking into account the real state of the ED at each new patient arrival, by using other internal explanatory features, such as occupancy rate of resources, waiting time for nurse and medical consultation, waiting time for additional examinations, and the number of patient transfers, and external explanatory features, such as epidemic and meteorological events. To this end, all explanatory features that take into account the internal and external information of EDs must be taken in designing strategies aimed at avoiding overcrowding that may lead to severe strain situations in these establishments.
Acknowledgements
This publication is based upon work supported by King Abdullah University of Science and Technology (KAUST), Office of Sponsored Research (OSR) under Award No: OSR-2019-CRG7-3800.
Footnotes
Publisher's Note
Springer Nature remains neutral with regard to jurisdictional claims in published maps and institutional affiliations.
Farid Kadri, Abdelkader Dairi, Fouzi Harrou and Ying Sun have contributed equally to this work.
Contributor Information
Farid Kadri, Email: farid.kadri@soprasteria.com.
Fouzi Harrou, Email: fouzi.harrou@kaust.edu.sa.
Ying Sun, Email: ying.sun@kaust.edu.sa.
References
- Abacha AB, Faisal CM, Mahbub KA, Yassine M, Alberto L, Pierre Z. Text mining for pharmacovigilance: using machine learning for drug name recognition and drug-drug interaction extraction and classification. J Biomed Inform. 2015;58:122–132. doi: 10.1016/j.jbi.2015.09.015. [DOI] [PubMed] [Google Scholar]
- Afilal M, Yalaoui F, Dugardin F, Amodeo L, Laplanche D, Blua P. Forecasting the emergency department patients flow. J Med Syst. 2016;40(7):1–18. doi: 10.1007/s10916-016-0527-0. [DOI] [PubMed] [Google Scholar]
- Awad M, Khanna R. Support vector regression in efficient learning machines. Berkeley: Apress; 2015. pp. 67–80. [Google Scholar]
- Awad A, Bader-El-Den M, McNicholas J. Patient length of stay and mortality prediction: a survey. Health Serv Manag Res. 2017;30(2):105–120. doi: 10.1177/0951484817696212. [DOI] [PubMed] [Google Scholar]
- Aydilek IB, Arslan A. A novel hybrid approach to estimating missing values in databases using k-nearest neighbors and neural networks. Int J Innov Comput Inf Control. 2012;7(8):4705–4717. [Google Scholar]
- Bacchi S, Samuel G, Yiran T, Ivana C, Joy C, Toby G, Menon David K, Jim J, Timothy K, Simon K. Prediction of general medical admission length of stay with natural language processing and deep learning: a pilot study. Int Emerg Med. 2020;15(6):989–995. doi: 10.1007/s11739-019-02265-3. [DOI] [PubMed] [Google Scholar]
- Bacchi S, Tan Y, Oakden-Rayner L, Jannes J, Kleinig T, Koblar S (2020b) Machine learning in the prediction of medical inpatient length of stay. Int Med J [DOI] [PubMed]
- Bejaoui M, Bergonzoni A, Boisguérin B, Boussaïd N, Dahmouh A, Dennevault C, Mauro L, Morin S, Pereira E, de Peretti C et al (2018) Les établissements de santé: édition 2018
- Benbelkacem S, Kadri F, Atmani B, Chaabane S. Machine learning for emergency department management. Int J Inf Syst Serv Sector (IJISSS) 2019;11(3):19–36. doi: 10.4018/IJISSS.2019070102. [DOI] [Google Scholar]
- Beunza J-J, Enrique P, Ester G-O, Gema V, Emilia C, Gergana K, Cristian H, Landecho Manuel F. Comparison of machine learning algorithms for clinical event prediction (risk of coronary heart disease) J Biomed Inform. 2019;97:103257. doi: 10.1016/j.jbi.2019.103257. [DOI] [PubMed] [Google Scholar]
- Bhattacharjee P, Ray PK. Patient flow modelling and performance analysis of healthcare delivery processes in hospitals: a review and reflections. Comput Ind Eng. 2014;78:299–312. doi: 10.1016/j.cie.2014.04.016. [DOI] [Google Scholar]
- Boyle A, Beniuk K, Higginson I, Atkinson P (2012) Emergency department crowding: time for interventions and policy evaluations. Emerg Med Int 2012 [DOI] [PMC free article] [PubMed]
- Carter EM, Potts HWW. Predicting length of stay from an electronic patient record system: a primary total knee replacement example. BMC Med Inform Decis Mak. 2014;14(1):26. doi: 10.1186/1472-6947-14-26. [DOI] [PMC free article] [PubMed] [Google Scholar]
- Chang W-J, Chen L-B, Hsu C-H, Lin C-P, Yang T-C. A deep learning-based intelligent medicine recognition system for chronic patients. IEEE Access. 2019;7:44441–44458. doi: 10.1109/ACCESS.2019.2908843. [DOI] [Google Scholar]
- Chang W-J, Chen L-B, Chen M-C, Chiu Y-C, Lin J-Y. ScalpEye: a deep learning-based scalp hair inspection and diagnosis system for scalp health. IEEE Access. 2020;8:134826–134837. doi: 10.1109/ACCESS.2020.3010847. [DOI] [Google Scholar]
- Chen Y, Kaiming B, Wu C-HJ, David B-A. A new evidence-based optimal control in healthcare delivery: a better clinical treatment management for septic patients. Comput Ind Eng. 2019;137:106010. doi: 10.1016/j.cie.2019.106010. [DOI] [Google Scholar]
- Chung-Hsien C, Hsiu-Hsi C, Shu-Hui C, Petrus T, Shin-Liang P, Ming-Fang YA, Te-Fa C. Predicting length of stay among patients discharged from the emergency department-using an accelerated failure time model. PLoS One. 2017;12(1):e0165756. doi: 10.1371/journal.pone.0165756. [DOI] [PMC free article] [PubMed] [Google Scholar]
- Clancy CM (2007) Emergency departments in crisis: opportunities for research. Health Serv Res 42(1 Pt 1):xiii [DOI] [PMC free article] [PubMed]
- Creswell A, Tom W, Vincent D, Kai A, Biswa S, Bharath Anil A. Generative adversarial networks: an overview. IEEE Signal Process Mag. 2018;35(1):53–65. doi: 10.1109/MSP.2017.2765202. [DOI] [Google Scholar]
- Daghistani Tahani A, Radwa E, Sherif S, Ahmed Amjad M, Abdullah AT, Al-Mallah Mouaz H. Predictors of in-hospital length of stay among cardiac patients: a machine learning approach. Int J Cardiol. 2019;288:140–147. doi: 10.1016/j.ijcard.2019.01.046. [DOI] [PubMed] [Google Scholar]
- Di X, Zhang H, Patel VM (2018) Polarimetric thermal to visible face verification via attribute preserved synthesis. In: 2018 IEEE 9th international conference on biometrics theory, applications and systems (BTAS). IEEE, pp 1–10
- Elbattah M, Molloy O (2016)Using machine learning to predict length of stay and discharge destination for hip-fracture patients. In: Proceedings of SAI intelligent systems conference. Springer, pp 207–217
- Gentimis T, Alnaser AJ, Durante A, Cook K, Steele R (2017) Predicting hospital length of stay using neural networks on mimic iii data. In: 2017 IEEE 15th intl conf on dependable, autonomic and secure computing, 15th intl conf on pervasive intelligence and computing, 3rd intl conf on big data intelligence and computing and cyber science and technology congress (DASC/PiCom/DataCom/CyberSciTech). IEEE, pp 1194–1201
- Goodfellow IJ, Pouget-Abadie J, Mirza M, Xu B, Warde-Farley D, Ozair S, Courville A, Bengio Y (2014) Generative adversarial networks. arXiv:1406.2661
- Guo Z, Zhou K, Zhang X, Yang S. A deep learning model for short-term power load and probability density forecasting. Energy. 2018;160:1186–1200. doi: 10.1016/j.energy.2018.07.090. [DOI] [Google Scholar]
- Harrou F, Dairi A, Sun Y, Kadri F. Detecting abnormal ozone measurements with a deep learning-based strategy. IEEE Sens J. 2018;18(17):7222–7232. doi: 10.1109/JSEN.2018.2852001. [DOI] [Google Scholar]
- Harrou F, Dairi A, Kadri F, Sun Y. Forecasting emergency department overcrowding: a deep learning framework. Chaos Solitons. 2020;139:110247. doi: 10.1016/j.chaos.2020.110247. [DOI] [PMC free article] [PubMed] [Google Scholar]
- Harrou F, Sun Y, Hering AS, Madakyaru M et al (2020b) Statistical process monitoring using advanced data-driven and deep learning approaches: theory and practical applications. Elsevier
- Harrou F, Kadri F, Sun Y, Khadraoui S. Monitoring patient flow in a hospital emergency department: arma-based nonparametric glrt scheme. Health Inform J. 2021;27(2):14604582211021648. doi: 10.1177/14604582211021649. [DOI] [PubMed] [Google Scholar]
- He L, Chalil MS, Greg S, Khasawneh Mohammad T. Neural network-based multi-task learning for inpatient flow classification and length of stay prediction. Appl Soft Comput. 2021;108:107483. doi: 10.1016/j.asoc.2021.107483. [DOI] [Google Scholar]
- Hinton Geoffrey E, Simon O, Yee-Whye T. A fast learning algorithm for deep belief nets. Neural Comput. 2006;18(7):1527–1554. doi: 10.1162/neco.2006.18.7.1527. [DOI] [PubMed] [Google Scholar]
- Hoot NR, Dominik A. Systematic review of emergency department crowding: causes, effects, and solutions. Ann Emerg Med. 2008;52(2):126–136. doi: 10.1016/j.annemergmed.2008.03.014. [DOI] [PMC free article] [PubMed] [Google Scholar]
- Ichikawa D, Saito T, Ujita W, Oyama H. How can machine-learning methods assist in virtual screening for hyperuricemia? A healthcare machine-learning approach. J Biomed Inform. 2016;64:20–24. doi: 10.1016/j.jbi.2016.09.012. [DOI] [PubMed] [Google Scholar]
- Jun H, Xiang-yu H, Sam T, Patrick Jennifer R, Fitz GG. Demand for hospital emergency departments: a conceptual understanding. World J Emerg Med. 2011;2(4):253. doi: 10.5847/wjem.j.1920-8642.2011.04.002. [DOI] [PMC free article] [PubMed] [Google Scholar]
- Kadri F, Abdennbi K. Rnn-based deep-learning approach to forecasting hospital system demands: application to an emergency department. Int J Data Sci. 2020;5(1):1–25. doi: 10.1504/IJDS.2020.109497. [DOI] [Google Scholar]
- Kadri F, Chaabane S, Tahon C. A simulation-based decision support system to prevent and predict strain situations in emergency department systems. Simul Model Pract Theory. 2014;42:32–52. doi: 10.1016/j.simpat.2013.12.004. [DOI] [Google Scholar]
- Kadri F, Harrou F, Chaabane S, Tahon C. Time series modelling and forecasting of emergency department overcrowding. J Med Syst. 2014;38(9):1–20. doi: 10.1007/s10916-014-0107-0. [DOI] [PubMed] [Google Scholar]
- Kadri F, Harrou F, Sun Y (2017) A multivariate time series approach to forecasting daily attendances at hospital emergency department. In: 2017 IEEE symposium series on computational intelligence (SSCI). IEEE, pp 1–6
- Kellermann AL. Crisis in the emergency department. N Engl J Med. 2006;355(13):1300. doi: 10.1056/NEJMp068194. [DOI] [PubMed] [Google Scholar]
- Kretz T, Müller K-R, Schaeffter T, Elster C (2020) Mammography image quality assurance using deep learning. IEEE Trans Biomed Eng [DOI] [PubMed]
- Lalmuanawma S, Hussain J, Chhakchhuak L. Applications of machine learning and artificial intelligence for covid-19 (sars-cov-2) pandemic: a review. Chaos Solitons Fractals. 2020;139:110059. doi: 10.1016/j.chaos.2020.110059. [DOI] [PMC free article] [PubMed] [Google Scholar]
- Layeghian JS, Mehdi SM, Hassan A. Toward analyzing and synthesizing previous research in early prediction of cardiac arrest using machine learning based on a multi-layered integrative framework. J Biomed Inform. 2018;88:70–89. doi: 10.1016/j.jbi.2018.10.008. [DOI] [PubMed] [Google Scholar]
- LeCun Y, Bottou L, Bengio Y, Haffner P. Gradient-based learning applied to document recognition. Proc IEEE. 1998;86(11):2278–2324. doi: 10.1109/5.726791. [DOI] [Google Scholar]
- Ledig C, Theis L, Huszár F, Caballero J, Cunningham An, Acosta A, Aitken A, Tejani A, Totz J, Wang Z et al (2017) Photo-realistic single image super-resolution using a generative adversarial network. In: Proceedings of the IEEE conference on computer vision and pattern recognition, pp 4681–4690
- Li J-S, Tian Y, Liu Y-F, Shu T, Liang M-H (2013) Applying a BP neural network model to predict the length of hospital stay. In: International conference on health information science. Springer, pp 18–29
- Liao Y, Vakanski A, Xian M. A deep learning framework for assessing physical rehabilitation exercises. IEEE Trans Neural Syst Rehabil Eng. 2020;28(2):468–477. doi: 10.1109/TNSRE.2020.2966249. [DOI] [PMC free article] [PubMed] [Google Scholar]
- Liu FT, Ting KM, Zhou Z-H (2008) Isolation forest. In: 2008 eighth IEEE international conference on data mining. IEEE, pp 413–422
- Liu L, Jiawei X, Huan Y, Zou Z, Yeh S-C, Zheng L-R. A smart dental health-iot platform based on intelligent hardware, deep learning, and mobile terminal. IEEE J Biomed Health Inform. 2019;24(3):898–906. doi: 10.1109/JBHI.2019.2919916. [DOI] [PubMed] [Google Scholar]
- Lundervold AS. An overview of deep learning in medical imaging focusing on MRI. Z Med Phys. 2019;29(2):102–127. doi: 10.1016/j.zemedi.2018.11.002. [DOI] [PubMed] [Google Scholar]
- Ma X, Si Y, Wang Z, Wang Y. Length of stay prediction for icu patients using individualized single classification algorithm. Comput Methods Programs Biomed. 2020;186:105224. doi: 10.1016/j.cmpb.2019.105224. [DOI] [PubMed] [Google Scholar]
- Mai F, Tian S, Lee C, Ma L. Deep learning models for bankruptcy prediction using textual disclosures. Eur J Oper Res. 2019;274(2):743–758. doi: 10.1016/j.ejor.2018.10.024. [DOI] [Google Scholar]
- Mefraz KN, Nabila A, Marcia H. Transfer learning with intelligent training data selection for prediction of Alzheimer’s disease. IEEE Access. 2019;7:72726–72735. doi: 10.1109/ACCESS.2019.2920448. [DOI] [Google Scholar]
- Mekhaldi RN, Caulier P, Chaabane S, Chraibi A, Piechowiak S (2020)Using machine learning models to predict the length of stay in a hospital setting. In: World conference on information systems and technologies. Springer, pp 202–211
- Pendharkar PC, Khurana H (2014) Machine learning techniques for predicting hospital length of stay in Pennsylvania federal and specialty hospitals. Int J Comput Sci Appl 11(3)
- Pham T, Tran T, Phung D, Venkatesh S. Predicting healthcare trajectories from medical records: a deep learning approach. J Biomed Inform. 2017;69:218–229. doi: 10.1016/j.jbi.2017.04.001. [DOI] [PubMed] [Google Scholar]
- Saba L, Biswas M, Venkatanareshbabu K, Cuadrado GE, Suri HS, Reddy ED, Tomaž O, Laird JR, Khanna NN, Sophie M, et al. The present and future of deep learning in radiology. Eur J Radiol. 2019;114:14–24. doi: 10.1016/j.ejrad.2019.02.038. [DOI] [PubMed] [Google Scholar]
- Sangaiah AK, Maheswari A, Gui-Bin B. An intelligent learning approach for improving ecg signal classification and arrhythmia analysis. Artif Intell Med. 2020;103:101788. doi: 10.1016/j.artmed.2019.101788. [DOI] [PubMed] [Google Scholar]
- Schwartz N, Sakhnini A, Bisharat N. Predictive modeling of inpatient mortality in departments of internal medicine. Int Emerg Med. 2018;13(2):205–211. doi: 10.1007/s11739-017-1784-8. [DOI] [PubMed] [Google Scholar]
- Stewart J, Sprivulis P, Dwivedi G. Artificial intelligence and machine learning in emergency medicine. Emerg Med Australas. 2018;30(6):870–874. doi: 10.1111/1742-6723.13145. [DOI] [PubMed] [Google Scholar]
- Stone K, Zwiggelaar R, Jones P, Parthaláin NM (2019) Predicting hospital length of stay for accident and emergency admissions. In: UK workshop on computational intelligence. Springer, pp 283–295
- Vijay K, Bala D. Data science: concepts and practice. Burlington: Morgan Kaufmann; 2018. [Google Scholar]
- Vincent P, Larochelle H, Lajoie I, Bengio Y, Manzagol P-A, Bottou L (2010)Stacked denoising autoencoders: Learning useful representations in a deep network with a local denoising criterion. J Mach Learn Res 11(12)
- Visintin F, Caprara C, Puggelli F. Experimental design and simulation applied to a paediatric emergency department: a case study. Comput Ind Eng. 2019;128:755–781. doi: 10.1016/j.cie.2019.01.019. [DOI] [Google Scholar]
- Wachtel G, Elalouf A. Using the “floating patients” method to balance crowding between the hospital emergency department and other departments. Comput Ind Eng. 2017;110:289–296. doi: 10.1016/j.cie.2017.06.023. [DOI] [Google Scholar]
- Wang P, Jiang A, Liu X, Shang J, Zhang L. Lstm-based eeg classification in motor imagery tasks. IEEE Trans Neural Syst Rehabil Eng. 2018;26(11):2086–2095. doi: 10.1109/TNSRE.2018.2876129. [DOI] [PubMed] [Google Scholar]
- Wang W, Lee J, Harrou F, Sun Y. Early detection of Parkinson’s disease using deep learning and machine learning. IEEE Access. 2020;8:147635–147646. doi: 10.1109/ACCESS.2020.3016062. [DOI] [Google Scholar]
- Wason R. Deep learning: evolution and expansion. Cogn Syst Res. 2018;52:701–708. doi: 10.1016/j.cogsys.2018.08.023. [DOI] [Google Scholar]
- Wu D, Luo X. Robust latent factor analysis for precise representation of high-dimensional and sparse data. IEEE/CAA J Autom Sin. 2020;8(4):796–805. doi: 10.1109/JAS.2020.1003533. [DOI] [Google Scholar]
- Wu D, Luo X, Shang M, He Y, Wang Gu, Zhou M (2019) A deep latent factor model for high-dimensional and sparse matrices in recommender systems. IEEE Trans Syst Man Cybern Syst
- Wu D, Luo X, Shang M, He Y, Wang G, Wu X (2020) A data-characteristic-aware latent factor model for web services qos prediction. IEEE Trans Knowl Data Eng
- Wu D, Shang M, Luo X, Wang Z (2021) An l-and-l-norm-oriented latent factor model for recommender systems. IEEE Trans Neural Netw Learn Syst [DOI] [PubMed]
- Xiaokang Z, Wei L, Kevin I, Kai W, Hao W, Yang Laurence T, Qun J. Deep learning enhanced human activity recognition for internet of healthcare things. IEEE Internet Things J. 2020;7(7):6429–6438. doi: 10.1109/JIOT.2020.2985082. [DOI] [Google Scholar]
- Xue W, Li Q, Xue Q. Text detection and recognition for images of medical laboratory reports with a deep learning approach. IEEE Access. 2019;8:407–416. doi: 10.1109/ACCESS.2019.2961964. [DOI] [Google Scholar]
- Xue Y, Liang H, Norbury J, Gillis R, Killingworth B. Predicting the risk of acute care readmissions among rehabilitation inpatients: a machine learning approach. J Biomed Inform. 2018;86:143–148. doi: 10.1016/j.jbi.2018.09.009. [DOI] [PubMed] [Google Scholar]
- Yuan Y, Xun G, Jia K, Zhang A. A multi-view deep learning framework for eeg seizure detection. IEEE J Biomed Health Inform. 2018;23(1):83–94. doi: 10.1109/JBHI.2018.2871678. [DOI] [PubMed] [Google Scholar]
- Yucesan M, Mete S, Serin F, Celik E, Gul M (2020) NARX neural networks model for forecasting daily patient arrivals in the emergency department. In: Computational intelligence and soft computing applications in healthcare management science. IGI Global, pp 1–18
- Zhang Z, Xie Y, Yang L (2018) Photographic text-to-image synthesis with a hierarchically-nested adversarial network. In: Proceedings of the IEEE conference on computer vision and pattern recognition, pp 6199–6208
- Zhu L, Yushi C, Pedram G, Atli BJ. Generative adversarial networks for hyperspectral image classification. IEEE Trans Geosci Remote Sens. 2018;56(9):5046–5063. doi: 10.1109/TGRS.2018.2805286. [DOI] [Google Scholar]


