

Abstract
MicroRNAs (miRNAs) may modulate more than 60% of human coding genes and act as negative regulators, while long non-coding RNAs (lncRNAs) regulate gene expression on multiple levels by interacting with chromatin, functional proteins, and RNAs such as mRNAs and microRNAs. However, the crosstalk between HOTTIP lncRNA and miRNAs in leukemogenesis remains elusive. Using combined integrated analyses of global miRNA expression profiling and state-of-the-art genomic analyses of chromatin such as ChIRP-seq (HOTTIP binding in genome-wide), ChIP-seq, and ATAC-seq, we found that some miRNA genes are directly controlled by HOTTIP. Specifically, the HOX cluster miRNAs (miR-196a, miR-196b, miR-10a and miR-10b), located cis & trans, were most dramatically regulated and significantly decreased in HOTTIP−/− AML cells. HOTTIP bound to the miR-196b promoter, and HOTTIP deletion reduced chromatin accessibility and enrichment of active histone modifications at HOX cluster associated miRNAs in AML cells, while reactivation of HOTTIP restored miR gene expression and chromatin accessibility in the CTCF-boundary-attenuated AML cells. Inactivation of HOTTIP or miR-196b promotes apoptosis by altering the chromatin signature at the FAS promoter and increasing FAS expression. Transplantation of miR-196b knockdown MOLM13 cells in NSG mice increased overall survival of mice compared to wild-type cells transplanted into mice. Thus, HOTTIP remodels the chromatin architecture around miRNAs to promote their transcription, and consequently represses tumor suppressors and promotes leukemogenesis.
Keywords: Long non-coding RNA, micro-RNA, Epigenetics, FAS signaling, Leukemia
Introduction
Non-coding RNAs are emerging as important regulators of gene expression in multiple cellular processes, especially in cancer [1]. Long non-coding RNAs (lncRNAs) are involved in regulating chromatin dynamics, gene expression, cell growth, differentiation, and development [2]. Overexpression of HOXA9 is a dominant factor driving certain subtypes of human acute myeloid leukemia (AML) [3]. Moreover, the aberrant activation of posterior HOXA gene, HOXA9, and its cofactor, MEIS1, following a variety of genetic alterations, including MLL-translocations, NUP98-fusion, CDX dysregulation, and monocytic leukemia zinc-finger fusion, was associated with poor prognosis and treatment response [4]. The regulatory mechanisms controlling expression of posterior HOXA genes remain obscure. Importantly, a treasure trove of transcribed sense and antisense noncoding RNAs exist at HOX gene locus, including Hotair, Hottip, Hobbit, Halr1, Hotdog, miR10, and miR196 [5]. LncRNAs regulate transcription through recruiting histone modifiers and chromatin remodeling factors that play active roles in various aspects of development and disease states [6–11]. We showed that aberrantly activated HOTTIP alters HOXA-driven topologically associated domains (TADs) and gene expression [12]. The lncRNA HOTTIP, located at the posterior end of HOXA gene cluster, acts as a scaffold to recruit the WDR5-MLL-complex to the promoters of posterior HOXA genes and positively regulates their expression in normal hematopoiesis and AML leukemogenesis [6, 12]. In contrast, loss of HOTTIP strongly inhibits posterior (HOXA9-HOXA13) compared to anterior HOXA gene expression (e.g., HOXA1-HOXA7) [12]. Moreover, Hottip aberration in mice leads to AML-like disease by altering HSC self-renewal and homeotic/hematopoietic gene-associated chromatin signatures and transcription programs [12]. Thus, HOTTIP functions as an oncogenic driver gene perturbing HSC function by reprogramming leukemia-associated chromatin and gene transcription.
HOTTIP provides a basis for transcriptional activation and three-dimensional (3D) chromatin organization in the 5’ HOXA gene locus by acting downstream of the CBS7/9 boundary (CTCF binding site located between HOXA7 and HOXA9) [12]. Depleting HOTTIP reduces active histone marks (H3K4me3 and H3K79me2) and enhances repressive histone marks (H3K27me3) resulting in a switch from an active to a repressive chromatin state in the promoter region of the 5’ HOXA genes in MOLM13 cells [12]. Genome-wide binding analysis of HOTTIP lncRNA using chromatin isolation by RNA purification combining deep sequencing (ChIRP-seq) revealed that HOTTIP directly regulates its target genes through cis and trans binding at HOXA9–13, RUNX1 and MEIS1 genes. Consequently, HOTTIP also binds in cis and trans regulatory patterns at non-coding regions and certain annotated genes involved in chromatin organization, hematopoiesis, myeloid cell differentiation, cell-cycle progression, and JAK-STAT and WNT signaling pathways. These findings suggested that HOTTIP lncRNA might control gene expression by interacting with and regulating non-coding regulatory elements such as microRNAs (miRNAs) in cis and trans [12].
Growing evidence indicates that non-coding RNAs, particularly lncRNAs and miRNAs, regulate one another and cooperate to influence the levels of target mRNAs in a cell-type specific manner [13]. LncRNAs process, interact with, and regulate miRNAs at both transcriptional and post-transcriptional levels [14]. LncRNAs can function as miRNA sponges, acting as decoys to impair the functional interaction of a miRNA and its target mRNA, thereby preventing suppression of gene expression [15]. Additionally, lncRNAs can be precursors of miRNAs and regulate miRNA biogenesis at different points. Primary miRNAs (pri-miRNAs) are transcribed in the genome (i) either within the body of another gene and often their expression is linked to the expression of the parent transcript, or (ii) from independent miRNA genes, similar to mRNA, where transcription is primarily controlled by RNA polymerase II-driven promoters [16]. However, the molecular mechanisms, particularly those mediated by lncRNA HOTTIP, regulating miRNAs transcription remains elusive.
MicroRNAs (miRNAs) are class of 20–22 nucleotide non-coding epigenetic controllers that negatively regulate gene expression, either by repressing translation or by promoting mRNA decay, via binding at complementary seed sequences mainly located at the mRNA 3’ UTR regions [17]. Growing evidence supports that miRNA might have essential roles in hematopoiesis and leukemogenesis [18]. Widespread dysregulation of certain miRNAs is associated with hematological malignancies, including acute myeloid leukemia (AML) [19], and controls leukemic and tumor suppressor gene expression [18]. Importantly, miR-10 family members (miR-10a and miR-10b) are positioned between the group 4 and 5 paralogous genes in the HOXB and HOXD clusters. This family regulates HOX genes both in cis and trans, and major signaling pathways (WNT, FGFs and NOTCH) are key non-HOX targets of the miR-10 family [20–23]. Because HOX genes also regulate these signaling pathways [24–27], the miR-10 family have feedforward regulatory inputs into HOX gene regulatory networks [5].
Three miR-196 family members, miR-196b, miR-196a-1, and miR-196a-2, are present in both the mouse and human HOXA, HOXB, and HOXC clusters. HOXA9 and its neighboring non-coding RNAs miR-196b and HOTTIP are aberrantly activated in AML and their gene expression correlates [12, 28]. miR-196b, which is located adjacent to HOXA9, targets HOXA9 and its cofactor MEIS1 [28]. miR-196b also targets proapoptotic factor FAS [29], suggesting a double-edged sword function that could simultaneously repress both the oncogenic and tumor suppressor target genes. This evidence implies that integration of miRNAs in HOX clusters provides another layer of gene regulation that plays a role in development and disease such as leukemia. Recent studies have shown the importance of miR-196b in AML [28]; however, the mechanism of its transcriptional regulation remains unknown in AML. Thus, in this study we characterize the mechanisms by which HOTTIP controls the expression and function of HOXA9 and FAS through regulating the transcription of miR-196b in human AML cells.
Results
HOTTIP lncRNA differentially regulates microRNAs in AML
The aberrant activation and function of both HOTTIP and miR-196b establish their role in AML. However, key information about the functional and regulatory intervened networks of HOTTIP-miRNA196b-mRNA in AML remains unknown. To identify miRNAs that are directly targeted by HOTTIP, small-RNA-sequencing (smRNA-seq) was performed in wild-type (WT) and HOTTIP−/− MOLM13 AML cells (Fig. 1A). Differential expression analysis shows that a total 569 miRNAs changed more than 2-fold in HOTTIP−/− cells compared to WT cells, including 333 down-regulated miRNAs and 236 upregulated miRNAs (Fig. 1B, C). Gene ontology (GO) analysis revealed that HOTTIP-regulated miRNAs were involved in many biological processes including the metabolic process, regulation of gene expression, transcription, and RNA processing (Fig. 1D). Collectively, these altered miRNAs in HOTTIP−/− cells play vital roles in molecular and cellular processes, including hematopoiesis and leukemogenesis, suggesting that HOTTIP controls AML pathogenesis by regulating miRNAs.
Fig. 1. LncRNA-HOTTIP regulates miRNAs target genes control leukemogenic program in AML cells.

(A) Principal component analysis (PCA) of the miRNAs differentially expressed in HOTTIP−/− vs WT AML cells. (B) Heatmap of miRNAs changed >2-fold up- and down upon HOTTIP−/− by small-RNA sequencing (smRNA-seq). (C) Pie chart shows the up- and down regulated miRNAs compared WT with HOTTIP−/− MOLM13 cells. (D) GO (Gene Ontology) analysis of miRNAs differentially expressed in HOTTIP−/− cells. (E) Overlapping of target genes regulated by either miRNAs or HOTTIP. (F) Part of overlapping targets co-regulated by both HOTTIP-associated miRNAs and HOTTIP itself in AML.
Next, we sought to determine whether HOTTIP-regulated miRNAs control the expression of HOTTIP-regulated mRNAs. In silico analysis revealed that HOTTIP-regulated miRNAs are predicted to directly target 4704 mRNAs. Furthermore, we compared these with 1219 mRNAs that we previously demonstrated are transcriptionally regulated by HOTTIP [12]. Strikingly, 357 genes are co-regulated by both HOTTIP-associated miRNAs and HOTTIP itself in AML, including hematopoietic and leukemic signature genes like HOXA factors (e.g., HOXA9, HOXA13), MYC, ETS1, VEGFA, ZEB2, TEAD4, WNT5a, WNT2 and FAS (Fig. 1E, F).
Depletion of HOTTIP inhibits the HOX clusters’ miRNAs in cis and trans
Within the HOX cluster several non-coding transcripts, including miRNAs, are transcribed. Six miRNAs are transcribed within the intergenic regions of the HOX clusters (Fig. 2A). Loss of HOTTIP impaired posterior HOXA gene expression (e. g. HOX13-HOXA9) but did not affect anterior HOXA1–7 genes, HOXB, HOXC, or HOXD genes [12]. Through analyzing the expression profile correlation of HOTTIP, miR-196b, HOXA genes and their co factors in available gene expression datasets of AML samples [28], we found that a strong elevation and positive correlation of expression of miR-196b with HOTTIP and a group of HOXA genes and their co factors PBX3 and MESI1 (Fig. 2B). Furthermore, we analyzed TCGA-LAML database to examine expression pattern and overall survival. TCGA Kaplan Meier survival plots show that the expression patterns of HOXA9, HOXA10, PBX3, MEIS1, HOTTIP, miR-196b and miR-10a correlate and exhibit prognostic significance, and overall survival was significantly longer in patients having AML with low expression (blue color line) than those having AML with higher expression (red color line) (Fig. 2C). Thus, HOTTIP and miR-196b play an important role in the pathogenesis and prognosis of AML patients, while miR-939 expression exhibits no change in overall survival (Fig. 2C) and its expression level remains unchanged upon HOTTIP deletion (Fig. 2F). Then we asked whether depletion of HOTTIP affects mRNA, and miRNAs that are transcribed in either cis or trans in the intergenic region of the HOX cluster genes. Disruption of HOTTIP inhibits posterior HOXA genes (Fig. 2D) and several HOX cluster-related miRNAs, including miR-196b-5p, miR-196a-5p, miR-10b-5p, and miR-10a-5p/3p (Fig. 2E, F), suggesting these miRNAs are positively regulated by HOTTIP in AML. Interestingly, while HOX cluster-associated miRNAs were altered, several HOX genes targeted by these miRNAs remained unaltered in HOTTIP−/− cells (Fig. 1E). We performed correlation analysis of HOXA9, its cofactor MEIS1, miR-196b and HOTTIP in MOLM13 and KASUMI cells. Our data analysis shows posterior HOXA genes are aberrantly overexpressed in MLL-associated MOLM13 cells compared to KASUMI-1/t (8;21) cells (Fig. 2G). Similarly, pro-apoptotic genes, including CASP3, and CASP9, were also downregulated in MOLM13 (Fig. 2G). Additionally, HOX cluster miRs miR-196a, miR-196b, miR-10a, and miR-10b were enriched in MLL-AF9 MOLM13 cells compared to non-MLL-rearranged leukemia cells such as KASUMI-1/t (8;21) and correlates with expression of posterior HOXA genes (Fig. 2G). In contrast, MEIS1, FAS and HOTTIP expression remained comparable in both cell lines (Fig. 2G). However, the question remains whether miR-196b targets pro-leukemic gene HOXA9 in non-MLL-rearranged leukemia cells. The co-expression of HOTTIP and miR-196b and their inverse correlation with pro-apoptotic genes suggests that HOTTIP and miR-196b may co-target these genes in MLL-AF9 rearranged MOLM13 AML cells. Likewise, perhaps HOTTIP counteracts miR196b mediated repression of HOXA9 in AML.
Fig. 2. HOTTIP−/− perturbs HOX-cluster miRNAs, mediate oncogenic program.

(A) Schematic representation of HOX cluster coding and non-coding genes. HOX genes are indicated as numbered boxes, miRNAs are shown as triangles and lncRNAs are presented as rectangles. (B) Heatmap shows the expression correlation among miR-196b, HOTTIP, and HOXA genes in de novo AML and normal control dataset. (C) Kaplan-Meier analysis showing overall survival of patients with LAML based on dichotomized expression (relatively high or low) of HOXA9, HOXA10, PBX3, MEIS1, HOTTIP, miR-196b, miR-10a, and miR-939 genes. Results were obtained from TCGA-LMAL data. (D, E) RT-qPCR analysis of the expression level of HOTTIP, posterior HOXA genes, and HOX cluster miRNAs in WT and HOTTIP−/− MOLM13 cells. (F) small-RNA sequencing analysis of the expression level of indicated miRNAs compared WT and HOTTIP−/− MOLM13 cells. (G) Relative expression level of the indicated mRNAs, miRNAs and HOTTIP lncRNA in the MOLM13 cells and KASUMI cells.
HOTTIP established chromatin signature on HOX clusters related miRNAs loci
To further define the mechanism by which HOTTIP regulates miRNA expression, we employed ChIRP-sequencing (chromatin isolation by RNA purification) to identify HOTTIP binding genome-wide [12]. Our HOTTIP CHIRP-seq data indicated that HOTTIP mainly binds to non-coding regions, including promoter and intergenic regions [12]. The question then arises whether HOTTIP binds to regulatory loci of miRNA to induce the differential expression we observed in HOTTIP−/− compared to WT MOLM13 cells. Our data suggests that loss of HOTTIP greatly reduces its binding at the upstream promoter region of miR-196b compared to WT MOLM13 cells (Fig. 3A), which is correlated with attenuated expression of miR-196b upon HOTTIP depletion (Fig. 2E). Furthermore, transcription factor binding motif analysis revealed that the HOTTIP bound genomic locus at miR-196b is occupied by transcription factors, CTCF, GATA-2, MYC and CEBPB, as well as many other chromatin remodeling factors (Supplementary Fig. 1).
Fig. 3. HOTTIP controls the epigenetic modifications of HOX cluster miRNAs.


(A) ChIRP-seq analysis shows HOTTIP binding on promoter region of miR196b in WT and HOTTIP−/− MOLM13 cells. (B, C, D, E, F) Enrichment of the active histone marks (H3K4me3 and H3K79me2) and repressive histone mark (H3K27me3) on genomic loci of the HOX cluster miRNAs. (G, H, I, J, K) ATAC-seq analysis shows chromatin accessibility on the HOX-cluster miRNAs upon HOTTIP−/− in MOLM13 cells, and WT cells.
Next, we asked whether HOTTIP controls the chromatin signature at its targeted miRNA loci, using ChIP-seq (chromatin immunoprecipitation sequencing) for histone modifications (H3K4me3, H3K79me2; active; and H3K27me3; repressive) and ATAC-seq (assay for transposase-accessible chromatin using sequencing) to compare chromatin signatures between WT and HOTTIP−/− MOLM13 cells [12]. Depletion of HOTTIP resulted in marked decreases in H3K4me3 and H3K79me2 enrichment, while H3K27me3 levels were elevated at the genomic loci of all four HOX cluster miRNAs, including miR-10a, miR-10b, miR-196a-1, miR-196a-2, and miR-196b (Fig. 3B–F). The changes in histone marks (Fig. 3B–F) coincide with transcriptional changes (Fig. 2E–F) and HOTTIP binding pattern alteration (Fig. 3A). Concomitantly with decreased HOTTIP binding and active histone marks in HOTTIP−/− cells, chromatin accessibility at regulatory loci of these four HOX cluster miRNAs was also reduced (Fig. 3G–K). Therefore, HOTTIP governs its target genes by regulating the chromatin signature of specific miRNAs in the MLLr+ AML.
HOTTIP reactivation in CBS7/9+/− AML cells rescued the miRNA expression coupled with restored chromatin signature
We previously demonstrated that HOTTIP coordinates with its upstream regulatory element the CTCF binding site located between HOXA7 and HOXA9 (CBS7/9) to activate posterior HOXA genes and other hematopoietic oncogenes [12, 30]. Reactivation of endogenous HOTTIP expression using sgRNA targeted dCAS9-VP160 mediated promoter activation in the CBS7/9+/− MOLM13 cells (CBS7/9+/−-HOTTIP-VP160) efficiently restored posterior HOX gene (HOXA9-HOXA13) expression. These findings led us to test whether HOTTIP reactivation in CBS7/9+/− also affects miRNA expression and alters chromatin dynamics at the miRNA loci. Indeed, levels of all HOX cluster miRNAs were significantly repressed in CBS7/9+/− MOLM13 cells and completely restored in CBS7/9+/−-HOTTIP-VP160 (CBS-HT-VP) cells with reactivated HOTTIP (Fig. 4A).
Fig. 4. CBS7/9 boundary regulates HOX cluster miRNAs chromatin neighborhood.

(A) RT-qPCR analysis of HOX cluster miRNAs in WT, CBS7/9+/−, and CBS7/9+/−+HOTTIP-VP (CBS-HT-VP) MOLM13 cells. (B) ATAC-seq analysis shows chromatin accessibility on the loci of HOX cluster miRNAs in WT, CBS7/9+/−, and dCas9-VP160-mediated HOTTIP-activated CBS7/9+/− MOLM13 cells (CBS-HT-VP).
Next, we carried out ATAC-seq data analysis through comparing WT, CBS7/9+/−, and HOTTIP-reactivated CBS7/9+/− MOLM13 cells. Repression of HOTTIP in CBS7/9+/− cell reduced chromatin accessibility at the HOX cluster-associated miRNA loci, while accessibility was largely restored in HOTTIP-activated CBS7/9+/−-HT-VP160 (CBS-HT-VP) MOLM13 AML cells (Fig. 4B). Hence, HOTTIP function is critical for regulating the chromatin accessibility and expression levels of these four HOX locus miRNAs.
miR-196b simultaneously targets oncogenes and tumor suppressors to maintain MLL-AF9 AML
miR-196b represses a subset of targets with tumor suppressor activity in vivo and is selectively enriched by cooperation with MLL-AF9 to promote leukemogenesis [28]. Surprisingly, miR-196b also targets HOXA9 and MEIS1 that play essential oncogenic roles [28]. Because HOTTIP positively regulates both miR-196b and its target HOXA9 and MEIS1 [12], we investigated the function of miR-196b in leukemogenesis. Expression of miR-196b was strongly suppressed in MOLM13 cells treated with LNA196b compared to NTC (non-targeting control) (Supplementary Fig. 2A). Although, MOLM13 cells have high levels of both miR-196b and HOXA9 expression, we assessed the regulatory effects of miR-196b on HOXA9 and MEIS1 in MOLM13 cells. Both HOXA9 and MEIS1 were significantly elevated upon miR-196b inhibition (Fig. 5A). Reduction of miR-196b also resulted in increased expression of HOXA13 in MOLM13 cells (Fig. 5A). This suggests that the repressive function of miR-196b might fine tune expression of HOTTIP activated HOX genes in acute myeloid leukemia.
Fig. 5. Inhibition of miR-196b induced apoptosis in MOLM13 cells.

(A) RT-qPCR analysis of miR-196b targets in MOLM13 cells treated with either negative control or locked nuclei acids (LNA) against miR-196b. (B) RT-qPCR analysis of miR-196b targets in MOLM13 cells treated with either mimics of specific miRNA or control. (C) Bar graph shows flow cytometry (FACS - florescence activated cell sorting) evaluated percentage of annexin V stained apoptotic population of MOLM13 cells in control and miR-196b knockdown groups. (D, E, G, H, I) RT-qPCR analysis of indicated miRNA and mRNA in OCI-AML3 cells treated with either negative control or LNA against miR-196. (F) Bar graph shows percentage apoptotic population of OCI-AML3 cells in control and miR196 knockdown groups.
To further understand the pro-oncogenic role of miR-196b, we investigated the expression of tumor suppressor FAS, which is a verified target of miR-196b in AML subtypes and colon cancer cells [28, 29]. Expression of FAS and its downstream genes Caspase3 (CASP3) and Caspase9 (CASP9) was significantly elevated in cells treated with LNA196b compared to NTC (Fig. 5A). However, growth competition assay shows no difference in the proliferation rate of cells treated with LNA196b compared to NTC (Supplementary Fig. 2B).
Next, we assessed whether overexpression of miR-196b simultaneously represses the expression of both oncogenes and tumor suppressors. Forced expression of miR-196b significantly represses HOXA9, MEIS1, FAS, CASP3 and CASP9 in MOLM13 cells (Fig. 5B). To reveal the mechanism underlying the oncogenic role of miR-196b, we analyzed the apoptosis rate in MOLM13 cells treated with either LNA196b or NTC. Repression of miR-196b manifested a higher rate of apoptosis compared to NTC-treated MOLM13 cells (Fig. 5C). These results indicate that miR-196b promotes leukemogenesis by down-regulating FAS, and its downstream genes, thus suppressing apoptosis in AML.
To further cement the oncogenic role of miR-196b, we carried out functional knockdown of miR-196b in another AML subtype with high expression of HOTTIP, OCI-AML3 cell. Expression level of miRs were strongly suppressed in cells introduced with LNA196 (Fig. 5D, E). Inhibition of miR-196a/b resulted significant increase in apoptotic cell death (Fig. 5F, Supplementary Fig. 2C) and enhanced expression level of proapoptotic genes (Fig. 5G, H, I). Together, these results further suggested that miR-196b functions as an oncogene to suppress proapoptotic genes in AML subtypes.
HOTTIP inhibits FAS expression to maintain MLL-AF9 leukemia
We previously reported that exogenous expression of HOTTIP aberrantly elevated HOXA9-HOXA13 genes, resulting in impaired hematopoietic stem cell (HSC) function and an increased leukemia stem cell (LSC) population in vivo [12]. Thus, we intend to define the mechanisms by which HOTTIP might control the LSC pool. Since HOTTIP regulates the chromatin signature and expression of miR-196b, which targets both oncogenes and pro-apoptotic genes (e.g., FAS). We investigated whether HOTTIP also targets FAS in AML. The mRNA level of FAS and its downstream pathway genes (e.g., CASP3, CASP8, and CASP9) significantly increased in HOTTIP−/− relative to WT MOLM13 cells (Fig. 6A). Further, we found that expression of the pro-apoptotic genes was enhanced in CBS7/9+/– cells in which HOTTIP expression is significantly repressed (Fig. 6B). Intriguingly, when comparing CBS7/9+/– cells to WT cells (Fig. 6B), mRNA levels of CASP3 and CASP9 were significantly elevated in CBS7/9+/– cells while CASP8 was unaffected. We next tested whether CRISPR-mediated endogenous gene activation of HOTTIP in these cells represses the pro-apoptotic genes. Reactivation of HOTTIP in the CBS7/9+/– cells strongly repressed CASP3 and CASP9 while the CASP8 level remained unchanged in MOLM13 AML cells (Fig. 6B). Next, we carried out western blot analysis using WT, HOTTIP–/–, CBS7/9+/–, and the HOTTIP-activated CBS7/9+/− MOLM13 cells. Cleaved CASP3 protein level was markedly increased in HOTTIP−/− and CBS7/9+/– compared to WT cells, whereas the change in cleaved CASP3 protein level was undetectable upon HOTTIP reactivation, which closely resembles WT MOLM13 cells (Fig. 6C). Then we carried out functional deletion of HOTTIP in another AML subtype OCI-AML3 cells and examined the effects of HOTTIP–/– on gene expression and apoptotic cell death. mRNA expression analysis in OCI-AML3 cells showed that inhibition of HOTTIP induced proapoptotic genes and reduced oncogenic posterior HOXA genes (Fig. 6D). Subsequently protein analysis by western blot shows the increased level of CASP8 in HOTTIP knockout cells compared to WT cells (Fig. 6E). Flow cytometry analysis clearly showed an increase in apoptotic cell death in HOTTIP–/– cells compared to WT cells (Fig. 6F, Supplementary Fig. 3). Additionally, the TCGA-LAML Kaplan Meier plot shows increased expression of CASP3 positively correlated with overall survival (Fig. 6G). Thus, HOTTIP directly controls AML cell survival and apoptosis by regulating the FAS-Caspase axis.
Fig. 6. HOTTIP targets FAS, and CBS7/9 boundary play role in maintaining the HOTTIP targets-chromatin neighborhood.

(A) RT-qPCR analysis of HOTTIP expression WT, HOTTIP−/−, CBS7/9+/−, and CBS7/9+/−+HOTTIP-VP MOLM13 (CBS-HT-VP) cells. (B) RT-qPCR analysis of the expression level of Caspase related genes in WT, CBS7/9+/−, and dCas9-VP160-mediated HOTTIP-activated MOLM13 (CBS-HT-VP) cells, including CASP3, CASP8, and CASP9. (C) Western blot data shows protein level of β-actin and cleaved Caspase-3 in WT, HOTTIP−/−, CBS7/9+/−, and dCas9-VP160-mediated HOTTIP-activated MOLM13 (CBS-HT-VP) cells. (D) RT-qPCR analysis shows the expression level of indicated genes in WT and HOTTIP−/− OCI-AML3 AML cells. (E) Western blot data shows the protein level of cleaved Caspase-8 and β-actin in WT, and HOTTIP−/− OCI-AML3 cells. (F) Bar graph shows the percentage of FACS evaluated annexin V stained apoptotic population in WT and HOTTIP−/− OCI-AML3 cells. (G) Kaplan-Meier analysis showing overall survival of patients with LAML based on dichotomized expression (relatively high or low) of CASP3 gene. Results were obtained from TCGA-LMAL data. (H) ChIP-seq analysis shows histone marks (H3K4me3, H3K27me3 and H3K79me2) enrichment on the FAS promoter in WT and HOTTIP−/− MOLM13 cells. (I) ATAC-seq analysis of chromatin accessibility on the FAS promoter in WT and two HOTTIP−/− MOLM13 clones. (J) ATAC-seq analysis of chromatin accessibility on the FAS promoter in WT, CBS7/9+/−, and dCas9-VP-160-mediated HOTTIP-activated MOLM13 (CBS-HT-VP) cells.
To evaluate how HOTTIP directly regulates FAS expression, we investigated HOTTIP binding and the chromatin signature at the promoter of FAS in WT, HOTTIP–/–, CBS7/9+/−, and CBS7/9+/–HT-VP160 MOLM13 cell lines. Consistently, relative enrichment of active histone modifications (H3K4me3 and H3K79me2) was increased, whereas repressive histone modification (H3K27me3) was decreased in HOTTIP–/– compared to WT cells (Fig. 6H). Additionally, chromatin accessibility, as determined by ATAC-seq, was increased at the HOTTIP binding site on FAS in HOTTIP–/– and CBS7/9+/– cells, whereas reactivation of HOTTIP reduced accessibility, resembling WT MOLM13 cells (Fig. 6I, J). This suggests that HOTTIP maintains a repressive chromatin signature at the promoters of tumor suppressor genes to promote leukemogenesis.
miR-196b repression delays leukemogenesis in MOLM13 cell transplantation
miR-196b functions downstream of HOTTIP, and together they coordinate to repress the FAS tumor suppressor in MOLM13 cells. We previously showed that transplantation of HOTTIP−/− MOLM13 cells into irradiated NSG mice delayed leukemogenesis compared to WT MOLM13 cells [12]. To further assess the function of miR-196b downstream of HOTTIP in leukemogenesis in vivo, we knocked down miR-196b in MOLM13-YFP-luciferase cells and then transplanted them into immunodeficient NOD-scid IL2rγnull (NSG) mice for luciferase-based imaging of leukemogenic burden over time and, ultimately, survival analysis. Depletion of miR-196b inhibited leukemia cell engraftment, whereas transplantation of WT MOLM13-YFP-luc cells showed remarkable expansion in vivo (Fig. 7A, B, C). We found that depletion of miR196b resulted in elongated survival (19 days, OS), whereas mice receiving WT MOLM13 cells died on day 15 (overall survival, OS) (Fig. 7D). The spleen size was dramatically smaller in mice receiving miR-196b KD MOLM13-YFP-luc cells than in mice receiving WT MOLM13-YFP-luc cells (Fig. 7E, Supplementary Fig. 4). Fluorescence-activated cell sorting (FACS) analysis showed that hCD45+ bone marrow (BM) and spleen cells were slightly reduced in mice receiving miR-196b KD cells compared to WT cells (Fig. 7F, Supplementary Fig. 5). Thus, miR-196b functions downstream of HOTTIP and coordinates with the lncRNA to repress FAS signaling, and miR-196b inhibition reduces the AML leukemia burden in vivo (Fig. 7G).
Fig. 7. Inhibition of miR-196b inhibits in vivo leukemogenesis.
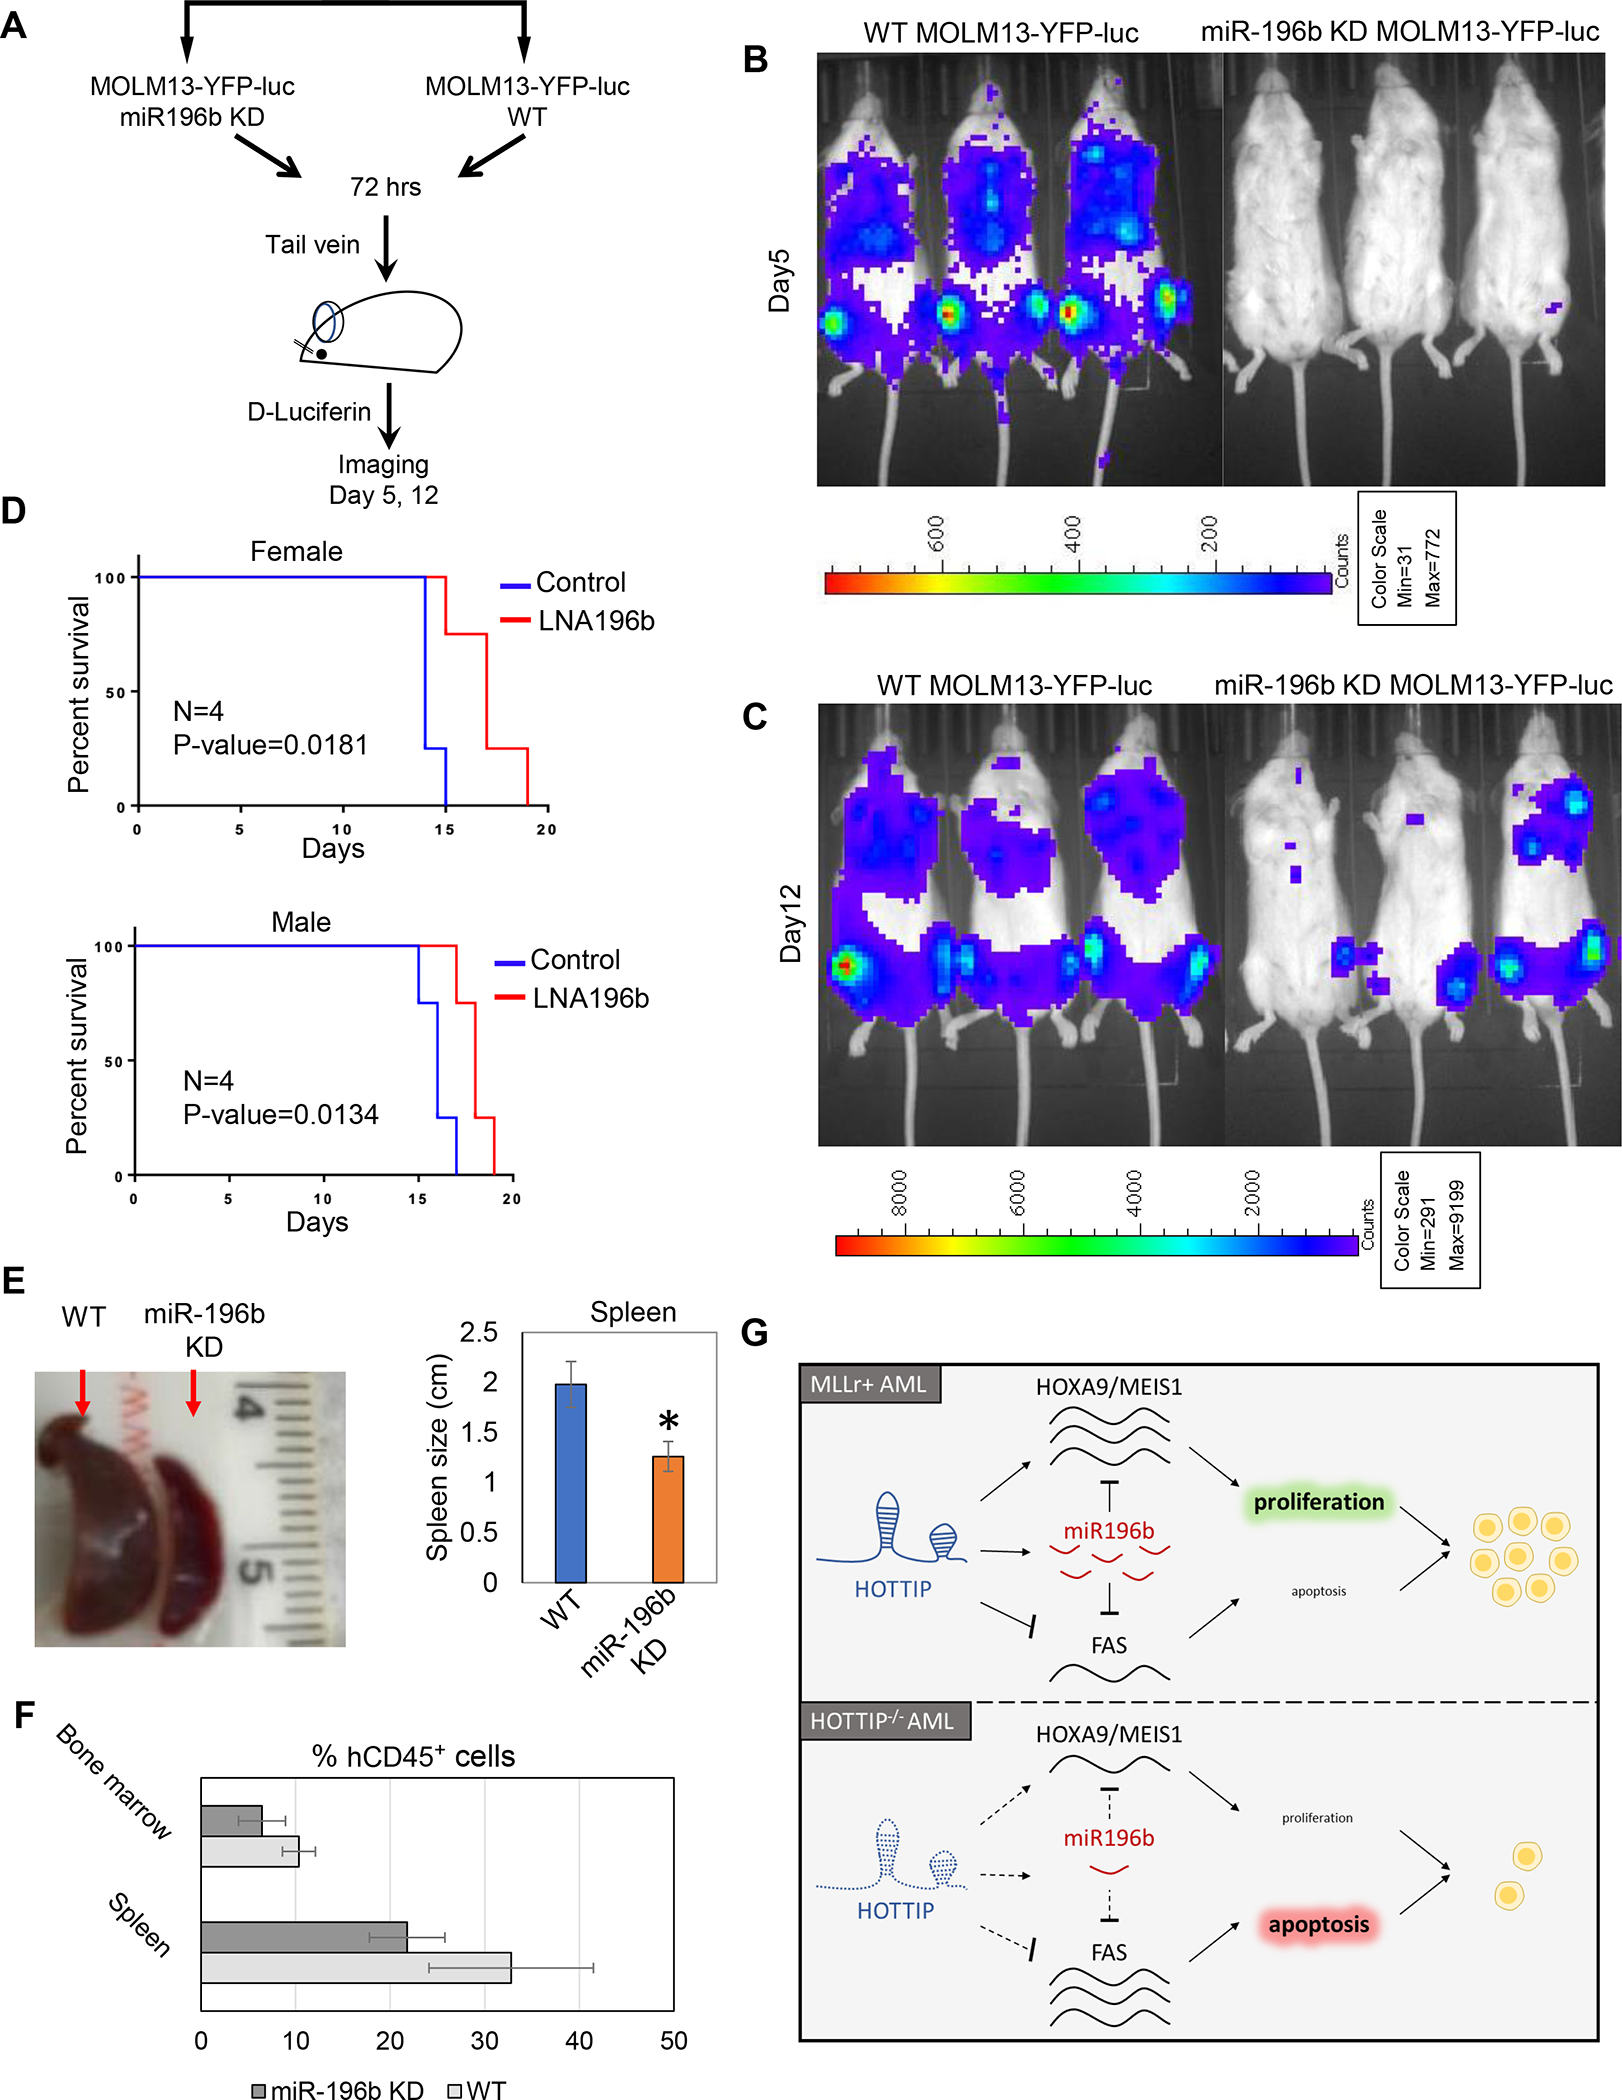
(A) Schematic representation of the MOLM13 transplantation in NSG mice and imaging. Luciferase expressing MOLM13 cells either WT or miR196b KD were injected into NSG mice through tail vein, followed by in vivo imaging to assess the knockdown effects of miR-196b in leukemogenesis (B, C) Representative images of leukemogenesis in NSG mice transplanted with MOLM13 cells treated with either LNA196b or negative control. (D) Overall survival (OS) of female or male NSG mice xenografted with MOLM13 cells compared LNA196b and negative control. (E) Representative spleens images of NSG mice after 12 days transplantation with MOLM13 cells treated with either LNA196B or negative control. Right bar graph shows relative spleen size in mice received MOLM13 cells treated with either LNA196B or control. (F) The percentage ratio of human CD45+ cells from bone marrow (BM) and spleen after 12 days transplantation was analyzed by FACS. (G) Model of HOTTIP/miR196b regulation in MLLr+ and NPM1c+ AML. HOTTIP activation in MLLr+ AML activates expression of HOXA9, MEIS1, and miR196b and suppresses FAS. miR196b, in turn, represses HOTTIP target genes to maintain a proliferative state and drive leukemogenesis. In the absence of HOTTIP, these pathways are inactive, therefore, HOXA9 and MEIS1 levels decrease, and FAS levels increase, resulting in leukemic cells undergoing apoptosis.
Discussion
Long-non-coding RNAs (lncRNAs) and microRNAs (miRNAs) have emerged as biomarkers, drivers, and potential therapeutic targets for a wide array of complex disorders, including leukemia [19, 31]. A growing number of publications demonstrated that miRNAs interact with lncRNAs thereby influencing their target gene expression[32]. The role of lncRNAs in gene silencing is well established; however, less is known about their function in active genomic loci where miRNAs are transcribed [6]. HOTTIP (HOXA transcript at the distal TIP), a lncRNA, has been known to interact with WDR or WDR/MLL protein complex to epigenetically regulate the 5’ HOXA gene by methylating histone H3K4, which is associated with active transcription. Recent studies from our laboratory combining a variety of molecular biology and bioinformatics techniques have revealed the regulatory networks activated by HOTTIP in malignant hematopoiesis and acute myeloid leukemia. Depletion of HOTTIP effectively inhibited the posterior HOXA genes (HOXA9-HOXA13), and its inhibitory effects gradually diminished on genes towards the anterior end (HOXA1-HOXA7) [12, 33]. However, whether miRNA genes are regulated by HOTTIP in a similar manner to protein coding genes remained a question relevant to hematopoiesis and leukemogenesis. LncRNA can influence miRNA function in many ways: (1) lncRNAs can serve as a source to produce mature miRNAs (2) lncRNAs act as sponge, binding miRNA to prevent them from repressing their target mRNA genes and (3) lncRNAs alter miRNA gene transcription by binding on their promoter [19]. To profile HOTTIP regulated miRNA in MOLM13 cells, our small RNA sequencing revealed that loss of HOTTIP significantly affects expression of several miRNAs when comparing WT and HOTTIP–/– MOLM13 AML cells. Intriguingly, several ncRNAs, including lncRNAs and miRNAs, are transcribed from the intergenic regions of the HOX clusters. However, it remains unknown how HOTTIP may mediate ncRNA transcription, particularly of miRNAs, and how the HOTTIP-miRNA axis governs gene expression in malignant hematopoiesis.
HOXA9 expression is positively regulated by mixed lineage leukemia (MLL) methyltransferase, which trimethylates histone 3 lysine 4 (H3K4me3) at the HOXA9 promoter [34]. This mechanism is directly antagonized by the sequential activity of polycomb repressive complexes PRC1 and PRC2 that trimethylated histone 3 lysine 27 (H3K27me3). Moreover, topologically associating domains (TAD) of the HOX loci within the nucleus also have an important role in coordinating expression. HOTTIP lncRNA interacts with the WDR5-MLL complex and localizes the complex to the 5’HOXA locus [12, 33]. To determine whether HOTTIP provides a basis for transcriptional activation and three-dimensional (3D) chromatin organization in posterior HOX gene loci, we screened all CTCF sites and lncRNAs important for HOXA9 expression within all four HOX gene loci in MLL-AF9 rearranged MOLM13 AML cells using a CRISPR/CAS9 lentivirus screening library [30]. The HOTTIP lncRNA acts downstream of the CBS7/9 boundary to regulate expression of genes located in cis and trans, including HOXA13-HOXA9, MEIS1, and RUNX1, which are important for hematopoiesis, and leukemia [12]. Furthermore, ChIRP-seq analysis revealed that HOTTIP binds to its target genes [12] and a cohort of miRNAs. This data raises the question of whether HOTTIP also controls the expression of miRNAs that are involved in the management of malignant hematopoiesis.
Our sequence data analysis demonstrated that inhibition of HOTTIP in MOLM13 cells significantly inhibited several miRNAs, including HOX cluster miRNA, miR-196b, which targets both oncogenic HOXA9 and the FAS tumor suppressor. Expression profiling of primary AML patient samples showed strong correlation among miRNA, HOTTIP, and their target HOX genes. Furthermore, ATAC-seq (assay for transposase-accessible chromatin using sequencing) data analysis defined chromatin signatures at differentially expressed miRNAs bound by HOTTIP in cis and trans, including HOX clusters miR-196b. HOTTIP binding on the promoter region of miRNAs that are differential expressed in HOTTIP−/− MOLM13 cells suggests that HOTTIP directly controls transcriptional regulation of miRNAs.
Dynamics of chromosomal structure play important roles in gene control. Several proteins modulate chromatin dynamics by contributing to structural interactions between gene promoters and their enhancer elements. Enhancer/promoter communications for specific transcription programs are enabled by topological associated domains (TADs), which are basically structural and functional chromosomal units. Often inappropriate promoter/enhancer interactions result from altered TADs, which lead to aberrant transcription of oncogenes or tumor suppressor genes. Binding of transcription factor CTCF in chromatin boundaries plays an important role in defining TADs and chromatin signature within TADs. We previously reported that CTCF binding located in between of HOXA7 and HOXA9 defines posterior HOXA locus TADs and chromatin signature within the TADs. Depletion of CBS7/9 impaired chromatin structure and altered posterior HOXA gene expression due to lacking function of HOTTIP lncRNA [12]. By virtue of CBS7/9’s role in regulating posterior HOXA genes and lncRNA HOTTIP expression, we show that HOX cluster miRNAs are altered in CBS7/9+/− and that HOTTIP over-expression in CBS7/9+/−cells restored HOX cluster miRNA expression and chromatin signature. Apart from the cis coding miR-196b, HOTTIP lncRNA also bound and regulated trans HOX and non-HOX cluster miRNAs.
To decipher the mechanisms by which HOTTIP exerts miRNAs to control target genes, we performed bioinformatics analysis that revealed many differentially expressed genes in HOTTIP−/− MOLM13 cells, which are co-regulated by HOTTIP and miR-196b. Although HOTTIP positively regulates expression of their co-expressed oncogenes, several of them are negatively regulated by miR-196b. Thus, it seems that negative regulation of the co-expressed 5’ HOXA genes in MOLM13 cells might be fine-tuned by miR-196b in normal hematopoiesis [28]. Notably, single miRNA (or groups of miRNAs) targets multiple genes including oncogenes and tumor suppressors simultaneously or sequentially. Partial repression of HOXA9 and MEIS1 by miR-196b in the human MLL-rearranged leukemia may not potent enough to affect their function to induce and maintain leukemia. The tumor suppressor targets (e.g., FAS) of miR-196b could significantly inhibit cell transformation and leukemogenesis. Indeed, miR-196b inhibition induced FAS expression and cleaved caspase-3. As a result, the apoptotic cell death increased upon miR-196b knockdown in MOLM13 cells. Similarly, induced expression of FAS and Cas3 in HOTTIP−/− and CBS7/9+/− is associated with increased cell death. HOTTIP modulates epigenetic marks on the FAS promoter and thereby controls chromatin accessibility and gene expression. However, HOTTIP represses FAS expression perhaps through activation of miR-196b that directly targets FAS. miR-196b-deficient MOLM13 cell transplantation in NSG mice delayed leukemogenesis. All mice transplanted with WT MOLM13 cells died within 15 days, while mice receiving miR-196b-depleted cells survived longer and exhibited fewer hCD45+ AML cells. Transgenic overexpression of HOTTIP lncRNA in mice affected HSC function and increased leukemia stem cell (LSC) pool, inducing leukemia-like disease [12]. Thus, HOTTIP and miR-196b deletion reduces the AML leukemic burden in vivo, and both coordinate to regulate FAS expression at the transcriptional and post-transcriptional level to promote leukemogenesis.
Taken together, we report a mechanism mediated by HOTTIP to regulate miR-196b expression in AML. Our study revealed a regulatory model in which HOTTIP-miR-196b axis represses the expression of tumor suppressor FAS that circumvent the negative effects of HOXA9 repression by miR-196b in AML. The aberrant upregulation of both HOTTIP and miR-196b by MLL fusion results in the persistent repression of its tumor-suppressor targets (e.g., FAS) along with dual control (transactivation and inhibition) of their oncogenic co-targets (HOXA9/MEIS1). This inhibits differentiation, disrupts cell homeostasis, and promotes cell proliferation via inhibiting apoptosis, consequently maintaining leukemia stem cell pools. Apart from miR-196b, HOTTIP also bound and regulated a subset of non-HOX cluster miRNAs while a subset of miRNAs was upregulated in HOTTIP-inhibited MOLM13 cells. Future studies should aim to investigate the mechanism by which HOTTIP modulates expression of candidate miRNA in hematopoiesis and leukemogenesis.
Material and methods
Tissue and Cell culture
MOLM13 cells were cultured and maintained in RPMI medium supplemented with 10% FBS and 1% penicillin and streptomycin solution, and OCI-AML3 cells were cultured in alpha-MEM supplemented with 10% FBS and 1% penicillin/streptomycin. All cells were maintained at 37°C with 5% CO2 in a humidified incubator. All medium and supplements were purchased from Thermo Fisher Scientific.
SsecCRISPR-Cas9 Mediated HOTTIP lncRNA Knock-Out and Lentivirus Production
The detailed protocol of generating HOTTIP knockout (KO) MOLM13 leukemia cells were from our previous report [12]. In brief, CRISPR-RNA (crRNA) and tracrRNA were mixed and annealed at 950C for 5 min and the cooled down to room temperature. Subsequently, crRNA: tracrRNA duplex and S.p. Cas9 Nuclease components were combined and then mixed with 500,000 AML cells for electroporation with Neon® System. The DNA was extracted after 24 hrs. or 96hrs. from 100ul of transfected cells using Qiagen Quick Extract kit and processed for Sanger sequencing for verification of mutation. The targeted deletion of HOTTIP: HOTTIP−/− -#1 targeted region is Chr7: 27241953–27241985; HOTTIP−/− -#2 targeted region is Chr7: 27240098–27240123.
dCas9-Mediated Overexpression of HOTTIP in AML Cells
HOTTIP promoter targeting guide RNA was designed using the Zhang laboratory web tool (http://crispr.mit.edu, and cloned into lentiviral vector the pLKO5.sgRNA.EFS.tRFP vector (Addgene #57824). The gRNA plasmid encoding puromycin was co-transfected with a plasmid encoding dCas9-VP160 (pAC94-pmax-dCas9VP160–2A-puro, Addgene plasmid number #48226) in MOLM13 and OCI-AML3 cells. Transfected MOLM13 cells were selected with 2μg/ml puromycin for 48 hrs. Then, RFP+ positive cells were sorted by FACS. RNA was extracted from puromycin and RFP+ positive cells, and gene expression was analyzed by RT-qPCR using specific primer sets [12].
miRNA Knockdown and Over Expression
Locked Nucleic Acids (LNA) and miRNA mimics and scrambled LNA/mimic (negative control) was purchased from Qiagen, and then MOLM13 and OCI-AML3 AML cells were transfected with either LONZA nucleofector devise (program X-001) or Lipofectamine 3000 (Invitrogen), separately. 2×10^6 cells were transfected with 5ul (stock 20uM) of LNA using manufacturers protocol and LONZA nucleofector devise and transfection solution and seeded in 6-well plate. Cells were harvested on day 5 of transfection for RNA extraction and gene expression analysis.
Western Blot Analysis
Whole cell lysate extract (total protein) was prepared using RIPA buffer and quantified using Bradford method. Total protein lysates were fractionated on 4%−20% on tris-glycine polyacrylamide gradient gel and transferred onto PVDF membrane. The bot was exposed to specific antibodies to detect the endogenous protein level using chemiluminescence method and BioRad imaging system: anti-β-actin (cat#A2066–100U); Sigma at 1: 5000, anti-Cleaved Caspase-3 (cat#9661); Cell Signaling at 1:1000 dilution; anti-Cleaved Caspase-8 (cat#9746); Cell Signaling at 1:1000 dilution.
Apoptosis Analysis
MOLM13 cells transfected with either LNA against specific miRNA or scrambled non-targeting control were seeded and cultured in 6-well dishes. Cells were harvested 72hrs post transfection and washed with PBS. Apoptotic cells were detected by Accuri C6 fluorescence-activated cell sorting (FACS) using Annexin V-APC Apoptosis Detection Kit (BD) according to the manufacturer’s protocol.
RNA Extraction and Real-Time qPCR
Norgen Biotek RNA purification kit was used to isolate total RNA as per manufacturer’s instructions. cDNA (reverse transcription - RNA to cDNA) was made using High-Capacity RNA to cDNA kit (Life Technologies, Grand Island, NY). miRNA and mRNA qPCR were performed using TaqMan (Life Technologies) and Sybr Green assay respectively with either Taqman Universal PCR Master Mix (miRNA qPCR) or BioRad SsoAdvanced Universal Sybr Green Supermix according to the manufacturer’s protocol on a Bio-Rad CFX96 Touch Real Time PCR Detection System (Bio-Rad Laboratories, Richmond, CA). PCR reactions were performed in triplicate using either U6 (miRNA qPCR), or GAPDH (human messenger RNA qPCR) as the normalizer.
Small RNA library preparation and sequencing analysis
The small RNA-seq of the MOLM13 WT and HOTTIP−/− cells was conducted at Genome Science Facility, Pennsylvania State University College of Medicine. Small RNA-seq libraries were prepared using BioO from Perkin Elmer and Qiagen kits. Small RNAs were sequenced using a TruSeq Small RNA Sequencing Kit (Illumina, San Diego, CA, USA) according to manufacturer instructions. The quality of libraries was assesses based on size distribution and concentration using 2100 Bioanalyzer with DNA 1000 chip (Agilent Technologies. All samples were sequenced 25M reads on an Illumina NovaSeq 6000 Sequencer using the 2×50bp paired-end platform.
All of raw binary base call files from the sequencer were transformed into FASTQ format and de-multiplexing using Illumina bcl2fastq2 Conversion Software v2.20 (https://support.illumina.com/downloads/bcl2fastq-conversion-software-v2–20.html). Quality of the sequenced reads was evaluated using FastQC developed by Babraham Bioinformatics (https://www.bioinformatics.babraham.ac.uk/projects/fastqc/). Then these fastq files were performed by adapter trimming using the FASTQ Toolkit App version 1.0 of Illumna BaseSpace (http://basespace.illumina.com/apps/) and sequence alignment with GRCh37 human genome assembly database using OASIS2.0 (https://oasis.dzne.de/index.php).
Differential expression analysis was performed using the DESeq2 algorithm [35] and the expression was normalized using de Variance Stabilizing Transformation from the DESeq2 algorithm in R. The differential expression of miRs with adjusted p values < 0.05, and fold change (FC)≥2 representing positive log2FC (>1.0) and negative log2FC (<−1.0) were considered to be significantly different.
The potential targets of miRs were derived from the miRTarBase [36] in human genome (http://mirtarbase.cuhk.edu.cn/php/index.php). Raw sequencing data can be accessed through NCBI GEO under accession number (GSE182601).
Chromatin Immunoprecipitation (ChIP) Assay
ChIP assay was performed as the previously described [12]. Briefly, crosslinked chromatin prepared from MOLM13 cells were immunoprecipitated with antibodies against MLL1, H3K4me3, H3K9me2, H3K27me3, and H3K79me2, separately. The MLL1, H3K4me3, H3K79me2 and H3K27me3, H3K79me2 ChIP-DNA libraries were prepared using illumina’s TruSeq ChIP Sample Preparation Kit according to the manufacturers’ instructions (Cat # IP-202–1012). Agilent TapeStation was used to check the quality of the libraries as per manufacturer’s instruction. Final libraries were submitted to paired-end sequencing of 100 bp length on an Illumina HiSeq 3000. All sequencing genomics datasets were deposited in the NCBI GEO under accession number (GSE114981).
Chromatin Isolation by RNA Immunoprecipitation (CHIRP) Assay
The detailed methods of CHIRP assay were previously described [12]. Briefly, sonicated chromatin materials diluted using hybridization buffer and hybridized with 100pmol of biotinylated tiling DNA probes targeting HOTTIP or LacZ containing 100 μL of Streptavidin-magnetic C1 beads (Invitrogen). RNA and DNA hybrids and RNA binding proteins were subjected to analysis by ChIRP-qPCR and ChIRP-RT-qPCR. Illumina’s TruSeq ChIP Sample Preparation Kit was used according to manufacturer’s instructions for preparation of CHIRP libraries and submitted to paired-end sequencing of 100 bp length on an Illumina HiSeq 2500. All sequencing genomics datasets were deposited in the NCBI GEO under accession number (GSE114981).
ChIP-seq and ChIRP-seq Data Analysis
ChIP-seq and ChIRP-seq data processing and analysis was previously described [12]. Briefly, all sequencing tracks were viewed using the Integrated Genomic Viewer [37]. Peaks annotation was carried out with the command “annotatePeaks.pl” from HOMER package [38]. For ChIRP-seq motif analysis, the de novo motif analysis was performed by the “findmotifsgenome.pl” from the HOMER motif discovery algorithm [38]. The genes and pathways regulated by the HOTTIP bound promoters or intergenic regions were analyzed and annotated by the Gene Ontology analysis with the Database for Annotation, Visualization and Integrated Discovery (DAVID) tool (https://david.ncifcrf.gov/, Version 6.8) [39]. Each GO term with a p value more than 1 × 10^−3 is used for cutoff (threshold: 10^−3). All genomics datasets were deposited in the NCBI GEO under accession number (GSE114981).
Assay for Transposase-Accessible Chromatin Using Sequencing (ATAC-seq)
ATAC-seq was previously described [12] using the Nextera DNA library preparation kit. Libraries were quantified using qPCR (Kapa Library Quantification Kit for Illumina, Roche), and purified with AMPure beads (Beckman Coulter). Quality of the DNA library was examined by Agilent bio-analyzer 2100 prior to sequencing in duplicates with 2×100 bp paired-end reads on an Illumina NextSeq 500. All genomics datasets were deposited in the NCBI GEO under accession number (GSE114981).
ATAC-seq Analysis
Detailed method of ATAC-seq analysis was previously described [12]. Briefly, all sequencing tracks were viewed using the Integrated Genomic Viewer (IGV/2.4.19) [37]. Peaks annotation was carried out with the command “annotatePeaks.pl” from HOMER package (version 4.8) [38] and GREAT [40]. DEseq2 (Benjamini-Hochberg adjusted p< 0.05; FoldChangeR2) were also performed to find the differential binding sites between two peak files, including control and treatment groups with C+G normalized and “reads in peaks” normalized data [41]. The de novo motif analysis was performed by the “findmotifsgenome.pl” from the HOMER package [38]. For each genomic feature (peaks or chromVAR annotation), we calculated the chromatin accessibility median deviation z-score (for chromVAR features) or fragment counts (for peaks) in control and treatment groups with chromVAR package in R language [42]. Pearson’s correlation coefficient and Pearson’s c2-test were carried out to calculate overall similarity between the replicates of ATAC-seq global open chromatin signatures. All genomics datasets were deposited in the NCBI GEO under accession number (GSE114981).
Xenotransplantation of Human Leukemic Cells and Patient-Derived Xenografts (PDX)
MOLM13 cells - WT or miR-196b KD were injected into the tail vein of the NSG mice (2–3 months old). Cells were resuspended into DPBS and injected at 5 × 10⁵ cells (in 150 to 200μL DPBS) per mouse. Mice were monitored daily for symptoms of disease (ruffled coat, hunched back, weakness and reduced motility) to determine the time of killing for injected mice with sign of distress. Experimentally used NSG mice were humanely killed at the time of moribund. Blood was collected into microtubes for automated process with K2EDTA. Bone (tibias, femurs, and pelvis) and spleen were dissected. BM cells were isolated by flushing the bones. Spleens were mashed through a 70-mm mesh filter and made into single cell suspensions. Human CD45+ (BD) chimerism in these hematopoietic tissues was analyzed by Accuri C6 flow cytometry.
Supplementary Material
Acknowledgements
We are grateful to the Penn State College of Medicine Genome Science Facility for illumine sequencing core and the Flow Cytometry & Cell Sorting Core. We are grateful for helpful discussions from Dr. Yi Qiu (Penn State College of Medicine). We would like to thank Sachin Singh (Center for Cellular and Molecular Biology, India) for helping the data analysis from the TCGA dataset.
Funding
This work was supported by the grants from National Institutes of Health (S.H., R01DK110108, R01CA204044, and R01HL141950).
Footnotes
Competing interests
The authors declare no competing interests.
References
- 1.He RZ, Luo DX, Mo YY. Emerging roles of lncRNAs in the post-transcriptional regulation in cancer. Genes Dis 2019; 6: 6–15. [DOI] [PMC free article] [PubMed] [Google Scholar]
- 2.Dey BK, Mueller AC, Dutta A. Long non-coding RNAs as emerging regulators of differentiation, development, and disease. Transcription 2014; 5: e944014. [DOI] [PMC free article] [PubMed] [Google Scholar]
- 3.Lambert M, Alioui M, Jambon S, Depauw S, Van Seuningen I, David-Cordonnier MH. Direct and Indirect Targeting of HOXA9 Transcription Factor in Acute Myeloid Leukemia. Cancers (Basel) 2019; 11. [DOI] [PMC free article] [PubMed] [Google Scholar]
- 4.Collins CT, Hess JL. Deregulation of the HOXA9/MEIS1 axis in acute leukemia. Curr Opin Hematol 2016; 23: 354–361. [DOI] [PMC free article] [PubMed] [Google Scholar]
- 5.De Kumar B, Krumlauf R. HOXs and lincRNAs: Two sides of the same coin. Sci Adv 2016; 2: e1501402. [DOI] [PMC free article] [PubMed] [Google Scholar]
- 6.Long Y, Wang X, Youmans DT, Cech TR. How do lncRNAs regulate transcription? Sci Adv 2017; 3: eaao2110. [DOI] [PMC free article] [PubMed] [Google Scholar]
- 7.Grossi E, Raimondi I, Goni E, Gonzalez J, Marchese FP, Chapaprieta V et al. A lncRNA-SWI/SNF complex crosstalk controls transcriptional activation at specific promoter regions. Nat Commun 2020; 11: 936. [DOI] [PMC free article] [PubMed] [Google Scholar]
- 8.Singh AP, Archer TK. Analysis of the SWI/SNF chromatin-remodeling complex during early heart development and BAF250a repression cardiac gene transcription during P19 cell differentiation. Nucleic Acids Res 2014; 42: 2958–2975. [DOI] [PMC free article] [PubMed] [Google Scholar]
- 9.Singh AP, Foley JF, Rubino M, Boyle MC, Tandon A, Shah R et al. Brg1 Enables Rapid Growth of the Early Embryo by Suppressing Genes That Regulate Apoptosis and Cell Growth Arrest. Mol Cell Biol 2016; 36: 1990–2010. [DOI] [PMC free article] [PubMed] [Google Scholar]
- 10.Singh AP, Foley J, Tandon A, Phadke D, Karimi Kinyamu H, Archer TK. A role for BRG1 in the regulation of genes required for development of the lymphatic system. Oncotarget 2017; 8: 54925–54938. [DOI] [PMC free article] [PubMed] [Google Scholar]
- 11.Basta JM, Singh A, Robbins L, Stout L, Pherson M, Rauchman M. The core SWI/SNF catalytic subunit Brg1 regulates nephron progenitor cell proliferation and differentiation. Dev Biol 2020. [DOI] [PMC free article] [PubMed] [Google Scholar]
- 12.Luo H, Zhu G, Xu J, Lai Q, Yan B, Guo Y et al. HOTTIP lncRNA Promotes Hematopoietic Stem Cell Self-Renewal Leading to AML-like Disease in Mice. Cancer Cell 2019; 36: 645–659 e648. [DOI] [PMC free article] [PubMed] [Google Scholar]
- 13.Singh AP, Hung YH, Shanahan MT, Kanke M, Bonfini A, Dame MK et al. Enteroendocrine Progenitor Cell-Enriched miR-7 Regulates Intestinal Epithelial Proliferation in an Xiap-Dependent Manner. Cell Mol Gastroenterol Hepatol 2020; 9: 447–464. [DOI] [PMC free article] [PubMed] [Google Scholar]
- 14.Fernandes JCR, Acuna SM, Aoki JI, Floeter-Winter LM, Muxel SM. Long Non-Coding RNAs in the Regulation of Gene Expression: Physiology and Disease. Noncoding RNA 2019; 5. [DOI] [PMC free article] [PubMed] [Google Scholar]
- 15.Furio-Tari P, Tarazona S, Gabaldon T, Enright AJ, Conesa A. spongeScan: A web for detecting microRNA binding elements in lncRNA sequences. Nucleic Acids Res 2016; 44: W176–180. [DOI] [PMC free article] [PubMed] [Google Scholar]
- 16.Dykes IM, Emanueli C. Transcriptional and Post-transcriptional Gene Regulation by Long Non-coding RNA. Genomics Proteomics Bioinformatics 2017; 15: 177–186. [DOI] [PMC free article] [PubMed] [Google Scholar]
- 17.Jonas S, Izaurralde E. Towards a molecular understanding of microRNA-mediated gene silencing. Nat Rev Genet 2015; 16: 421–433. [DOI] [PubMed] [Google Scholar]
- 18.Yendamuri S, Calin GA. The role of microRNA in human leukemia: a review. Leukemia 2009; 23: 1257–1263. [DOI] [PubMed] [Google Scholar]
- 19.Wallace JA, O’Connell RM. MicroRNAs and acute myeloid leukemia: therapeutic implications and emerging concepts. Blood 2017; 130: 1290–1301. [DOI] [PMC free article] [PubMed] [Google Scholar]
- 20.Garzon R, Pichiorri F, Palumbo T, Iuliano R, Cimmino A, Aqeilan R et al. MicroRNA fingerprints during human megakaryocytopoiesis. Proc Natl Acad Sci U S A 2006; 103: 5078–5083. [DOI] [PMC free article] [PubMed] [Google Scholar]
- 21.Tan Y, Zhang B, Wu T, Skogerbo G, Zhu X, Guo X et al. Transcriptional inhibiton of Hoxd4 expression by miRNA-10a in human breast cancer cells. BMC Mol Biol 2009; 10: 12. [DOI] [PMC free article] [PubMed] [Google Scholar]
- 22.Weiss FU, Marques IJ, Woltering JM, Vlecken DH, Aghdassi A, Partecke LI et al. Retinoic acid receptor antagonists inhibit miR-10a expression and block metastatic behavior of pancreatic cancer. Gastroenterology 2009; 137: 2136–2145 e2131–2137. [DOI] [PubMed] [Google Scholar]
- 23.Stadthagen G, Tehler D, Hoyland-Kroghsbo NM, Wen J, Krogh A, Jensen KT et al. Loss of miR-10a activates lpo and collaborates with activated Wnt signaling in inducing intestinal neoplasia in female mice. PLoS Genet 2013; 9: e1003913. [DOI] [PMC free article] [PubMed] [Google Scholar]
- 24.Neijts R, Amin S, van Rooijen C, Tan S, Creyghton MP, de Laat W et al. Polarized regulatory landscape and Wnt responsiveness underlie Hox activation in embryos. Genes Dev 2016; 30: 1937–1942. [DOI] [PMC free article] [PubMed] [Google Scholar]
- 25.Rodrigues AR, Yakushiji-Kaminatsui N, Atsuta Y, Andrey G, Schorderet P, Duboule D et al. Integration of Shh and Fgf signaling in controlling Hox gene expression in cultured limb cells. Proc Natl Acad Sci U S A 2017; 114: 3139–3144. [DOI] [PMC free article] [PubMed] [Google Scholar]
- 26.Denans N, Iimura T, Pourquie O. Hox genes control vertebrate body elongation by collinear Wnt repression. Elife 2015; 4. [DOI] [PMC free article] [PubMed] [Google Scholar]
- 27.Takacs-Vellai K, Vellai T, Chen EB, Zhang Y, Guerry F, Stern MJ et al. Transcriptional control of Notch signaling by a HOX and a PBX/EXD protein during vulval development in C. elegans. Dev Biol 2007; 302: 661–669. [DOI] [PubMed] [Google Scholar]
- 28.Li Z, Huang H, Chen P, He M, Li Y, Arnovitz S et al. miR-196b directly targets both HOXA9/MEIS1 oncogenes and FAS tumour suppressor in MLL-rearranged leukaemia. Nat Commun 2012; 3: 688. [DOI] [PMC free article] [PubMed] [Google Scholar]
- 29.Mo JS, Alam KJ, Kang IH, Park WC, Seo GS, Choi SC et al. MicroRNA 196B regulates FAS-mediated apoptosis in colorectal cancer cells. Oncotarget 2015; 6: 2843–2855. [DOI] [PMC free article] [PubMed] [Google Scholar]
- 30.Luo H, Wang F, Zha J, Li H, Yan B, Du Q et al. CTCF boundary remodels chromatin domain and drives aberrant HOX gene transcription in acute myeloid leukemia. Blood 2018; 132: 837–848. [DOI] [PMC free article] [PubMed] [Google Scholar]
- 31.Qiu Y, Xu M, Huang S. Long noncoding RNAs: Emerging regulators of normal and malignant hematopoiesis. Blood 2021. [DOI] [PMC free article] [PubMed] [Google Scholar]
- 32.Yamamura S, Imai-Sumida M, Tanaka Y, Dahiya R. Interaction and cross-talk between non-coding RNAs. Cell Mol Life Sci 2018; 75: 467–484. [DOI] [PMC free article] [PubMed] [Google Scholar]
- 33.Wang KC, Yang YW, Liu B, Sanyal A, Corces-Zimmerman R, Chen Y et al. A long noncoding RNA maintains active chromatin to coordinate homeotic gene expression. Nature 2011; 472: 120–124. [DOI] [PMC free article] [PubMed] [Google Scholar]
- 34.de Boer J, Walf-Vorderwulbecke V, Williams O. In focus: MLL-rearranged leukemia. Leukemia 2013; 27: 1224–1228. [DOI] [PubMed] [Google Scholar]
- 35.Love MI, Huber W, Anders S. Moderated estimation of fold change and dispersion for RNA-seq data with DESeq2. Genome Biol 2014; 15: 550. [DOI] [PMC free article] [PubMed] [Google Scholar]
- 36.Chou CH, Shrestha S, Yang CD, Chang NW, Lin YL, Liao KW et al. miRTarBase update 2018: a resource for experimentally validated microRNA-target interactions. Nucleic Acids Res 2018; 46: D296–D302. [DOI] [PMC free article] [PubMed] [Google Scholar]
- 37.Robinson JT, Thorvaldsdottir H, Winckler W, Guttman M, Lander ES, Getz G et al. Integrative genomics viewer. Nat Biotechnol 2011; 29: 24–26. [DOI] [PMC free article] [PubMed] [Google Scholar]
- 38.Heinz S, Benner C, Spann N, Bertolino E, Lin YC, Laslo P et al. Simple combinations of lineage-determining transcription factors prime cis-regulatory elements required for macrophage and B cell identities. Mol Cell 2010; 38: 576–589. [DOI] [PMC free article] [PubMed] [Google Scholar]
- 39.Huang DW, Sherman BT, Lempicki RA. Systematic and integrative analysis of large gene lists using DAVID bioinformatics resources. Nature Protocols 2009; 4: 44–57. [DOI] [PubMed] [Google Scholar]
- 40.McLean CY, Bristor D, Hiller M, Clarke SL, Schaar BT, Lowe CB et al. GREAT improves functional interpretation of cis-regulatory regions. Nat Biotechnol 2010; 28: 495–501. [DOI] [PMC free article] [PubMed] [Google Scholar]
- 41.Ross-Innes CS, Stark R, Teschendorff AE, Holmes KA, Ali HR, Dunning MJ et al. Differential oestrogen receptor binding is associated with clinical outcome in breast cancer. Nature 2012; 481: 389–393. [DOI] [PMC free article] [PubMed] [Google Scholar]
- 42.Schep AN, Wu BJ, Buenrostro JD, Greenleaf WJ. chromVAR : inferring transcription-factor-associated accessibility from single-cell epigenomic data. Nature Methods 2017; 14: 975-+. [DOI] [PMC free article] [PubMed] [Google Scholar]
Associated Data
This section collects any data citations, data availability statements, or supplementary materials included in this article.